

Abstract
The solute carrier family 13 member 5 (SLC13A5), a sodium-coupled citrate transporter, plays a key role in importing citrate from the circulation into liver cells. Recent evidence has revealed that SLC13A5 deletion protects mice from high-fat diet–induced hepatic steatosis and that mutation of the SLC13A5 orthologues in Drosophila melanogaster and Caenorhabditis elegans promotes longevity. However, despite the emerging importance of SLC13A5 in energy homeostasis, whether perturbation of SLC13A5 affects the metabolism and malignancy of hepatocellular carcinoma is unknown. Here, we sought to determine whether SLC13A5 regulates hepatic energy homeostasis and proliferation of hepatoma cells. RNAi-mediated silencing of SLC13A5 expression in two human hepatoma cell lines, HepG2 and Huh7, profoundly suppressed cell proliferation and colony formation, and induced cell cycle arrest accompanied by increased expression of cyclin-dependent kinase inhibitor p21 and decreased expression of cyclin B1. Furthermore, such suppressive effects were also observed on the growth of HepG2 cell-derived xenografts expressing SLC13A5-shRNA in nude mice. Metabolically, knockdown of SLC13A5 in HepG2 and Huh7 cells was associated with a decrease in intracellular levels of citrate, the ratio of ATP/ADP, phospholipid content, and ATP citrate lyase expression. Moreover, both in vitro and in vivo assays demonstrated that SLC13A5 depletion promotes activation of the AMP-activated protein kinase, which was accompanied by deactivation of oncogenic mechanistic target of rapamycin signaling. Together, our findings expand the role of SLC13A5 from facilitating hepatic energy homeostasis to influencing hepatoma cell proliferation and suggest a potential role of SLC13A5 in the progression of human hepatocellular carcinoma.
Keywords: cell proliferation, energy metabolism, hepatocellular carcinoma, liver metabolism, transporter, SLC13A5, citrate, AMPK, ATP citrate lyase (ACLY), cell proliferation
Introduction
Metabolic reprogramming has long been regarded as a hallmark of cancer, through which cancer cells switch from oxidative phosphorylation to glycolysis for ATP production even in microenvironments with sufficient oxygen (1, 2). To accommodate the challenge of rapid proliferation, cancer cell metabolism is remodeled to increase the biosynthesis of macromolecules including nucleotides, proteins, and lipids as building blocks of new cells (3, 4). Although the precise mechanisms underlying this metabolic reprogramming remain elusive, malignant cells often have perturbed metabolism that allows for the accumulation of many metabolic intermediates facilitating the production of cellular building materials (4, 5). Numerous studies have demonstrated that the use of glycolysis and the tricarboxylic acid (TCA)2 cycle intermediates for biosynthesis is a key feature of altered metabolism in cancer cells (6, 7). Among others, citrate, an intermediate metabolite located at the crossroads of glucose metabolism and energy production, is an important sensor of energy homeostasis (8).
Accumulating evidence suggests that citrate is involved in both physiological and pathophysiological processes including histone acetylation, insulin secretion, inflammation, cancer, neurological disorders, and non-alcoholic fatty liver disease (9, 10). Cytosolic citrate is cleaved into acetyl-CoA and oxaloacetate by ATP citrate lyase (ACLY) (11, 12). Both acetyl-CoA and oxaloacetate are cytosolic precursors of multiple anabolic reactions important for de novo biosynthesis of fatty acids and steroids that are required for rapid proliferation, particularly in cancer cells (13). The intracellular level of citrate is tightly controlled by a balance between synthesis and transport. Mitochondrial citrate derived from the TCA cycle is transported to the cytosol via the citrate carrier (CIC), a member of the solute carrier transporter family (SLC25A1), and the majority of studies to date have focused on this citrate transporter (14). For instance, limitation of citrate output from the mitochondria by CIC silencing is associated with decreased production of lipids and proinflammatory prostaglandins, as well as compromised adaptive cell survival responses (15, 16). In addition to mitochondrial synthesis and transport, cytosolic citrate can also be imported from the blood stream via a selective citrate uptake transporter SLC13A5, which is expressed predominantly in the liver (17, 18).
As a member of the sodium dicarboxylate/sulfate cotransporter family, SLC13A5 recognizes and transports various dicarboxylate and tricarboxylate TCA intermediates with citrate as the predominant substrate (19). SLC13A5 is most abundantly expressed in the plasma membrane of hepatocytes and controls the uptake of citrate into hepatocytes from the bloodstream, where the citrate concentration (100–150 μm) is severalfold greater than that of all other TCA intermediates combined, suggesting that SLC13A5 may play a key physiological role in facilitating the use of circulating citrate by the liver (18, 20, 21). The biological importance of SLC13A5 was initially observed in Drosophila melanogaster and Caenorhabditis elegans, in which reduced expression of the SLC13A5 homologues (also named Indy (I'm Not Dead Yet)) extends the life span of both organisms, mimicking caloric restriction (22, 23). Reduced expression of SLC13A5 protects mice and rats from high-fat diet (HFD)–induced adiposity and insulin resistance (24, 25). On the other hand, up-regulation of SLC13A5 expression was observed in obese, non-alcoholic fatty liver disease patients, HFD-treated rhesus monkeys, and xenobiotic-treated human and rat hepatocytes (26–28). Despite the emerging importance of SLC13A5 in hepatic energy homeostasis and metabolic disorders, it remains largely unknown whether the SLC13A5 gene affects the metabolism and malignant phenotype of cancer cells, and of hepatocellular carcinoma cells in particular.
The present study was undertaken to test the hypothesis that SLC13A5 functions as a nutrient regulator altering the proliferation of hepatoma cells by modulating energy homeostasis. Using lentivirus-driven shRNA knockdown, cell proliferation, colony formation, apoptosis, cell signaling analyses, as well as in vivo animal experiments, we demonstrated that down-regulation of SLC13A5 attenuates the growth of hepatoma cells both in vitro and in vivo. Suppression of SLC13A5 expression resulted in decreased levels of intracellular citrate, the ratio of ATP/ADP, and expression of ACLY. Additionally, SLC13A5 knockdown altered the activity of the AMP-activated protein kinase (AMPK)–mechanistic target of rapamycin (mTOR) axis.
Results
Knockdown of SLC13A5 inhibits proliferation of hepatoma cells
To investigate the role of SLC13A5 in the growth of hepatoma cells, HepG2 and Huh7 cells were infected with lentivirus carrying SLC13A5-shRNAs (sh13A5-1 and sh13A5-2) or the empty pGreenPuro vector (shCon) as a negative control. As shown in Fig. 1, A and B, both sh13A5-1 and sh13A5-2 markedly repressed the expression of SLC13A5 gene at the mRNA and protein levels. Importantly, silencing of SLC13A5 significantly repressed the proliferation of HepG2 and Huh7 cells in comparison with the shCon and non-infection control groups in a time-dependent manner (Fig. 1, C, D, and E). Moreover, colony formation assays revealed that depletion of SLC13A5 in HepG2 and Huh7 cells reduced the number and size of colonies formed on soft agar (Fig. 1F). In a separate experiment, ectopic expression of SLC13A5 in HepG2-sh13A5 and Huh7-sh13A5 cells partially rescued the growth of these hepatoma cells (Fig. 1G). On the other hand, the growth of PC3 cells (a prostate cancer cell line), which do not express SLC13A5, is not affected by the infection of sh13A5 (supplemental Fig. S1, A and B). In addition, knockdown of SLC13A5 in HepG2 and Huh7 cells has no significant influences on the expression of SLC25A1, the mitochondrial citrate transporter that is functionally related to SLC13A5 (supplemental Fig. S2). Together, these results suggest that SLC13A5 plays an important role in the growth and malignancy of human hepatoma cells such as HepG2 and Huh7 cells, in which this gene is highly expressed (supplemental Figs. S10–S12).
Figure 1.

Knockdown of SLC13A5 suppresses the growth of hepatoma cells in vitro. A and B, expression of mRNA and protein of SLC13A5 in HepG2 and Huh7 cells 72 h after SLC13A5 knockdown via lentivirus shRNA targeting different regions of SLC13A5 (sh13A5-1 and sh13A5-2). C and D, depletion of SLC13A5 in HepG2 and Huh7 cells results in suppression of cell growth in a time-dependent manner through both sh13A5-1 and sh13A5-2. E, HepG2 and Huh7 cells were visualized by Coomassie Blue staining 6 days after infection with lentivirus sh13A5-1, sh13A5-2, or shCon. F, knockdown of SLC13A5 in HepG2 and Huh7 cells inhibits colony formation in soft agar. Representative colony images are shown at magnifications of ×40 or ×200. The histograms represent mean ± S.D. of the cloning efficiency (%). G, the time-dependent growth curves of HepG2 and Huh7 cells infected with shCon or sh13A5 in the presence or absence of concomitant expression of ectopic SLC13A5. Results are expressed as mean ± S.D. from three independent experiments. *, p < 0.05, **, p < 0.01.
Knockdown of SLC13A5 inhibits cell cycle progression in HepG2 and Huh7 cells
Next, we tested whether the cell cycle of hepatoma cells was affected by knockdown of SLC13A5. Flow cytometry analysis revealed that silencing of SLC13A5 in HepG2 cells resulted in significant G1 arrest, with 60% of sh13A5-infected cells in the G0/G1 phase versus 36% of control cells (p < 0.05), while the cell population in the S and G2 phase was decreased to 20% versus 40% (p < 0.05) and 6% versus 14% (p < 0.01), respectively (Fig. 2A). Similar trends were observed when comparing sh13A5-transfected and control Huh7 cells (Fig. 2B). These results indicate that knockdown of SLC13A5 suppresses the growth of hepatoma cells, most likely through the induction of cell cycle arrest at the G1 phase. Further, RT-PCR and Western blotting analyses revealed that knockdown of SLC13A5 in HepG2 and Huh7 cells is associated with decreased expression of cyclin B1 (Fig. 2, C and D). Interestingly, although SLC13A5 silencing increased the expression of p21 in HepG2 cells, such a change is unclear in Huh7 cells due to the extremely low basal expression of p21 (Fig. 2, E and F), suggesting that p21-mediated cyclin-dependent kinase (CDK) inhibition contributes to the observed cell cycle arrest in HepG2 cells, while only playing a negligible role in Huh7 cells.
Figure 2.

Knockdown of SLC13A5 inhibits cell cycle progression in HepG2 and Huh7 cells. A and B, cell cycle analysis of HepG2 and Huh7 cells 6 days after infection with sh13A5 or shCon. The percentage of cells in different cell cycle phases was compared between cells infected with sh13A5 and shCon. C, RT-PCR was used to measure the mRNA expression of cyclin B1. D, Western blotting was carried out to measure the protein levels of cyclin B1 in HepG2 and Huh7 cells infected with sh13A5 or shCon. E and F, expression of p21 mRNA and protein was measured in HepG2 and Huh7 cells infected with sh13A5 or shCon. Data were collected from three independent experiments and expressed as mean ± S.D. *, p < 0.05; **, p < 0.01.
Knockdown of SLC13A5 does not induce apoptosis in HepG2 and Huh7 cells
To determine whether SLC13A5 knockdown-mediated suppression of hepatoma cell growth resulted from cell death and DNA damage, Hoechst 33342 and propidium iodide (PI) staining were employed to assess apoptotic nuclei and necrosis in HepG2 and Huh7 cells infected with SLC13A5-shRNA. As expected, MG132, a proteasome inhibitor, markedly increased the number of apoptotic and PI-positive secondary necrotic cells, while silencing of SLC13A5 did not affect either of these parameters (Fig. 3, A and B). Further assessment of the caspase 3 activity and DNA fragmentation revealed that SLC13A5 knockdown is not associated with either enhanced cleavage of caspase 3 or increased DNA fragmentation, which could be observed clearly in the treatment of MG132 as positive control (Fig. 3, C and D). These results indicate that SLC13A5 knockdown inhibits HepG2 and Huh7 cell growth without inducing significant apoptosis or DNA damage.
Figure 3.

SLC13A5 knockdown does not affect apoptosis of HepG2 and Huh7 cells. A and B, HepG2 and Huh7 cells were infected with sh13A5 or shCon for 6 days or treated with MG132 (1 μm) for 24 h as positive control. Cell density was visualized under phase-contrast microscopy. Representative fluorescence photographs depict apoptotic nuclei (white arrows) and PI-positive secondary necrotic nuclei (yellow arrows). C, caspase 3 activity was analyzed with Western blotting to detect the large fragment (17/19 kDa) of cleaved caspase 3 in HepG2 and Huh7 cells with or without SLC13A5 knockdown. β-Actin was used to normalize protein loading. D, DNA fragmentation was illustrated on agarose electrophoresis of genomic DNA extracted from HepG2 and Huh7 cells infected with sh13A5 or shCon or treated with MG132 (2 μm) for 48 h. Data presented are representative images from three independent experiments.
Knockdown of SLC13A5 influences intracellular levels of citrate and ATP, as well as AMPK–mTOR signaling in HepG2 and Huh7 cells
The primary function of SLC13A5 is to import circulating citrate into liver cells and maintain the intracellular energy balance (18). As demonstrated in Fig. 4, A and B, selective depletion of SLC13A5 resulted in significant reduction of intracellular citrate and the ATP/ADP ratio in HepG2 and Huh7 cells. Importantly, this change in cellular energy status is associated with increased phosphorylation of AMPKα and decreased activity of mTOR, two signaling molecules that serve as crucial cellular sensors for energy homeostasis and oxidative stress (Fig. 4C). On the other hand, exposure of Huh7 cells to higher levels of citrate resulted in decreased phosphorylation of AMPKα and an increased ATP/ADP ratio, while such changes were minimized when expression of SLC13A5 was depleted (Fig. 4, D and E). Collectively, these results suggest that reduction of intracellular citrate due to SLC13A5 depletion may contribute to the suppression of HepG2 and Huh7 cell proliferation through perturbation of the ATP/ADP ratio and AMPK–mTOR signaling.
Figure 4.

SLC13A5 knockdown influences intracellular levels of citrate and ATP, as well as AMPK–mTOR signaling. HepG2 and Huh7 cells were infected with lentivirus encoding the sh13A5 or shCon for 72 h. A and B, intracellular levels of citrate and the ratio of ATP/ADP were significantly decreased in SLC13A5-deficient cells. C, the protein levels of phospho-AMPKα (p-AMPKα), total AMPKα, phospho-mTOR (p-mTOR), total mTOR, and β-actin were analyzed by immunoblotting. In separate experiments, Huh7 cells infected with sh13A5 or shCon for 72 h were treated with citrate at 0, 0.2, and 0.4 mm for another 24 h. D, the protein levels of phospho-AMPKα, total AMPK, and β-actin were subjected to immunoblotting analysis. E, the ratio of ATP/ADP was also analyzed as described under “Experimental Procedures.” Data were collected from three independent experiments and expressed as mean ± S.D. in A, B, and E. *, p < 0.05; **, p < 0.01.
Knockdown of SLC13A5 suppresses ACLY expression in HepG2 and Huh7 cells
ACLY converts cytosolic citrate into acetyl-CoA, which has been viewed as the rate-limiting step of de novo lipogenesis in most cancers (29). The elevation of ACLY expression in many cancer cells suggests that ACLY inhibition may represent an attractive approach for cancer therapy (13). We next examined whether SLC13A5 knockdown affects the expression of ACLY in HepG2 and Huh7 cells. RT-PCR and Western blotting analyses showed that expression of ACLY was remarkably decreased at both the mRNA and protein levels after SLC13A5 depletion (Fig. 5, A and B). In addition, knockdown of SLC13A5 in HepG2 and Huh7 cells led to reduced intracellular phospholipids in comparison with cells infected with shCon control (Fig. 5, C and D). These data further support that SLC13A5 knockdown down-regulates ACLY expression and affects its function in lipogenesis.
Figure 5.

Knockdown of SLC13A5 suppresses ACLY expression in HepG2 and Huh7 cells. HepG2 and Huh7 cells were infected with lentivirus encoding the sh13A5 or shCon for 72 h. A, the relative expression levels of ACLY were quantified using real-time PCR. B, the protein levels of ACLY and β-actin were measured using immunoblotting. C and D, intracellular accumulation of phospholipids was measured using phospholipids conjugated to fluorescent dyes, and representative images depict the staining of nuclei (DAPI) and phospholipid visualized under fluorescence microscopy. Data were collected from three independent experiments and expressed as mean ± S.D. in A. **, p < 0.01.
SLC13A5 knockdown inhibits the growth of HepG2 xenograft in vivo
To determine whether depletion of SLC13A5 also attenuates growth of hepatoma cells in vivo, HepG2 cells transfected with SLC13A5-shRNA or shCon were injected subcutaneously into nude mice as detailed under “Experimental Procedures.” Tumor growth was monitored over a period of 6 weeks after tumor cell implantation. Our results showed that the average tumor volume and weight in the HepG2-sh13A5 group were significantly lower than tumors in the HepG2-shCon control group (p < 0.05) (Fig. 6, A–C). As expected, expression of SLC13A5 was significantly repressed in HepG2-sh13A5 xenografts (Fig. 6D). Marked repression of cyclin B1 and ACLY expression was observed in tumors derived from HepG2-sh13A5 in comparison with those from HepG2-shCon cells (Fig. 6, E and F). In agreement with the in vitro results, knockdown of SLC13A5 also resulted in increased phosphorylation of AMPKα and decreased phosphorylation of mTOR in vivo (Fig. 6G). Collectively, these data indicate that disruption of SLC13A5 suppresses human hepatoma cell proliferation both in vivo and in vitro by affecting energy metabolism and de novo lipid synthesis.
Figure 6.

SLC13A5 depletion inhibits growth of HepG2 xenograft in vivo. HepG2 cells were infected with lentivirus encoding sh13A5 or shCon. Four days after culture, equal numbers of HepG2-sh13A5 and HepG2-shCon cells were injected into the nude mice for xenograft formation as detailed under “Experimental Procedures.” A–C, tumor growth curves (A), images (B), and weights (C) for xenografts formed between sh13A5-1 (KD) and shCon (control) groups were measured during or at the end of 6 weeks. D–F, the mRNA expression of SLC13A5 (D), cyclin B1 (E), and ACLY (F) was measured by RT-PCR. G, Western blotting was used to measure the protein expression of SLC13A5, phospho-AMPKα (p-AMPKα), total AMPKα, phospho-mTOR (p-mTOR), total mTOR, ACLY, cyclin B1, and β-actin. Data are expressed as mean ± S.D. *, p < 0.05; **, p < 0.01.
Discussion
Increased de novo lipogenesis is a key characteristic of rapidly proliferating cancer cells, in which conversion of cytosolic citrate into acetyl-CoA and oxaloacetate by ACLY represents the initial and rate-limiting step for the biosynthesis of long-chain fatty acids and cholesterol as building blocks for cell growth (29, 30). In the liver, the level of cytosolic citrate is well-maintained through CIC-mediated export from the TCA cycle in mitochondria and SLC13A5-mediated uptake from the circulation (24, 31). Recent studies reveal that reduced expression of SLC13A5 in mice and rats or its analogues in D. melanogaster and C. elegans resulted in a number of metabolic benefits that either protect mice from HFD-induced obesity and insulin resistance or promote longevity in fruit flies and worms (22–25, 32). Given the emerging significance of SLC13A5 in hepatic energy homeostasis, we sought to determine whether SLC13A5 plays a role in the growth of human hepatoma cells. In the present study, we show for the first time that depletion of SLC13A5 in HepG2 and Huh7 cells suppressed cell proliferation and colony formation, while inducing cell cycle arrest. Metabolically, knockdown of SLC13A5 leads to significant decreases in intracellular levels of citrate, the ATP/ADP ratio, phospholipid content, and ACLY expression in HepG2 and Huh7 cells. Moreover, both in vitro and in vivo assays demonstrated that depletion of SLC13A5 also activates the cellular energy sensor AMPK, accompanied by the subsequent deactivation of oncogenic mTOR signaling. Together, these metabolic changes attenuate the growth of hepatocellular carcinoma cells (Fig. 7).
Figure 7.
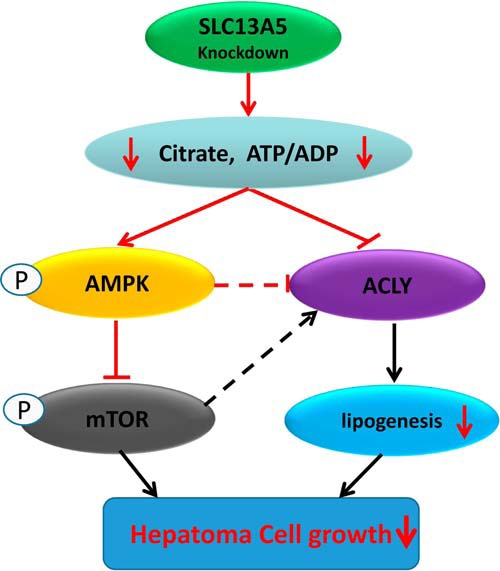
Schematic illustration of potential mechanisms by which SLC13A5 knockdown leads to the inhibition of hepatoma cell growth.
Induction of energy depletion has long been sought as an appealing strategy in the treatment of different malignancies (3, 33). Originally cloned from HepG2 cells, SLC13A5 is highly expressed in HepG2 and Huh7 cell lines in comparison with extrahepatic tumor cells. Our data demonstrate that selective knockdown of SLC13A5 attenuates the growth of these hepatoma cells without affecting the growth of other cancer cells exhibiting negligible expression of SLC13A5, which suggests that this citrate uptake transporter is essential for the growth of a subset of hepatoma cells. Thus, SLC13A5 might represent a risk factor for at least a subgroup of liver cancers.
Suppression of neoplastic progression generally involves decreased cell proliferation and/or stimulated cell death. Our results show that depletion of SLC13A5 suppressed the proliferation of HepG2 and Huh7 cells with significant G1 phase arrest along with decreased expression of cyclin B1 without affecting apoptosis or DNA damage. This is consistent with a previous study in which metformin, a known modulator of lipid metabolism, repressed HepG2 cell proliferation without affecting cell death (34). Notably, we observed that knockdown of SLC13A5 resulted in markedly increased expression of p21 in HepG2 but not in Huh7 cells. It is well-known that the transcription of the p21 gene is positively regulated by wild-type p53 protein (35). Given that HepG2 (wild-type p53) and Huh7 (mutant p53) cells hold different statuses of the p53 gene, the p53 mutation in Huh7 cells may contribute to the low level of p21 expression (36). Although deciphering the exact effects of p53 on the expression of p21 is out of the scope of this study, it is clear that induction of p21 by SLC13A5 silencing may contribute to the observed cell cycle arrest in HepG2 but not in Huh7 cells.
AMPK, a central regulator of cellular metabolism, plays a key role in the suppression of cancer cell growth in response to energy constriction. Under nutritional stress, reduction of the ATP/ADP ratio stimulates the activation of AMPK, which in turn directly phosphorylates and inhibits the activity of several downstream substrates, including acetyl-CoA carboxylase (ACC) and 3-hydroxy-3-methyl-glutaryl-CoA reductase (HMG-CoA), that are pivotal for lipid synthesis (37). Alternatively, AMPK also limits cancer cell growth by inhibiting tumorigenic mTOR signaling, which up-regulates energy use and protein synthesis during cancer progression (38). We found that knockdown of SLC13A5 is sufficient to decrease the intracellular levels of citrate and the ATP/ADP ratio in cultured HepG2 and Huh7 cells. These phenomena may mediate the observed phospho-activation of AMPKα and the subsequent inhibition of mTOR. Importantly, similar alterations of the AMPK–mTOR axis were confirmed in vivo with HepG2 cell-derived xenografts in nude mice, suggesting that depletion of SLC13A5 represses hepatoma cell proliferation through its impact on lipid metabolism and AMPK activity. Indeed, accumulating evidence indicates that many prototypical AMPK activators exhibit anti-cancer activities in both pre-clinical and clinical studies, and a number of known chemotherapeutic drugs are associated with the activation of AMPK (39, 40).
To fulfill the high energy requirements for excessive proliferation, cancer cells rewire metabolic pathways to increase lipogenesis and generate more biomass for membrane formation. ACLY is at the center of this metabolic shift, transferring metabolites from glycolysis to lipid synthesis using cytosolic citrate as its substrate and precursor (41). Enhanced activity or expression of ACLY has been documented in a number of cancers, making this enzyme an attractive therapeutic target with a number of selective inhibitors in development displaying anti-cancer property in both cell lines and animal models (29, 42). Mechanistically, activation of AMPK is believed to be one of the major pathways to inhibit ACLY expression by limiting the transcriptional activity of the sterol regulatory element-binding protein-1c (SREBP1c) (12, 43). On the other hand, a recent report showed that selective knockdown of ACLY can induce the phosphorylation and activation of AMPK in multiple cancer cell lines (45). In the current study, we found that depletion of SLC13A5 increased the activation of AMPK and reduced the expression of ACLY both in cultured hepatoma cells in vitro and in a xenograft model in vivo. Regardless of the undetermined causal relationship between AMPK and ACLY, it appears that energy restriction induced by SLC13A5 knockdown may trigger a feed-forward loop between AMPK activation and ACLY repression that leads to growth suppression in these human hepatoma cells.
In conclusion, the results described in this study support a novel role of SLC13A5 in the proliferation of a subset of human hepatocellular carcinoma cells. Using combined in vitro and in vivo approaches, we demonstrated that depletion of SLC13A5 leads to a reduction in the growth of HepG2 and Huh7 cells along with decreases in de novo lipogenesis, which may result from the activation of AMPK followed by the inhibition of mTOR activity and ACLY expression. Overall, our findings link the role of SLC13A5 in hepatic lipid homeostasis and its potential effects on the growth of human hepatoma cells, and suggest that SLC13A5 may represent a potential therapeutic target for both metabolic disorders and liver cancers.
Experimental procedures
Chemicals and biologic reagents
Citrate, Hoechst 33342, PI, Noble agar and MG132 were purchased from Sigma-Aldrich. Oligonucleotide primers were synthesized by Integrated DNA Technologies, Inc. (Coralville, IA). The antibodies used in this study include anti-SLC13A5 (ab89181; Abcam), anti-β-actin (Sigma-Aldrich), anti-cyclin B1 (sc-245; Santa Cruz Biotechnology), anti-p21 (sc-397; Santa Cruz Biotechnology), and antibodies against caspase 3 (9662S), phospho-mTOR (Ser-2448) (5536S), AMPK (2532S), phospho-AMPKα (Thr-172) (2535S), and ACLY (4332S) from Cell Signaling (Danvers, MA). Other cell culture reagents were purchased from Life Technologies or Sigma-Aldrich.
Cell culture and lentiviral infection
HepG2 cells were obtained from the American Tissue Culture Collection (Manassas, VA), and Huh7 cells were from Fisher Scientific. The authenticity of both lines was confirmed by short tandem repeat profiling analysis. HepG2 and Huh7 cells were cultured in DMEM supplemented with 10% fetal bovine serum, 100 units/ml penicillin, and 100 μg/ml streptomycin in humidified incubator at 37 °C and 5% CO2. SLC13A5 expression plasmid was generated by cloning the full-length cDNA into the EcoRI site of a modified pWPXLd lentiviral vector, which was kindly provided by Dr. Yun Qiu (University of Maryland School of Medicine) (46). For SLC13A5 knockdown plasmids, DNA oligonucleotides encoding SLC13A5 shRNAs (in which the targeted sequences were underlined) (sh13A5-1, GATCCGAGATCAACGTGCTGATCTGCTTCTCGAGAAGCAGATCAGCACGTTGATCTCTTTTTG; sh13A5-2, GATCCGGGTAGGCTCAGAAATGAAGGCTCGAGCCTTCATTTCTGAGCCTACCCTTTTTG) were subcloned into the BamHI and EcoRI sites of the pGreenPuroTM shRNA expression lentiviral vector from System Biosciences (Mountain View, CA). Lentivirus packaging was carried out following the protocol described previously (47). The titers of the lentivirus were determined by the Lenti-XTM p24 Rapid Titer Kit (Clontech Laboratories, Inc.) according to the manufacturer's instructions. For virus infection, HepG2 and Huh7 cells were infected with the lentivirus at the concentration of 5 × 10⁷ lentiviral particles per well in a 6-well plate. Seventy-two hours after infection, total RNA and proteins were prepared for real-time PCR and Western blot analysis as detailed below.
Real-time PCR analysis
Total RNA was isolated using the RNeasy Mini Kit (Qiagen) and reverse-transcribed using a High Capacity cDNA Archive Kit (Applied Biosystems, Foster City, CA) following the manufacturers' instructions. Real-time PCR assays were performed on an Applied Biosystems StepOnePlus (Applied Biosystems). Sequences of primers for the human SLC13A5, cyclin B1, ACLY, p21, and β-actin are listed in supplemental Table 1. Induction values were calculated according to the following equation: -fold over control = 2ΔΔCt, where ΔCt represents the differences in cycle threshold numbers between the target gene and β-actin, and ΔΔCt represents the relative change in these differences between control and treatment groups.
Western blot analysis
Cell homogenate proteins from cultured HepG2 or Huh7 cells or xenografts in vivo were resolved on SDS-polyacrylamide gels (12%) and electrophoretically transferred onto blotting membranes. Subsequently, membranes were incubated with antibodies against SLC13A5 (diluted 1:200), cyclin B1 (diluted 1:1000), caspase 3 (diluted 1:1000), phospho-mTOR (diluted 1:1000), AMPK (diluted 1:1000), phospho-AMPK (diluted 1:1000), ACLY (diluted 1:1000), or β-actin (diluted 1:3000). Blots were washed and incubated with horseradish peroxidase secondary antibodies, and then developed using enhanced chemiluminescence Western blotting detection reagent from GE Healthcare. Replicates of Western blots are shown in supplemental Figs. S3–S9. Densitometry was analyzed using National Institutes of Health ImageJ software.
Cell proliferation analysis
Cell proliferation was assayed using CCK-8 (Enzo Life Sciences, Inc.) according to the manufacturer's instructions. HepG2 and Huh7 cells were seeded at the density of 1.5 × 10³ per well in 96-well plates. Cells were infected with SLC13A5-shRNA or control lentivirus on day 0. At the time points of days 0, 2, 4, and 6, CCK-8 reagent (10 μl) was added into each well followed by incubation at 37 °C for 1.5 h. The absorbance was read at 450 nm on a 96-well plate reader (Tecan Trading AG, Männedorf, Switzerland). Relative cell growth rate was normalized against control on day 0. Triplicate samples from each time point were analyzed.
Soft agar assay
HepG2 and Huh7 cells were infected with SLC13A5-shRNA or control lentivirus as described above. Forty-eight hours after infection, cells were trypsinized and suspended in culture medium containing 0.3% melting agar and 10% FBS. Cell suspensions were then plated in 6-well cell culture plates pre-covered with 0.6% agar gel at a density of 5 × 10³ per well. The semi-solid agar gels containing cells were fed with DMEM culture medium every 3 days. The number of colonies from three randomly chosen fields per well were counted under a phase contrast microscope 2 weeks after cell plating. The cloning efficiency was calculated according to the following formula: cloning efficiency (%) = number of clones/number of inoculations × 100%. The experiment was carried out in triplicate.
Flow cytometry and cell death analysis
HepG2 and Huh7 cells were harvested 6 days after SLC13A5-shRNA or control lentivirus infection. After washing, 1 × 10⁶ cells from each group were resuspended in 200 μl of PBS, and then fixed by adding 800 μl of ice-cold 100% ethanol. The fixed cells were resuspended in 500 μl of PI staining solution (50 μg/ml PI, 0.1% Triton-X, 0.2 mg/ml RNase A), vortexed, and incubated for 20 min at 37 °C. The percentages of cells in different cell cycle phases were determined by flow cytometry FACScan (Becton Dickinson). HepG2 and Huh7 cells were stained with Hoechst 33342 (1 μm) for apoptotic nuclei or PI (1 μg/ml) for secondary necrosis or necrosis as described previously (34). HepG2 and Huh7 cells treated with MG132 (1 μm) for 24 h were used as positive controls. Stained cells were then visualized under a fluorescence microscope (Nikon Eclipse TE-2000E). Cells that displayed intensely condensed and/or fragment nuclei staining were considered as apoptotic cells.
DNA fragmentation
Genomic DNA either from HepG2 and Huh7 cells infected with SLC13A5-shRNA or control lentivirus for 72 h or from HepG2 and Huh7 cells treated with MG132 (2 μm) for 48 h was extracted and purified using the QIAamp DNA Blood Mini Kit (Qiagen) following the manufacturer's instructions. From each treatment group, 0.4 μg of DNA was electrophoresed on a 2% agarose gel containing 0.375 μg/ml ethidium bromide in Tris-acetate-EDTA (TAE) buffer at 100 V for 1 h. Images were acquired with a ChemiDoc MP System (Bio-Rad) to visualize the “DNA ladder” formation.
ADP/ATP ratio
HepG2 and Huh7 cells were seeded (1500 cells per well) in a 96-well, flat-bottom, white plate with clear bottoms (Costar) and grown in the medium described above. Seventy-two hours after infection by SLC13A5-shRNA or control lentivirus, the ADP/ATP ratio was measured based on luciferin–luciferase reaction using the ADP/ATP Ratio Assay Kit (Sigma-Aldrich) following the manufacturer's instructions.
Citrate concentration measurement and phospholipid staining
The level of citrate in HepG2 and Huh7 cells infected with SLC13A5-shRNA or control virus was determined using a commercially available citrate assay kit (Sigma-Aldrich) according to the manufacturer's instructions. The phospholipid staining assays were carried out with the HCS LipidTOXTM Red Phospholipidosis Detection Reagent (catalogue number: H34351; Thermo Fisher) following the manufacturer's instructions.
Xenograft analysis
All procedures of the animal studies were approved by the Institutional Animal Care and Use Committee (IACUC) of the University of Maryland School of Medicine. All animal experiments met the Animal Welfare guidelines. Mice were housed in laminar flow cabinets under specific pathogen-free conditions at room temperature with a 24-h night/day cycle and fed with pellets and water ad libitum. On day 4 after infection by SLC13A5-shRNA or control lentivirus, 3 × 10⁶ HepG2 cells were suspended in DMEM medium (100 μl) without FBS. After storing on ice for 1 h, cells were mixed with 50 μl of Matrigel and injected subcutaneously in the left and right flanks of 6-week-old female nude mice (n = 5) according to a previous publication (44). Mice in control and SLC13A5-shRNA groups were checked daily for toxicity/mortality. Tumors were measured twice a week with Vernier calipers for 6 weeks. Tumor volumes were calculated by the formula: r12 × r2/3 (r1 is the shortest and r2 is the longest diameter). The tumors were dissected and weighted at the end of the experiment. RNA and protein samples of the tumors were harvested for gene expression analysis.
Statistical analysis
All data represent at least three independent experiments and were expressed as the mean ± S.D. Statistical comparisons were made using one-way analysis of variance followed by a post hoc Dunnett's test or Student's t test where appropriate. Statistical significance was set at *, p < 0.05 and **, p < 0.01.
Author contributions
Z. L. designed and carried out experiments, analyzed data, and wrote the paper. D. L. carried out experiments and analyzed data. E. Y. C. and R. L. carried out xenograft experiments. L. Z., S. M. H., and P. S. designed experiments and reviewed the manuscript. H. W. designed experiments, analyzed data, and wrote the paper. All authors reviewed the results and approved the final version of the manuscript.
Supplementary Material
Acknowledgments
We thank Dr. Yun Qiu (University of Maryland School of Medicine) for kindly providing the modified pWPXLd vector. We are also grateful to members of the Wang laboratory for constructive comments on the manuscript.
Note added in proof
In the version of this article that was published as a Paper in Press on June 27, 2017, Fig. 1, C and D, used the same shCon and non-infection controls. For clarity, these data have been reorganized without altering the data.
The study was partially supported by National Institutes of Health Grant GM107058 (to H. W.). This work was also supported in part by the Research Participation Program at the Center for Drug Evaluation and Research, administered by the Oak Ridge Institute for Science and Education (ORISE) through an interagency agreement between the U. S. Department of Energy and FDA (to Z. L.). The authors declare that they have no conflicts of interest with the contents of this article. The content is solely the responsibility of the authors and does not necessarily represent the official views of the National Institutes of Health or the FDA.
This article was selected as one of our Editors' Picks.
This article contains supplemental Figs. S1–S12 and Table S1.
- TCA
- tricarboxylic acid
- ACLY
- ATP citrate lyase
- AMPK
- AMP-activated protein kinase
- CIC
- citrate carrier
- HFD
- high-fat diet
- mTOR
- mechanistic target of rapamycin
- PI
- propidium iodide.
References
- 1. Zheng J. (2012) Energy metabolism of cancer: glycolysis versus oxidative phosphorylation (Review). Oncol. Lett. 4, 1151–1157 [DOI] [PMC free article] [PubMed] [Google Scholar]
- 2. Vander Heiden M. G., Cantley L. C., and Thompson C. B. (2009) Understanding the Warburg effect: the metabolic requirements of cell proliferation. Science 324, 1029–1033 [DOI] [PMC free article] [PubMed] [Google Scholar]
- 3. Obre E., and Rossignol R. (2015) Emerging concepts in bioenergetics and cancer research: metabolic flexibility, coupling, symbiosis, switch, oxidative tumors, metabolic remodeling, signaling and bioenergetic therapy. Int. J. Biochem. Cell Biol. 59, 167–181 [DOI] [PubMed] [Google Scholar]
- 4. Menendez J. A., and Lupu R. (2007) Fatty acid synthase and the lipogenic phenotype in cancer pathogenesis. Nat. Rev. Cancer 7, 763–777 [DOI] [PubMed] [Google Scholar]
- 5. Currie E., Schulze A., Zechner R., Walther T. C., and Farese R. V. Jr. (2013) Cellular fatty acid metabolism and cancer. Cell Metab. 18, 153–161 [DOI] [PMC free article] [PubMed] [Google Scholar]
- 6. Coloff J. L., Murphy J. P., Braun C. R., Harris I. S., Shelton L. M., Kami K., Gygi S. P., Selfors L. M., and Brugge J. S. (2016) Differential glutamate metabolism in proliferating and quiescent mammary epithelial cells. Cell Metab. 23, 867–880 [DOI] [PubMed] [Google Scholar]
- 7. Pavlova N. N., and Thompson C. B. (2016) The emerging hallmarks of cancer metabolism. Cell Metab. 23, 27–47 [DOI] [PMC free article] [PubMed] [Google Scholar]
- 8. Iacobazzi V., and Infantino V. (2014) Citrate–new functions for an old metabolite. Biol. Chem. 395, 387–399 [DOI] [PubMed] [Google Scholar]
- 9. Icard P., Poulain L., and Lincet H. (2012) Understanding the central role of citrate in the metabolism of cancer cells. Biochim. Biophys. Acta 1825, 111–116 [DOI] [PubMed] [Google Scholar]
- 10. Mycielska M. E., Patel A., Rizaner N., Mazurek M. P., Keun H., Patel A., Ganapathy V., and Djamgoz M. B. A. (2009) Citrate transport and metabolism in mammalian cells: prostate epithelial cells and prostate cancer. Bioessays 31, 10–20 [DOI] [PubMed] [Google Scholar]
- 11. Chypre M., Zaidi N., and Smans K. (2012) ATP-citrate lyase: a mini-review. Biochem. Biophys. Res. Commun. 422, 1–4 [DOI] [PubMed] [Google Scholar]
- 12. Lettieri Barbato D., Vegliante R., Desideri E., and Ciriolo M. R. (2014) Managing lipid metabolism in proliferating cells: new perspective for metformin usage in cancer therapy. Biochim. Biophys. Acta 1845, 317–324 [DOI] [PubMed] [Google Scholar]
- 13. Zaidi N., Swinnen J. V., and Smans K. (2012) ATP-citrate lyase: a key player in cancer metabolism. Cancer Res. 72, 3709–3714 [DOI] [PubMed] [Google Scholar]
- 14. Palmieri F. (2013) The mitochondrial transporter family SLC25: identification, properties and physiopathology. Mol. Aspects Med. 34, 465–484 [DOI] [PubMed] [Google Scholar]
- 15. Infantino V., Convertini P., Cucci L., Panaro M. A., Di Noia M. A., Calvello R., Palmieri F., and Iacobazzi V. (2011) The mitochondrial citrate carrier: a new player in inflammation. Biochem. J. 438, 433–436 [DOI] [PubMed] [Google Scholar]
- 16. O'Neill L. A. (2011) A critical role for citrate metabolism in LPS signalling. Biochem. J. 438, e5–e6 [DOI] [PubMed] [Google Scholar]
- 17. Inoue K., Zhuang L., Maddox D. M., Smith S. B., and Ganapathy V. (2002) Structure, function, and expression pattern of a novel sodium-coupled citrate transporter (NaCT) cloned from mammalian brain. J. Biol. Chem. 277, 39469–39476 [DOI] [PubMed] [Google Scholar]
- 18. Inoue K., Fei Y. J., Zhuang L., Gopal E., Miyauchi S., and Ganapathy V. (2004) Functional features and genomic organization of mouse NaCT, a sodium-coupled transporter for tricarboxylic acid cycle intermediates. Biochem. J. 378, 949–957 [DOI] [PMC free article] [PubMed] [Google Scholar]
- 19. Inoue K., Zhuang L., and Ganapathy V. (2002) Human Na+-coupled citrate transporter: primary structure, genomic organization, and transport function. Biochem. Biophys. Res. Commun. 299, 465–471 [DOI] [PubMed] [Google Scholar]
- 20. Gopal E., Miyauchi S., Martin P. M., Ananth S., Srinivas S. R., Smith S. B., Prasad P. D., and Ganapathy V. (2007) Expression and functional features of NaCT, a sodium-coupled citrate transporter, in human and rat livers and cell lines. Am. J. Physiol. Gastrointest. Liver Physiol. 292, G402–G408 [DOI] [PubMed] [Google Scholar]
- 21. Pajor A. M. (2014) Sodium-coupled dicarboxylate and citrate transporters from the SLC13 family. Pflugers Arch. 466, 119–130 [DOI] [PubMed] [Google Scholar]
- 22. Rogina B., Reenan R. A., Nilsen S. P., and Helfand S. L. (2000) Extended life-span conferred by cotransporter gene mutations in Drosophila. Science 290, 2137–2140 [DOI] [PubMed] [Google Scholar]
- 23. Fei Y. J., Liu J. C., Inoue K., Zhuang L., Miyake K., Miyauchi S., and Ganapathy V. (2004) Relevance of NAC-2, an Na+-coupled citrate transporter, to life span, body size and fat content in Caenorhabditis elegans. Biochem. J. 379, 191–198 [DOI] [PMC free article] [PubMed] [Google Scholar]
- 24. Birkenfeld A. L., Lee H. Y., Guebre-Egziabher F., Alves T. C., Jurczak M. J., Jornayvaz F. R., Zhang D., Hsiao J. J., Martin-Montalvo A., Fischer-Rosinsky A., Spranger J., Pfeiffer A. F., Jordan J., Fromm M. F., König J., et al. (2011) Deletion of the mammalian INDY homolog mimics aspects of dietary restriction and protects against adiposity and insulin resistance in mice. Cell Metab. 14, 184–195 [DOI] [PMC free article] [PubMed] [Google Scholar]
- 25. Pesta D. H., Perry R. J., Guebre-Egziabher F., Zhang D., Jurczak M., Fischer-Rosinsky A., Daniels M. A., Willmes D. M., Bhanot S., Bornstein S. R., Knauf F., Samuel V. T., Shulman G. I., and Birkenfeld A. L. (2015) Prevention of diet-induced hepatic steatosis and hepatic insulin resistance by second generation antisense oligonucleotides targeted to the longevity gene mIndy (Slc13a5). Aging (Albany NY) 7, 1086–1093 [DOI] [PMC free article] [PubMed] [Google Scholar]
- 26. von Loeffelholz C., Lieske S., Neuschäfer-Rube F., Willmes D. M., Raschzok N., Sauer I. M., König J., Fromm M., Horn P., Chatzigeorgiou A., Pathe-Neuschäfer-Rube A., Jordan J., Pfeiffer A. F., Mingrone G., Bornstein S. R., et al. (2017) The human longevity gene homolog INDY and interleukin-6 Interact in hepatic lipid metabolism. Hepatology 10.1002/hep.29089 [DOI] [PMC free article] [PubMed] [Google Scholar]
- 27. Li L., Li H., Garzel B., Yang H., Sueyoshi T., Li Q., Shu Y., Zhang J., Hu B., Heyward S., Moeller T., Xie W., Negishi M., and Wang H. (2015) SLC13A5 is a novel transcriptional target of the pregnane X receptor and sensitizes drug-induced steatosis in human liver. Mol. Pharmacol. 87, 674–682 [DOI] [PMC free article] [PubMed] [Google Scholar]
- 28. Neuschäfer-Rube F., Schraplau A., Schewe B., Lieske S., Krützfeldt J. M., Ringel S., Henkel J., Birkenfeld A. L., and Püschel G. P. (2015) Arylhydrocarbon receptor-dependent mIndy (Slc13a5) induction as possible contributor to benzo[a]pyrene-induced lipid accumulation in hepatocytes. Toxicology 337, 1–9 [DOI] [PubMed] [Google Scholar]
- 29. Hatzivassiliou G., Zhao F., Bauer D. E., Andreadis C., Shaw A. N., Dhanak D., Hingorani S. R., Tuveson D. A., and Thompson C. B. (2005) ATP citrate lyase inhibition can suppress tumor cell growth. Cancer Cell 8, 311–321 [DOI] [PubMed] [Google Scholar]
- 30. Zaidi N., Royaux I., Swinnen J. V., and Smans K. (2012) ATP citrate lyase knockdown induces growth arrest and apoptosis through different cell- and environment-dependent mechanisms. Mol. Cancer Ther. 11, 1925–1935 [DOI] [PubMed] [Google Scholar]
- 31. Catalina-Rodriguez O., Kolukula V. K., Tomita Y., Preet A., Palmieri F., Wellstein A., Byers S., Giaccia A. J., Glasgow E., Albanese C., and Avantaggiati M. L. (2012) The mitochondrial citrate transporter, CIC, is essential for mitochondrial homeostasis. Oncotarget 3, 1220–1235 [DOI] [PMC free article] [PubMed] [Google Scholar]
- 32. Neretti N., Wang P. Y., Brodsky A. S., Nyguyen H. H., White K. P., Rogina B., and Helfand S. L. (2009) Long-lived Indy induces reduced mitochondrial reactive oxygen species production and oxidative damage. Proc. Natl. Acad. Sci. U.S.A. 106, 2277–2282 [DOI] [PMC free article] [PubMed] [Google Scholar]
- 33. Rodríguez-Enríquez S., Marín-Hernández A., Gallardo-Pérez J. C., Carreño-Fuentes L., and Moreno-Sánchez R. (2009) Targeting of cancer energy metabolism. Mol. Nutr. Food Res. 53, 29–48 [DOI] [PubMed] [Google Scholar]
- 34. Yang H., Peng Y. F., Ni H. M., Li Y., Shi Y. H., Ding W. X., and Fan J. (2015) Basal autophagy and feedback activation of Akt are associated with resistance to metformin-induced inhibition of hepatic tumor cell growth. PLoS ONE 10, e0130953. [DOI] [PMC free article] [PubMed] [Google Scholar]
- 35. Hoffman W. H., Biade S., Zilfou J. T., Chen J., and Murphy M. (2002) Transcriptional repression of the anti-apoptotic survivin gene by wild type p53. J. Biol. Chem. 277, 3247–3257 [DOI] [PubMed] [Google Scholar]
- 36. Brito A. F., Abrantes A. M., Pinto-Costa C., Gomes A. R., Mamede A. C., Casalta-Lopes J., Gonçalves A. C., Sarmento-Ribeiro A. B., Tralhão J. G., and Botelho M. F. (2012) Hepatocellular carcinoma and chemotherapy: the role of p53. Chemotherapy 58, 381–386 [DOI] [PubMed] [Google Scholar]
- 37. Carlson C. A., and Kim K. H. (1973) Regulation of hepatic acetyl coenzyme A carboxylase by phosphorylation and dephosphorylation. J. Biol. Chem. 248, 378–380 [PubMed] [Google Scholar]
- 38. Sanli T., Steinberg G. R., Singh G., and Tsakiridis T. (2014) AMP-activated protein kinase (AMPK) beyond metabolism: a novel genomic stress sensor participating in the DNA damage response pathway. Cancer Biol. Ther. 15, 156–169 [DOI] [PMC free article] [PubMed] [Google Scholar]
- 39. Bhalla K., Hwang B. J., Dewi R. E., Twaddel W., Goloubeva O. G., Wong K. K., Saxena N. K., Biswal S., and Girnun G. D. (2012) Metformin prevents liver tumorigenesis by inhibiting pathways driving hepatic lipogenesis. Cancer Prev. Res. (Phila.) 5, 544–552 [DOI] [PMC free article] [PubMed] [Google Scholar]
- 40. Zulato E., Bergamo F., De Paoli A., Griguolo G., Esposito G., De Salvo G. L., Mescoli C., Rugge M., Nardin M., Di Grazia L., Lonardi S., Indraccolo S., and Zagonel V. (2014) Prognostic significance of AMPK activation in advanced stage colorectal cancer treated with chemotherapy plus bevacizumab. Br. J. Cancer 111, 25–32 [DOI] [PMC free article] [PubMed] [Google Scholar]
- 41. Migita T., Okabe S., Ikeda K., Igarashi S., Sugawara S., Tomida A., Soga T., Taguchi R., and Seimiya H. (2014) Inhibition of ATP citrate lyase induces triglyceride accumulation with altered fatty acid composition in cancer cells. Int. J. Cancer 135, 37–47 [DOI] [PubMed] [Google Scholar]
- 42. Migita T., Narita T., Nomura K., Miyagi E., Inazuka F., Matsuura M., Ushijima M., Mashima T., Seimiya H., Satoh Y., Okumura S., Nakagawa K., and Ishikawa Y. (2008) ATP citrate lyase: activation and therapeutic implications in non-small cell lung cancer. Cancer Res. 68, 8547–8554 [DOI] [PubMed] [Google Scholar]
- 43. Li Y., Xu S., Mihaylova M. M., Zheng B., Hou X., Jiang B., Park O., Luo Z., Lefai E., Shyy J. Y., Gao B., Wierzbicki M., Verbeuren T. J., Shaw R. J., Cohen R. A., and Zang M. (2011) AMPK phosphorylates and inhibits SREBP activity to attenuate hepatic steatosis and atherosclerosis in diet-induced insulin-resistant mice. Cell Metab. 13, 376–388 [DOI] [PMC free article] [PubMed] [Google Scholar]
- 44. Dai B., Zhao X. F., Mazan-Mamczarz K., Hagner P., Corl S., Bahassi el M., Lu S., Stambrook P. J., Shapiro P., and Gartenhaus R. B. (2011) Functional and molecular interactions between ERK and CHK2 in diffuse large B-cell lymphoma. Nat. Commun. 2, 402. [DOI] [PMC free article] [PubMed] [Google Scholar]
- 45. Lee J. H., Jang H., Lee S. M., Lee J. E., Choi J., Kim T. W., Cho E. J., and Youn H. D. (2015) ATP-citrate lyase regulates cellular senescence via an AMPK- and p53-dependent pathway. FEBS J. 282, 361–371 [DOI] [PubMed] [Google Scholar]
- 46. Guo Z., Yang X., Sun F., Jiang R., Linn D. E., Chen H., Chen H., Kong X., Melamed J., Tepper C. G., Kung H. J., Brodie A. M., Edwards J., and Qiu Y. (2009) A novel androgen receptor splice variant is up-regulated during prostate cancer progression and promotes androgen depletion-resistant growth. Cancer Res. 69, 2305–2313 [DOI] [PMC free article] [PubMed] [Google Scholar]
- 47. Rubinson D. A., Dillon C. P., Kwiatkowski A. V., Sievers C., Yang L., Kopinja J., Rooney D. L., Zhang M., Ihrig M. M., McManus M. T., Gertler F. B., Scott M. L., and Van Parijs L. (2003) A lentivirus-based system to functionally silence genes in primary mammalian cells, stem cells and transgenic mice by RNA interference. Nat. Genet. 33, 401–406 [DOI] [PubMed] [Google Scholar]
Associated Data
This section collects any data citations, data availability statements, or supplementary materials included in this article.