

Abstract
Background
The aim of this study was to describe the age‐dependent changes in the parameters of physical performance and body composition in Japanese older adults who are independently dwelling in the community. We also examined whether the age‐dependent changes differ among physical performance and body composition parameters.
Methods
Cross‐sectional data from 10 092 community‐dwelling older adults (mean age 73.6 years; 5296 women) were analyzed. The measures of physical performance included hand‐grip strength, the five‐times‐sit‐to‐stand test, and walking speed. Body composition parameters (body weight, fat mass, and appendicular skeletal muscle mass) were measured with a bioelectrical impedance analyser. Correlations between age and the physical performance and body composition parameters were tested. The T‐scores of physical performance and body composition measurements were calculated and presented according to 5‐year age groups to examine the differences in age‐dependent changes in physical performance and body composition parameters.
Results
All physical performance measures significantly decreased with aging. The cumulative mean T‐scores according to age group showed different age‐dependent changes between body mass index (BMI) and appendicular skeletal muscle mass index (ASMI) (cumulative mean T‐score change of BMI and ASMI of −5.7 to −2.9 and −12.7 to −12.1, respectively). The slope declines in age‐associated changes were greater in grip strength (β = −0.77, 95% confidence interval = −0.82 to −0.76) for men and in walking speed (β = −0.95, 95% confidence interval = −0.99 to −0.90) for women.
Conclusions
The patterns of age‐dependent decreases in physical performance measures differed among parameters and between sexes. There is a possibility of a difference in the age‐related slope patterns among parameters; decreases in grip strength in men and walking speed in women may be more prominent with advancing age. Furthermore, the decrease in ASMI with age is more striking than that of BMI.
Keywords: Muscle mass, Muscle strength, Mobility, Aging
Introduction
Several important contributors to the ability of older adults to live independently have been reported.1 Physical performance, including grip strength, lower‐extremity muscle strength, and walking speed, could be significant predictors of adverse health events such as disability,2, 3, 4 hospitalization,5 and mortality6, 7, 8 among older adults. Age‐related declines in muscle strength and mobility have been investigated, and ethnicity‐ and sex‐based differences have been reported.9, 10, 11
Sarcopenia, defined as low skeletal muscle mass, is common in older persons and significantly associated with functional decline and disability.12, 13 Recently, several organizations worldwide, including the International Working Group on Sarcopenia,14 the European Working Group on Sarcopenia in Older People,15 and the Asian Working Group for Sarcopenia,16 have proposed more accurate definitions for sarcopenia, including loss of not only skeletal muscle mass but also functionality, such as weakness and slowness. Muscle mass may be a major determinant of the age‐ and sex‐related differences in muscle strength.17 Muscle mass peaks between the second and fourth decades of life, and subsequently declines steadily with aging.18
Although some previous studies with large populations (1000 or more participants) of older Asians have examined age‐dependent changes in physical performance19 and body composition,20, 21, 22 few studies have demonstrated differences among age‐dependent changes in specific measures of physical performance (grip strength, lower‐extremity muscle strength, and walking speed) and body composition (body mass and appendicular skeletal muscle) in the same large cohort.
The aim of this study was to describe the age‐dependent changes in multidimensional physical performance measures and body composition parameters by using data from a cross‐sectional national study including >10 000 Japanese older adults who were independently dwelling in the community. We also examined whether the age‐dependent changes differ among the parameters of physical performance and body composition.
Materials and methods
National Center for Geriatrics and Gerontology‐Study of Geriatric Syndromes cohort
We used data from the National Center for Geriatrics and Gerontology‐Study of Geriatric Syndromes (NCGG‐SGS), a cohort study with a primary goal to establish a screening system for geriatric syndromes in the community‐dwelling population. In our national study, we assessed 10 885 persons, aged 65 years and older, who were enrolled in the NCGG‐SGS.23, 24 Each participant was recruited from either Midori Ward (a part of Nagoya City) or Obu City, Japan. Our inclusion criteria were as follows: participants from Obu aged 65 years or older (August 2011–February 2012) and those from Midori (Nagoya) aged 70 years or older (July 2013–December 2013) at the time of the examination. All participants resided in Obu City or Midori Ward, Nagoya City. We excluded participants with neurological disorders such as stroke and Parkinson's disease, as well as those with cognitive impairment (Mini‐mental State Examination score <18).25 Of the initial 10 885 participants, 793 were excluded; thus, data from 10 092 older adults (mean age 73.6 ± 5.5 years; 4796 men, 5296 women) were analysed in the present study. Informed consent was obtained from all participants before their inclusion in the study, and the ethics committee of the National Center for Geriatrics and Gerontology approved the study protocol.
Assessment of characteristics
Licensed nurses recorded demographic data, including age, sex, number of prescribed medications, and medical history in face‐to‐face interviews. The participants were asked about their history of the following diagnoses: stroke, Parkinson's disease, hypertension, heart disease, diabetes mellitus, osteoporosis, and arthritis.
Assessments of physical performance
Measures of physical performance included grip strength, the five‐times‐sit‐to‐stand test (FTSS), and walking speed. Well‐trained assessors administered these tests.
Grip strength was measured in kilograms for the dominant hand of the participant, by using a Smedley‐type handheld dynamometer (GRIP‐D; Takei Ltd, Niigata, Japan). The FTSS involved standing up and sitting down five times from a sitting position, as quickly as possible without pushing off.26 In the FTSS, well‐trained assessors recorded the time taken to perform five consecutive chair‐stands (timed to 0.1 s) from a seated position on a 45 cm tall chair, with arms folded across the chest. Walking speed was measured in seconds, by using a stopwatch. Participants were asked to walk on a flat and straight surface at a comfortable walking speed. Two markers were used to indicate the start and end of a 2.4 m walk path, with a 2 m section to be traversed before passing the start marker, such that participants were walking at a comfortable pace by the time they reached the timed path.27
Assessment of body composition
Body composition parameters were examined by using a multifrequency bioelectrical impedance analyser (BIA) (MC‐980A; Tanita, Tokyo, Japan); this tool is used to assess whole and segmental body composition.28 The BIA instrument used six electrical frequencies (1, 5, 50, 250, 500, and 1000 kHz). The surface of the hand electrode was placed in contact with each of the five fingers, while the heels and forefoot of the participant were placed on the circular‐shaped foot electrode. The participants held out their arms and legs to avoid contact with any other body segments during the measurements. The measurements were recorded by well‐trained staff and completed within 30 s. The BIA assessment was performed between 10:00 AM and 4:00 PM. The participants were required to fast and avoid vigorous exercise for at least 1 h before BIA assessment. Height was measured with a standard stadiometer (Seca, Marsden, UK). Body mass index (BMI) was calculated by dividing the body weight (kg) by the square of body height (m2). Appendicular skeletal muscle index (ASMI) was derived from the appendicular muscle mass (kg) divided by the square of height (m2).29
Statistical analysis
Means, standard deviations, and proportions were calculated to describe the samples and provide summary information about the measures used. Student's t‐test and chi‐square test were used to compare differences in measurements between the sexes. Pearson's correlation coefficients were calculated to assess the simple correlations of physical performance measures and body composition parameters with age. According to Pearson's coefficient (r), the correlations were graded as weak (r < 0.3), moderate (0.3 < 0.5), or strong (r > 0.5).30 We calculated the means of physical performance measures including grip strength, FTSS, and walking speed, and those of body composition parameters including body weight, fat mass, and appendicular muscle mass in each age group. The age‐dependent changes were then plotted.
To compare the differences in the age‐dependent changes among various measures, T‐scores were calculated by using the following equation:
Then, the T‐scores for each measure in the 65–69 year age group were set as references (i.e. T‐score = 50), and the cumulative mean T‐score change for each age group was calculated. For the T‐score curve for the FTSS, we inverted the curve in a logical manner (decreasing with advancing age).
For the evaluation of the slope decline in age‐associated changes among parameters including grip strength, FTSS, and walking speed for physical performance and BMI and ASMI for body composition, we estimated the regression coefficients by using linear regression. The T‐score changes that were set as references for each parameter in the 65–69 year age group were used as dependent variables in the linear regression analysis. Linear regression coefficients (β) and 95% confidence intervals (CIs) for each parameter were calculated in men and women, separately.
Data entry and analysis were performed by using IBM SPSS Statistics for Windows (version 23.0; SPSS Inc., Chicago, IL, USA). A P value of <0.05 was considered statistically significant.
Results
Table 1 lists the characteristics of the participants. Older men exhibited significantly better values for grip strength and FTSS than women (P < 0.01); however, walking speed did not differ between sexes (P = 0.83). Among the body composition measures, body weight and appendicular muscle mass were higher in men, and fat mass was higher in women (P < 0.01).
Table 1.
Participant characteristics
| Overall (N = 10 092) | Missing data (n)a | Men (n = 4796) | Women (n = 5296) | P | |
|---|---|---|---|---|---|
| Age (years), mean ± SDb | 73.6 ± 5.6 | — | 73.7 ± 5.6 | 73.6 ± 5.6 | 0.114 |
| Age groups, n (%) | |||||
| 65–69 years | 2389 (23.7%) | — | 1101 (23.0%) | 1288 (24.3%) | 0.108 |
| 70–74 years | 3642 (36.1%) | — | 1759 (36.7%) | 1883 (35.6%) | 0.241 |
| 75–79 years | 2509 (24.9%) | — | 1161 (24.2%) | 1348 (25.5%) | 0.148 |
| 80–84 years | 1177 (11.7%) | — | 588 (12.3%) | 589 (11.1%) | 0.075 |
| 85 years and older | 375 (3.7%) | — | 187 (3.9%) | 188 (3.5%) | 0.354 |
| Medical diagnoses, n (%) | |||||
| Hypertension | 4642 (46.0%) | 2 | 2289 (47.7%) | 2353 (44.5%) | 0.002 |
| Heart disease | 1730 (17.2%) | 13 | 975 (20.4%) | 755 (14.3%) | <0.001 |
| Diabetes mellitus | 1287 (12.8%) | 3 | 765 (16.0%) | 522 (9.9%) | <0.001 |
| Osteoporosis | 1357 (13.5%) | 5 | 84 (1.8%) | 1,273 (24.1%) | <0.001 |
| Arthritis | 1828 (18.2%) | 18 | 509 (10.6%) | 1,319 (25.0%) | <0.001 |
| Prescribed medications (n), mean ± SD | 2.6 ± 2.6 | 27 | 2.6 ± 2.6 | 2.7 ± 2.5 | 0.026 |
| Education (years), mean ± SD | 11.7 ± 2.2 | 12 | 12.3 ± 2.8 | 11.2 ± 2.2 | <0.001 |
| Living alone, n (%) | 1241 (12.3%) | 22 | 285 (6.0%) | 956 (18.1%) | <0.001 |
| Physical performance measures | |||||
| Grip strength (kg), mean ± SD | 26.6 ± 7.8 | 291 | 32.8 ± 6.1 | 20.9 ± 4.1 | <0.001 |
| Five‐times‐sit‐to‐stand test (s), mean ± SD | 8.93 ± 3.06 | 395 | 8.80 ± 2.84 | 9.04 ± 3.24 | <0.001 |
| Walking speed (m/s), mean ± SD | 1.14 ± 0.23 | 28 | 1.14 ± 0.22 | 1.14 ± 0.24 | 0.830 |
| Body composition measures | |||||
| Height (cm), mean ± SD | 156.3 ± 8.7 | 12 | 163.3 ± 5.8 | 150.0 ± 5.6 | <0.001 |
| Body weight (kg), mean ± SD | 56.8 ± 10.1 | 52 | 62.7 ± 8.7 | 51.5 ± 8.1 | <0.001 |
| Fat mass (kg), mean ± SD | 15.9 ± 5.8 | 89 | 14.6 ± 5.1 | 17.1 ± 6.1 | <0.001 |
| Appendicular muscle mass (kg), mean ± SD | 17.1 ± 4.1 | 89 | 20.5 ± 2.9 | 13.9 ± 1.8 | <0.001 |
| BMI (kg/m2), mean ± SD | 23.2 ± 3.1 | 52 | 23.5 ± 2.8 | 22.9 ± 3.3 | <0.001 |
| ASMI (kg/m2), mean ± SD | 6.9 ± 1.1 | 89 | 7.7 ± 0.9 | 6.2 ± 0.7 | <0.001 |
n, number.
SD, standard deviation.
BMI, body mass index.
ASMI, appendicular skeletal muscle mass index.
ASMI was derived from the appendicular muscle mass (kg) divided by the square of height (m2).
Table 2 shows the correlations between age and physical performance and body comparison parameters assessed by using Pearson correlation coefficients. For physical performance measures, grip strength (men: r = −0.44, P < 0.01; women: r = −0.36, P < 0.01), FTSS (men: r = 0.27, P < 0.01; women: r = 0.33, P < 0.01), and walking speed (men: r = −0.37, P < 0.01; women: r = −0.48, P < 0.01) showed significant weak to moderate negative associations with advancing age. For body composition parameters, body weight (men: r = −0.23, P < 0.01; women: r = −0.17, P < 0.01) and appendicular muscle mass (men: r = −0.32, P < 0.01; women: r = −0.32, P < 0.01) showed significant weak and moderate negative associations with advancing age, respectively. Fat mass showed a significant slight association (r = −0.05, P < 0.01) with age in women; however, there was no significant association in men (r = −0.02, P = 0.21).
Table 2.
Correlations of age with physical performance measures and body comparison parameters: Pearson correlation coefficients
| Grip strength, kg | FTSSa, s | Walking speed, m/s | Body weight, kg | Fat mass, kg | Appendicular muscle mass, kg | |
|---|---|---|---|---|---|---|
| Men | −0.44** | 0.27** | −0.37** | −0.23** | −0.02 | −0.32** |
| Women | −0.36** | 0.33** | −0.48** | −0.17** | −0.05** | −0.32** |
FTSS, five‐times‐sit‐to‐stand test.
P < 0.01.
Figures 1 and 2 show the age‐dependent changes in physical performance and body composition parameters. Poorer performance was observed in all physical performance measures with advancing age (Figure 1). The sex‐based difference in grip strength was greater than that of FTSS and walking speed; the sex‐based difference decreased with age. For body composition, body weight and appendicular muscle mass showed greater values in men than in women at all ages; however, fat mass was greater in women than in men at all ages (Figure 2). Body weight and appendicular muscle mass gradually declined with advancing age. Fat mass showed a smaller decline with aging.
Figure 1.
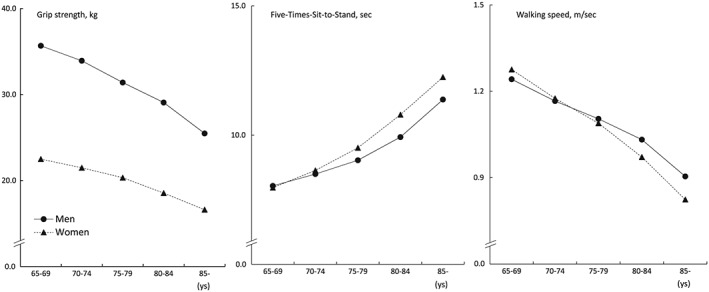
Age‐dependent changes in physical performance measurements.
Figure 2.
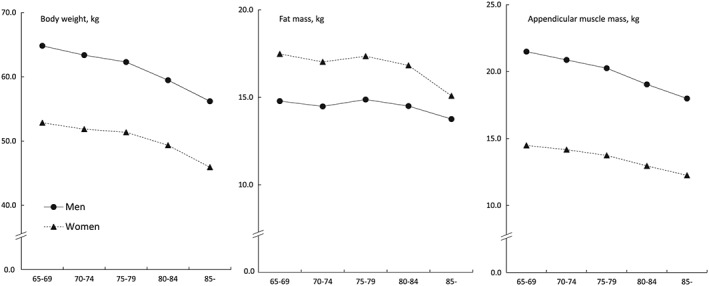
Age‐dependent changes in body composition parameters.
Figure 3 shows the cumulative mean T‐score changes in physical performance measures. The trends toward age‐related declines in physical performance differed between the sexes. All physical performance measures worsened with advancing age. Particularly, declines in grip strength in men (cumulative mean T‐score changes of grip strength in the ≥85 year age group: −16.8 in men and − 14.4 in women) and walking speed in women (cumulative mean T‐score changes of walking speed in the ≥85 year age group: −14.4 in men and − 20.7 in women) were more prominent with aging. The cumulative mean T‐scores according to age group showed different age‐dependent changes between BMI and ASMI, with an obvious age‐related change in ASMI (cumulative mean T‐score changes of BMI in the ≥85 year age group: −5.7 in men and −2.9 in women; those of ASMI: −12.1 in men and −12.7 in women) (Figure 4).
Figure 3.
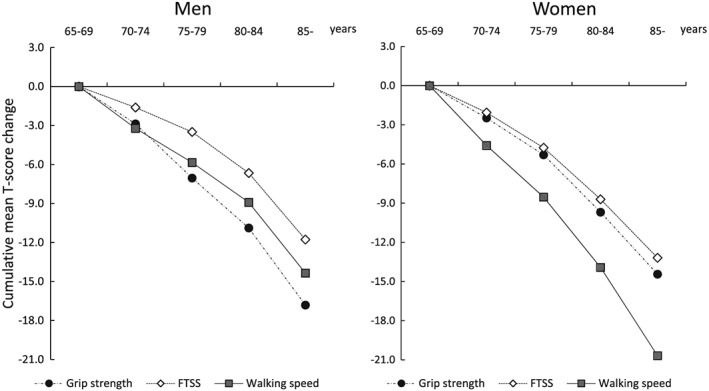
Cumulative mean T‐score changes in physical performance measurements. FTSS, five‐times‐sit‐to‐stand test.
Figure 4.
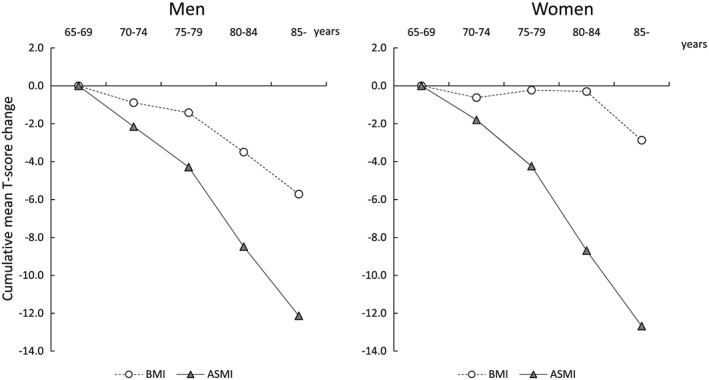
Cumulative mean T‐score changes in body composition index. BMI, body mass index; ASMI, appendicular skeletal muscle index.
The slope declines in age‐associated changes are described visually in Figure 3 for physical performance measures and in Figure 4 for body composition measures. For physical performance measures, the linear regression coefficients for assessing the slope declines in age‐associated changes were follows: β = −0.77, 95% CI = −0.82 to − 0.76 in men and β = −0.67, 95% CI = −0.72 to − 0.63 in women for grip strength; β = −0.50, 95% CI = −0.55 to − 0.45 in men and β = −0.63, 95% CI = −0.68 to − 0.59 in women for FTSS; β = −0.62, 95% CI = −0.66 to − 0.57 in men and β = −0.95, 95% CI = −0.99 to − 0.90 in women for walking speed. The slope declines in age‐associated changes were greater in grip strength for men and in walking speed for women. In addition, there were greater sex differences in the age‐associated changes in walking speed. The linear regression coefficients for body composition measures were follows: β = −0.24, 95% CI = −0.29 to − 0.20 in men and β = −0.06, 95% CI = −0.11 to − 0.01 in women for BMI; β = −0.56, 95% CI = −0.60 to − 0.51 in men and β = −0.60, 95% CI = −0.65 to − 0.56 in women for ASMI.
Discussion
The current study described age‐dependent changes in physical performance and body composition measures. The results showed that the age‐dependent changes differed among various parameters for Japanese older adults. The trends in age‐related declines of physical performance differed between the sexes; decreases in grip strength in men and walking speed in women were more prominent with advancing age. Furthermore, the age‐related changes were more prominent for ASMI than for BMI in both sexes. Although the reference group was the 65–69 year age group, the results of this study indicated that the age‐related slope patterns may be different among parameters.
In the current study, physical performance was measured by using grip strength, FTSS, and walking speed. The tests used in this study are reliable and valid clinical tools commonly used in assessing muscle strength and mobility in community‐dwelling older adults. Moreover, they require limited space and can be administered quickly.8, 31, 32 Although these clinical tests are very simple, parameters with poor performance predict adverse health in older adults and would have advantages over other common markers. For example, a worldwide cohort study found grip strength to be a better predictor of all‐cause mortality and cardiovascular mortality than blood pressure.33
The results of the current study indicate that trends toward age‐related declines in physical performance differ between men and women. In older men, declines in grip strength and walking speed seemed to be more striking after age 70 years. On the other hand, although each physical performance measure declined with advancing age, walking speed seemed to decrease more rapidly than did grip strength and FTSS in older women. Although there was a significant sex‐based difference in grip strength, this difference decreased significantly with advancing age in a previous cross‐sectional study.19 Because age‐related decrease in grip strength is more significant than decreases in FTSS and walking speed in older men, as shown by our current data, the performance gap in grip strength between men and women may decline with advancing age.
Walking speed is considered the most reliable physical performance measure for predicting the onset of disability in community‐dwelling older adults,34 especially for very old persons (e.g. aged 75 years and older).2 The population of older adults with limited ability to carry out routine daily activities seems to differ between the sexes, and older women constitute the majority of disabled older adults.35 In the current study, the results obtained for older women indicated that advancing age may have a stronger influence on walking speed than on grip strength and FTSS. There might be sex differences in walking speed, although its use as a risk assessment measure (e.g. for estimating survival) was confirmed in both sexes.7 Improvement or maintenance of mobility in older adults could potentially be a beneficial intervention for the prevention of future disability.
Confirming previously reported findings, the present study showed that both muscle mass and muscle strength declined considerably with advancing age in both men and women. Reduced skeletal muscle mass appears to increase physical disability,36 particularly mobility disability.37 On the other hand, an increase in fat mass may cause greater functional disability and lower physical performance in older adults.38 The current study demonstrates that differences between age‐related changes in BMI and ASMI, with a rapid decrease in ASMI but only a slight change in BMI, increased with advancing age in both sexes, and those differences were most notable in women. The differences in age‐related changes in body composition between men and women may affect the sex‐based differences in age‐related changes in physical performance.
This study has some limitations. In interpreting our results, we should have considered the details of BIA measurement, particularly the preparation of the participants and the timing of the measurements. We could not strictly control for factors that could affect the accuracy of the BIA measurement. Bioelectrical impedance analyser requires measurement under standardized conditions, including hydration status, recent food and beverage intake, skin temperature, and recent physical activity. To prepare participants for BIA assessment, avoiding alcoholic beverages for at least 8 h, fasting, and drinking no water for 4–6 h were recommended.39 Although the participants were required to fast and avoid vigorous exercise for at least 1 h before BIA assessment, the actual state of dehydration or water retention may be the main limitation of this study. Despite the exclusion of participants with chronic diseases and those using prescribed medications, as well as the predominance of participants reporting a relatively consistent lifestyle pattern during the previous year, the timing of measurement and food intake or exercise before BIA measurement must be controlled to minimize potential errors. In addition, prescribed medications, nutritional supplementation details, and medical diagnoses could be potentially associated with age‐associated changes in body components. These factors should be considered in further studies.
The present data describe specific age‐dependent changes in multidimensional physical performance measures and body composition parameters, and demonstrate differences among age groups and between sexes in Japanese older adults. As this study was a cross‐sectional analysis, conclusions could not be drawn concerning cause‐and‐effect relationships. Selection bias should be considered another limitation. Although this study included a very large sample, most participants seemed to have good function because they were able to independently participate in the assessments at the community center. This corresponds to approximately 30–40% of the target population. These limitations related to the participants might have influenced the results of the present study. In addition, analysis of socio‐demographic data (i.e. economic status) would be largely important in enabling the results to be extrapolated to other populations. Therefore, our results should be interpreted carefully. Further longitudinal studies are needed.
In conclusion, the patterns of age‐dependent declines in physical performance measures differed among parameters itself and between sexes. There is a possibility of a difference in age‐related slope patterns among parameters; decreases in grip strength in men and walking speed in women may be more prominent with advancing age. Furthermore, the decrease in muscle mass with aging is more striking than the decrease in whole body mass.
Conflict of interest
None declared.
Acknowledgements
We thank the Obu City Office and Midori Ward Office for helping in participant recruitment. The authors certify that they comply with the ethical guidelines for publishing in the Journal of Cachexia, Sarcopenia and Muscle: update 2015.40
This work received financial support through a Health Labor Sciences Research Grant (23‐001) from the Japanese Ministry of Health, Labor, and Welfare, and Research Funding for Longevity Sciences (22‐16 and 26‐33) from the National Center for Geriatrics and Gerontology (NCGG), Japan. Additional support was provided by a Grant‐in‐Aid for Scientific Research (B) to HS and a Grant‐in‐Aid for the Japan Society for the Promotion of Science Fellows from the Japan Society for the Promotion of Science to HM and TD.
Makizako, H. , Shimada, H. , Doi, T. , Tsutsumimoto, K. , Lee, S. , Lee, S. C. , Harada, K. , Hotta, R. , Nakakubo, S. , Bae, S. , Harada, K. , Yoshida, D. , Uemura, K. , Anan, Y. , Park, H. , and Suzuki, T. (2017) Age‐dependent changes in physical performance and body composition in community‐dwelling Japanese older adults. Journal of Cachexia, Sarcopenia and Muscle, 8: 607–614. doi: 10.1002/jcsm.12197.
References
- 1. Beaton K, McEvoy C, Grimmer K. Identifying indicators of early functional decline in community‐dwelling older people: a review. Geriatr Gerontol Int 2015;15:133–140. [DOI] [PubMed] [Google Scholar]
- 2. Shinkai S, Watanabe S, Kumagai S, Fujiwara Y, Amano H, Yoshida H, et al Walking speed as a good predictor for the onset of functional dependence in a Japanese rural community population. Age Ageing 2000;29:441–446. [DOI] [PubMed] [Google Scholar]
- 3. Donoghue OA, Savva GM, Cronin H, Kenny RA, Horgan NF. Using timed up and go and usual gait speed to predict incident disability in daily activities among community‐dwelling adults aged 65 and older. Arch Phys Med Rehabil 2014;95:1954–1961. [DOI] [PubMed] [Google Scholar]
- 4. Shimada H, Makizako H, Doi T, Tsutsumimoto K, Suzuki T. Incidence of disability in frail older persons with or without slow walking speed. J Am Med Dir Assoc 2015;16:690–696. [DOI] [PubMed] [Google Scholar]
- 5. Cesari M, Kritchevsky SB, Newman AB, Simonsick EM, Harris TB, Penninx BW, et al for the Health ABC Study. Added value of physical performance measures in predicting adverse health‐related events: results from the Health, Aging and Body Composition Study. J Am Geriatr Soc 2009;57:251–259. [DOI] [PMC free article] [PubMed] [Google Scholar]
- 6. De Buyser SL, Petrovic M, Taes YE, Toye KR, Kaufman JM, Goemaere S. Physical function measurements predict mortality in ambulatory older men. Eur J Clin Invest 2013;43:379–386. [DOI] [PubMed] [Google Scholar]
- 7. Studenski S, Perera S, Patel K, Rosano C, Faulkner K, Inzitari M, et al Gait speed and survival in older adults. JAMA 2011;305:50–58. [DOI] [PMC free article] [PubMed] [Google Scholar]
- 8. Rantanen T, Volpato S, Ferrucci L, Heikkinen E, Fried LP, Guralnik JM. Handgrip strength and cause‐specific and total mortality in older disabled women: exploring the mechanism. J Am Geriatr Soc 2003;51:636–641. [DOI] [PubMed] [Google Scholar]
- 9. Goodpaster BH, Park SW, Harris TB, Kritchevsky SB, Nevitt M, Schwartz AV, et al The loss of skeletal muscle strength, mass, and quality in older adults: the health, aging and body composition study. J Gerontol A Biol Sci Med Sci 2006;61:1059–1064. [DOI] [PubMed] [Google Scholar]
- 10. Newman AB, Haggerty CL, Goodpaster B, Harris T, Kritchevsky S, Nevitt M, et al Health Aging and Body Composition Research Group. Strength and muscle quality in a well‐functioning cohort of older adults: the Health, Aging and Body Composition Study. J Am Geriatr Soc 2003;51:323–330. [DOI] [PubMed] [Google Scholar]
- 11. Auyeung TW, Lee SW, Leung J, Kwok T, Woo J. Age‐associated decline of muscle mass, grip strength and gait speed: a 4‐year longitudinal study of 3018 community‐dwelling older Chinese. Geriatr Gerontol Int 2014;14:76–84. [DOI] [PubMed] [Google Scholar]
- 12. Janssen I, Heymsfield SB, Ross R. Low relative skeletal muscle mass (sarcopenia) in older persons is associated with functional impairment and physical disability. J Am Geriatr Soc 2002;50:889–896. [DOI] [PubMed] [Google Scholar]
- 13. Landi F, Liperoti R, Russo A, Giovannini S, Tosato M, Capoluongo E, et al Sarcopenia as a risk factor for falls in elderly individuals: results from the ilSIRENTE study. Clin Nutr 2012;31:652–658. [DOI] [PubMed] [Google Scholar]
- 14. Fielding RA, Vellas B, Evans WJ, Bhasin S, Morley JE, Newman AB, et al Sarcopenia: an undiagnosed condition in older adults. Current consensus definition: prevalence, etiology, and consequences. International working group on sarcopenia. J Am Med Dir Assoc 2011;12:249–256. [DOI] [PMC free article] [PubMed] [Google Scholar]
- 15. Cruz‐Jentoft AJ, Baeyens JP, Bauer JM, Boirie Y, Cederholm T, Landi F, et al European Working Group on Sarcopenia in Older People. Sarcopenia: European consensus on definition and diagnosis: report of the European Working Group on Sarcopenia in Older People. Age Ageing 2010;39:412–423. [DOI] [PMC free article] [PubMed] [Google Scholar]
- 16. Chen LK, Liu LK, Woo J, Assantachai P, Auyeung TW, Bahyah KS, et al Sarcopenia in Asia: consensus report of the Asian Working Group for Sarcopenia. J Am Med Dir Assoc 2014;15:95–101. [DOI] [PubMed] [Google Scholar]
- 17. Frontera WR, Hughes VA, Lutz KJ, Evans WJ. A cross‐sectional study of muscle strength and mass in 45‐ to 78‐yr‐old men and women. J Appl Physiol (1985) 1991;71:644–650. [DOI] [PubMed] [Google Scholar]
- 18. Lauretani F, Russo CR, Bandinelli S, Bartali B, Cavazzini C, De Iorio A, et al Age‐associated changes in skeletal muscles and their effect on mobility: an operational diagnosis of sarcopenia. J Appl Physiol 2003;95:1851–1860. [DOI] [PubMed] [Google Scholar]
- 19. Seino S, Shinkai S, Fujiwara Y, Obuchi S, Yoshida H, Hirano H, et al Reference values and age and sex differences in physical performance measures for community‐dwelling older Japanese: a pooled analysis of six cohort studies. PLoS One 2014;9:e99487. [DOI] [PMC free article] [PubMed] [Google Scholar]
- 20. Yamada M, Moriguch Y, Mitani T, Aoyama T, Arai H. Age‐dependent changes in skeletal muscle mass and visceral fat area in Japanese adults from 40 to 79 years‐of‐age. Geriatr Gerontol Int 2014;14:8–14. [DOI] [PubMed] [Google Scholar]
- 21. Seino S, Shinkai S, Iijima K, Obuchi S, Fujiwara Y, Yoshida H, et al Reference values and age differences in body composition of community‐dwelling older Japanese men and women: a pooled analysis of four cohort studies. PLoS One 2015;10:e0131975. [DOI] [PMC free article] [PubMed] [Google Scholar]
- 22. Jiang Y, Zhang Y, Jin M, Gu Z, Pei Y, Meng P. Aged‐related changes in body composition and association between body composition with bone mass density by body mass index in Chinese Han men over 50‐year‐old. PLoS One 2015;10:e0130400. [DOI] [PMC free article] [PubMed] [Google Scholar]
- 23. Shimada H, Tsutsumimoto K, Lee S, Doi T, Makizako H, Lee S, et al Driving continuity in cognitively impaired older drivers. Geriatr Gerontol Int 2016;16:508–514. [DOI] [PubMed] [Google Scholar]
- 24. Shimada H, Makizako H, Lee S, Doi T, Lee S, Tsutsumimoto K, et al Impact of cognitive frailty on daily activities in older persons. J Nutr Health Aging 2016;20:729–735. [DOI] [PubMed] [Google Scholar]
- 25. Folstein MF, Folstein SE, McHugh PR. “Mini‐mental state”: a practical method for grading the cognitive state of patients for the clinician. J Psychiatr Res 1975;12:189–198. [DOI] [PubMed] [Google Scholar]
- 26. Whitney SL, Wrisley DM, Marchetti GF, Gee MA, Redfern MS, Furman JM. Clinical measurement of sit‐to‐stand performance in people with balance disorders: validity of data for the Five‐Times‐Sit‐to‐Stand Test. Phys Ther 2005;85:1034–1045. [PubMed] [Google Scholar]
- 27. Makizako H, Shimada H, Doi T, Tsutsumimoto K, Suzuki T. Impact of physical frailty on disability in community‐dwelling older adults: a prospective cohort study. BMJ Open 2015;5:e008462 [DOI] [PMC free article] [PubMed] [Google Scholar]
- 28. Yoshida D, Suzuki T, Shimada H, Park H, Makizako H, Doi T, et al Using two different algorithms to determine the prevalence of sarcopenia. Geriatr Gerontol Int 2014;14:46–51. [DOI] [PubMed] [Google Scholar]
- 29. Baumgartner RN, Koehler KM, Gallagher D, Romero L, Heymsfield SB, Ross RR, et al Epidemiology of sarcopenia among the elderly in New Mexico. Am J Epidemiol 1998;147:755–763. [DOI] [PubMed] [Google Scholar]
- 30. Cohen J. Set correlation and contingency tables. Appl Psychol Measur 1988;12:425–434. [Google Scholar]
- 31. Buatois S, Perret‐Guillaume C, Gueguen R, Miget P, Vancon G, Perrin P, et al A simple clinical scale to stratify risk of recurrent falls in community‐dwelling adults aged 65 years and older. Phys Ther 2010;90:550–560. [DOI] [PubMed] [Google Scholar]
- 32. Studenski S, Perera S, Wallace D, Chandler JM, Duncan PW, Rooney E, et al Physical performance measures in the clinical setting. J Am Geriatr Soc 2003;51:314–322. [DOI] [PubMed] [Google Scholar]
- 33. Leong DP, Teo KK, Rangarajan S, Lopez‐Jaramillo P, Avezum A Jr, Orlandini A, et al Prospective Urban Rural Epidemiology (PURE) Study Investigators. Prognostic value of grip strength: findings from the Prospective Urban Rural Epidemiology (PURE) study. Lancet 2015;386:266–273. [DOI] [PubMed] [Google Scholar]
- 34. Perera S, Patel KV, Rosano C, Rubin SM, Satterfield S, Harris T, et al Gait speed predicts incident disability: a pooled analysis. J Gerontol A Biol Sci Med Sci 2016;71:63–71. [DOI] [PMC free article] [PubMed] [Google Scholar]
- 35. Guralnik JM, Simonsick EM. Physical disability in older Americans. J Gerontol 1993;48:3–10. [DOI] [PubMed] [Google Scholar]
- 36. Janssen I, Baumgartner RN, Ross R, Rosenberg IH, Roubenoff R. Skeletal muscle cutpoints associated with elevated physical disability risk in older men and women. Am J Epidemiol 2004;159:413–421. [DOI] [PubMed] [Google Scholar]
- 37. Reid KF, Naumova EN, Carabello RJ, Phillips EM, Fielding RA. Lower extremity muscle mass predicts functional performance in mobility‐limited elders. J Nutr Health Aging 2008;12:493–498. [DOI] [PMC free article] [PubMed] [Google Scholar]
- 38. Shin H, Panton LB, Dutton GR, Ilich JZ. Relationship of physical performance with body composition and bone mineral density in individuals over 60 years of age: a systematic review. J Aging Res 2011;2011:191896. [DOI] [PMC free article] [PubMed] [Google Scholar]
- 39. Mialich MS, Sicchieri JMF, Junior AAJ. Analysis of body composition: a critical review of the use of bioelectrical impedance analysis. Int J Clin Nutr 2014;2:1–10. [Google Scholar]
- 40. von Haehling S, Morley JE, Coats AJS, Anker SD. Ethical guidelines for publishing in the Journal of Cachexia, Sarcopenia and Muscle: update 2015. J Cachexia Sarcopenia Muscle 2015;6: 315–316. [DOI] [PMC free article] [PubMed] [Google Scholar]