

Abstract
Background
There is a close association between frailty and cognitive impairment. However, the underlying contribution of sarcopenia to the development of cognitive impairment is unclear. We investigated the possible association between muscle mass decline and cognitive impairment in a cross‐sectional study of 1518 subjects aged 55 years or above. We also evaluated arterial stiffness and white matter hyperintensities (WMHs) as possible underlying mechanisms for this association.
Methods
Two sarcopenic indices were measured: thigh muscle cross‐sectional area (CSA; calculated by computed tomography) and skeletal muscle mass (bioelectric impedance). Muscle mass decline was defined as either the bottom 10% or 20% of participants for each sex. Cognitive function was assessed using the Touch Panel‐type Dementia Assessment Scale, and brachial–ankle pulse wave velocity was measured as an index of arterial stiffness.
Results
Both sarcopenic indices were modestly but significantly associated with brachial–ankle pulse wave velocity in male and female subjects. The presence of WMHs was significantly associated with low thigh muscle CSA in men and with low skeletal muscle mass in women. The Touch Panel‐type Dementia Assessment Scale score was modestly but significantly and positively associated with thigh muscle CSA in men and skeletal muscle mass in women. Muscle mass decline in the bottom 10% of participants on both sarcopenic indices was significantly and independently related to cognitive impairment in women.
Conclusions
Lower sarcopenic indices are significantly related to lower cognitive scores. Arterial stiffness and WMHs could account, at least in part, for this association.
Keywords: Frailty, Sarcopenia, White matter hyperintensity, Cognitive impairment
Introduction
Cognitive function in elderly people is highly related to physical function.1 Recently, several studies have reported an association between lower gait speed and cognitive decline in mild cognitive impairment,2 as well as dementia.3, 4 Verghese et al.5 proposed motoric cognitive risk syndrome, characterized by a slow gait speed and cognitive complaints, as a newly described pre‐dementia syndrome.
Frailty is a condition that is characterized by progression of physiological decline in elderly people and is prodromal for dependence, institutionalization, and even death.1 Slow gait speed and lower hand grip strength are among the five measures of frailty that were proposed by Fried et al.6 and are also criteria for the diagnosis of sarcopenia.7 Sarcopenia is an age‐related decline in muscle mass and strength and a major component of frailty.
We and others have shown that sarcopenia is associated with increased arterial stiffness.8, 9 Several studies, including meta‐analyses, have reported close associations between arterial stiffness and cognitive impairment.10, 11, 12, 13 Although the precise mechanisms have not been determined, arterial stiffness has been associated with brain white matter hyperintensities (WMHs),11 a well‐demonstrated risk factor for cognitive decline.14 These findings suggest that the effect of sarcopenia on cognitive impairment may be mediated by arterial stiffness and WMHs. However, results from studies that have evaluated the association between sarcopenia and cognitive impairment in a general population are inconclusive.15, 16, 17, 18, 19 Furthermore, no studies have evaluated the underling mechanisms linking sarcopenia and cognitive impairment.
We performed a cross‐sectional study looking for possible associations between two sarcopenic indices and cognitive impairment, taking into account arterial stiffness and WMHs as possible pathological mechanisms in participants of the Japan Shimanami Health Promoting Program study.
Methods
Study subjects
The study subjects were 1518 apparently healthy individuals aged 55 years or above who were consecutive participants in the medical checkup programme at Ehime University Hospital Anti‐aging Center from February 2006 to December 2015. This medical check‐up is provided to general residents of Ehime Prefecture, Japan, and is specifically designed to evaluate ageing‐related disorders, including atherosclerosis, cardiovascular disease, physical function, and mild cognitive impairment.9, 20, 21, 22 Of the 1691 consecutive patients who were initially approached, 1518 (mean age, 67.9 ± 6.8 years) gave written consent for all procedures and had no history of symptomatic cardiovascular events, including peripheral arterial disease, stroke, coronary heart disease, and congestive heart failure. The present study was part of a series of the Japan Shimanami Health Promoting Program study, which was approved by the Ethics Committee of Ehime University Graduate School of Medicine.9, 20, 21, 22
Measurement of sarcopenia‐related indices
Thigh muscle cross‐sectional area
Thigh muscle cross‐sectional area (CSA) was measured using computed tomography (CT) (LightSpeed VCT; GE Healthcare, Tokyo, Japan). Images were created at the mid‐thigh, defined as the mid‐point between the inguinal crease and the proximal pole of the patella.9, 21 Muscle CSA (cm2) was computed using an attenuation range of 0–100 Hounsfield units, and this excluded intramuscular fat.
Bioelectric impedance analysis
The total skeletal muscle ratio was evaluated by the bioelectrical impedance method using a commercially available body composition analyser (body scan HBF‐701; Omron Healthcare Co. Ltd., Kyoto, Japan). The manufacturer's built‐in, preprogrammed algorithms were used to calculate the percentage of skeletal muscle. Skeletal muscle mass (in kg) was calculated as ‘body weight (kg) * skeletal muscle percentage’.20, 21
Participants scoring in the bottom 20 and 10% on each sarcopenic index were defined as having muscle mass decline, stratified separately by sex.
Measurement of visceral fat area
Visceral fat area was measured using CT at the level of the umbilicus, with attenuation in the range of 150–50 Hounsfield units. Images were obtained with a minimal slice width of 5 mm and were analysed using OsiriX software (OsiriX Foundation, Geneva, Switzerland).20, 21 Thigh muscle CSA and visceral fat area measurements were only available for 1505 subjects (603 men and 902 women).
Magnetic resonance imaging and assessment of white matter hyperintensities
The presence of WMHs, including periventricular hyperintensity (PVH), and deep subcortical white matter hyperintensity (DSWMH), was evaluated by brain magnetic resonance imaging (MRI) with a 3‐tesla scanner (Signa Excite 3.0T; GE Healthcare, Milwaukee, WI). Details of brain MRI have been described elsewhere.22 Hyperintensities depicted on T2‐weighted FLAIR images in contact with the ventricular wall and located in the subcortical region were defined as PVH and DSWMH, respectively. PVH was further classified into five grades in accordance with Japanese guidelines as follows23: grade 0, absent or only a ‘rim’; grade 1, limited lesion‐like ‘caps’; grade 2, irregular ‘halo’; grade 3, irregular margins and extension into the deep white matter; and grade 4, extension into the deep white matter and subcortical portion. DSWMH was also classified into five grades as follows23: grade 0, absent; grade 1, ≤3 mm small foci and regular margins; grade 2, ≥3 mm large foci; grade 3, diffusely confluent; and grade 4, extensive changes in the white matter. The presence of WMHs was defined as PVH grade ≥ 2 and/or DSWMH grade ≥ 3. Images were analysed by two neurologists without clinical information on the subjects. Images were analysed using OsiriX software (http://www. osirix‐viewer.com).
Assessment of cognitive function
Cognitive impairment was assessed using the Touch Panel‐type Dementia Assessment Scale (TDAS), which was specifically designed to rate cognitive dysfunction quickly and without the need for a special rater.22 This test battery consists of the following four tasks, which were performed in a fixed order: a three‐word memory test for assessing immediate memory, a temporal orientation test, a three‐dimensional visual–spatial perception test, and a delayed recall test to assess short‐term memory.24 The TDAS provides for a maximum score of 15 points, and a score of 12 or less was suggested as indicative of cognitive impairment in a previous study.24 Details of this rating system have been described elsewhere.24
Pulse wave velocity
Pulse wave velocity (PWV) was measured using a volume‐plethysmograph (PWV/ankle brachial index; Omron Healthcare Co. Ltd., Kyoto, Japan). A detailed explanation of this device, as well as the validity and reproducibility of its measurements, has been provided elsewhere.25 Brachial‐to‐ankle PWV (baPWV) was calculated from the time interval between the wave fronts of the brachial and ankle waveforms (ΔTba) and the path length from the brachium to the ankle. The path length from the suprasternal notch to the brachium (Lb) or ankle (La) was obtained using the following formulae: Lb = 0.2195 × height + 2.0734; La = 0.8129 × height + 12.328. The baPWV was then obtained using the following equation: (La − Lb)/ΔTba. The intra‐measurement reproducibility of baPWV in our laboratory was 2.1 ± 1.8%, and between measurements, the reproducibility was 2.2 ± 1.5%.
Evaluation of risk factors
Lifestyle, medical history, and prescribed drugs were evaluated by questionnaire. Anthropometric measurements were performed by a trained nurse. Venous blood was collected in the morning after ≥11 h fasting for measurement of serum lipid and plasma glucose concentrations. Blood pressure was measured with oscillometric device (HEM‐9000AI; Omron Healthcare Co., Ltd) in a sitting position after at least 5 min of rest.
Statistical analysis
Because men and women have important physiological differences, all statistical analyses were performed separately for each sex. Differences in numeric variables were assessed with an analysis of variance, with Tukey's correction for multiple comparisons applied. Frequency differences were assessed by the χ2 test and logistic regression analyses. Covariate adjusted analysis was performed by multiple linear regression analyses and logistic regression analyses with possible independent parameters including age, body mass index, systolic blood pressure, total cholesterol, high‐density lipoprotein cholesterol, triglyceride, fasting blood glucose, immune‐reactive insulin, current smoking, alcohol consumption, physical activity, use of antihypertensive drugs, anti‐dyslipidemic drugs, anti‐diabetic medication, baPWV, and the presence of WMHs. Statistical analyses were conducted using commercially available statistical software (JMP version 10.0.2; SAS Institute Inc., Cary, NC), with P < 0.05 considered statistically significant.
Results
Clinical characteristics of the study population divided by the TDAS score are shown in Table 1 and Table S1. Thigh muscle CSA was significantly lower in men with lower TDAS scores, and skeletal muscle mass was significantly and positively associated with TDAS score in both men and women. Brachial‐ankle PWV was significantly associated with TDAS score in both men and women.
Table 1.
Clinical characteristics of study participants split by TDAS score in men and women
| Men | Women | P * | |||||||
|---|---|---|---|---|---|---|---|---|---|
| TDAS score | 15 | 14 | 13 or less | P | 15 | 14 | 13 or less | P | |
| n | 309 | 193 | 107 | 393 | 368 | 148 | 0.002 | ||
| Age, years | 67.2 ± 6.9 | 70.0 ± 6.9** | 70.6 ± 7.0** | <0.0001 | 65.5 ± 6.3 | 68.6 ± 6.4** | 69.6 ± 6.4** | <0.0001 | 0.0002 |
| Body height, cm | 165.6 ± 5.4 | 164.2 ± 5.6* | 163.4 ± 5.3** | 0.0003 | 152.9 ± 5.3 | 151.4 ± 5.5** | 150.6 ± 4.9** | <0.0001 | <0.0001 |
| Body weight, kg | 65.3 ± 8.8 | 64.8 ± 8.5 | 63.5 ± 9.2 | 0.19 | 53.1 ± 8.0 | 52.1 ± 7.25 | 52.4 ± 8.36 | 0.22 | <0.0001 |
| BMI, kg/m2 | 23.8 ± 2.9 | 24.0 ± 2.8 | 23.8 ± 3.1 | 0.70 | 22.7 ± 3.3 | 22.7 ± 2.9 | 23.1 ± 3.3 | 0.40 | <0.0001 |
| Visceral fat areaa, cm2 | 127.4 ± 6.6 | 135.3 ± 6.5 | 131.5 ± 7.1 | 0.43 | 87.9 ± 4.9 | 87.1 ± 4.8 | 94.1 ± 5.2 | 0.31 | <0.0001 |
| Thigh muscle CSAa ,cm2 | 134.7 ± 18.1 | 130.6 ± 18.4* | 127.2 ± 16.7** | 0.0005 | 95.5 ± 13.3 | 93.3 ± 12.0 | 93.9 ± 13.8 | 0.065 | <0.0001 |
| Skeletal muscle mass, kg | 18.7 ± 2.8 | 18.1 ± 2.7* | 17.7 ± 2.7** | 0.001 | 12.3 ± 1.9 | 11.9 ± 1.9** | 11.7 ± 2.0** | 0.0005 | <0.0001 |
| Systolic BP, mmHg | 135.8 ± 18.2 | 140.5 ± 18.9* | 142.3 ± 20.3** | 0.002 | 132.3 ± 18.7 | 135.4 ± 19.5 | 134.3 ± 19.9 | 0.077 | <0.0001 |
| Diastolic BP, mmHg | 77.8 ± 11.2 | 78.9 ± 11.6 | 78.9 ± 12.2 | 0.52 | 75.5 ± 10.6 | 74.3 ± 10.9 | 75.6 ± 10.8 | 0.25 | <0.0001 |
| Heart rate, beats/min | 63.9 ± 10.7 | 64.7 ± 10.8 | 66.3 ± 9.1 | 0.11 | 66.7 ± 9.2 | 67.8 ± 10.0 | 69.3 ± 10.6 | 0.02 | <0.0001 |
| baPWV, cm/s | 1616 ± 300 | 1724 ± 358** | 1795 ± 346** | <0.0001 | 1546 ± 301 | 1600 ± 332* | 1667 ± 331** | 0.0001 | <0.0001 |
| Triglyceride, mg/dL | 111.4 ± 57.7 | 113.9 ± 66.5 | 119.7 ± 63.4 | 0.49 | 102.1 ± 56.9 | 102.9 ± 53.2 | 109.8 ± 67.3 | 0.36 | 0.001 |
| Total cholesterol, mg/dL | 206.4 ± 31.9 | 202.8 ± 32.7 | 195.9 ± 32.5* | 0.015 | 225.2 ± 35.9 | 223.8 ± 37.3 | 223.8 ± 30.3 | 0.84 | <0.0001 |
| HDL cholesterol, mg/dL | 59.5 ± 15.7 | 60.8 ± 17.0 | 57.4 ± 15.9 | 0.21 | 70.8 ± 17.4 | 69.9 ± 16.6 | 68.1 ± 18.3 | 0.26 | <0.0001 |
| Fasting glucose, mg/dL | 106.9 ± 17.0 | 109.4 ± 21.0 | 112.2 ± 29.7 | 0.06 | 99.8 ± 15.1 | 101.3 ± 16.0 | 102.9 ± 19.1 | 0.12 | <0.0001 |
| IRI μU/mL | 6.3 ± 5.6 | 6.4 ± 3.9 | 6.5 ± 5.8 | 0.95 | 5.6 ± 3.7 | 5.6 ± 3.7 | 6.2 ± 4.3 | 0.15 | 0.003 |
| Antihypertensive drugs, n (%) | 111 ((36)) | 76 (39) | 45 (42) | 0.48 | 98 (25) | 117 (32) | 42 (38) | 0.11 | <0.0001 |
| Antidyslipidemia drugs, n (%) | 53 (17) | 41 (21) | 33 (31)** | 0.01 | 111 (28) | 113 (31) | 42 (28) | 0.73 | 0.0002 |
| Antidiabetic drugs, n (%) | 22 (7) | 19 (10) | 12 (11) | 0.35 | 19 (5) | 14 (4) | 10 (7) | 0.38 | 0.002 |
| Current/past/never smoker | 48/172/89 | 18/128/47* | 7/67/33* | 0.026 | 5/24/364 | 4/16/348 | 4/9/135 | 0.53 | <0.0001 |
| Alcohol consumption, cups/week | 6.2 ± 9.0 | 5.3 ± 7.0 | 5.6 ± 8.4 | 0.47 | 0.7 ± 2.9 | 0.5 ± 2.4 | 0.5 ± 2.2 | 0.56 | <0.0001 |
| Physical activity | 69/165/65/10 | 43/111/33/6 | 35/42/26/4 | 0.11 | 65/235/84/9 | 84/201/66/17 | 31/84/27/6 | 0.16 | 0.17 |
Values are mean ± SD or number of participants. baPWV, brachial–ankle pulse wave velocity; BP, blood pressure; BMI, body mass index; CSA, cross‐sectional area; DSWMH, deep subcortical white matter hyperintensity; HDL, high‐density lipoprotein; IRI, immunoreactive insulin; PVH, periventricular hyperintensity; TDAS, Touch Panel‐type Dementia Assessment Scale. Physical activity: every day/sometimes/not often/never.
a: n = 1505.
P; men vs. women.
P < 0.05,
P < 0.01 vs. TDAS 15.
Sarcopenic indices and pulse wave velocity
In both men and women, baPWV was modestly but significantly and negatively associated with thigh muscle CSA (men: r = −0.24, P < 0.0001; women: r = −0.12, P = 0.0001) and with skeletal muscle mass (men: r = −0.24, P < 0.0001; women: r = −0.23, P < 0.0001). Furthermore, as shown in Figure 1, the relationships between sarcopenic indices and baPWV were not linear. The reduction in scores on sarcopenic indices associated with increases in baPWV reached a plateau at the second tertile in both men and women.
Figure 1.
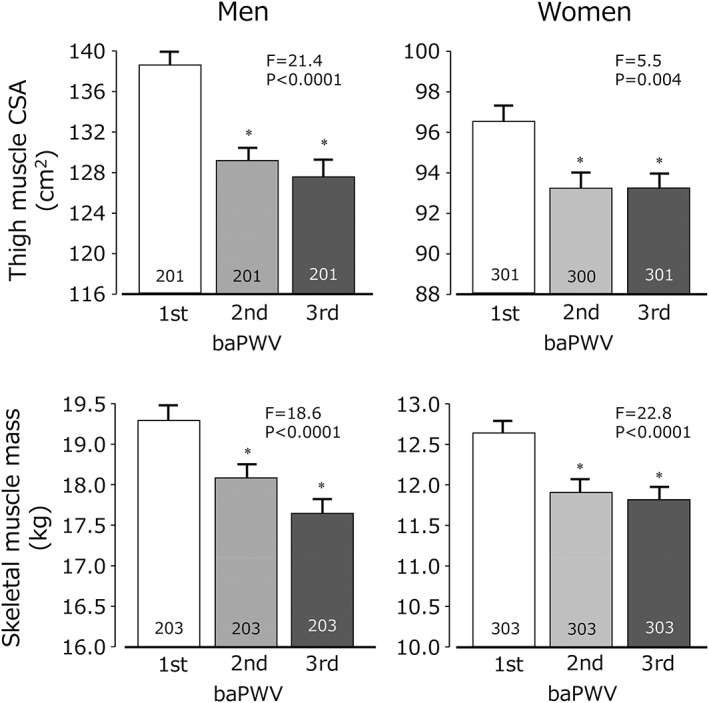
Tertiles of brachial‐ankle pulse wave velocity (baWV) and thigh muscle cross sectional area (upper) and skeletal muscle mass [bottom]. For men and women, the lowest tertile of baPWV scores had the highest thigh muscle cross‐sectional area (CSA) and skeletal muscle mass. Values are mean ± SEM. *P < 0.05 vs. first tertile.
Sarcopenic indices and white matter hyperintensities
Figure 2 shows thigh muscle CSA and skeletal muscle mass in the three groups split into PVH and DSWMH grades. In both men and women, both sarcopenia indices were significantly and negatively associated with WMH grades, except for thigh muscle CSA and DSWMH grade in women.
Figure 2.
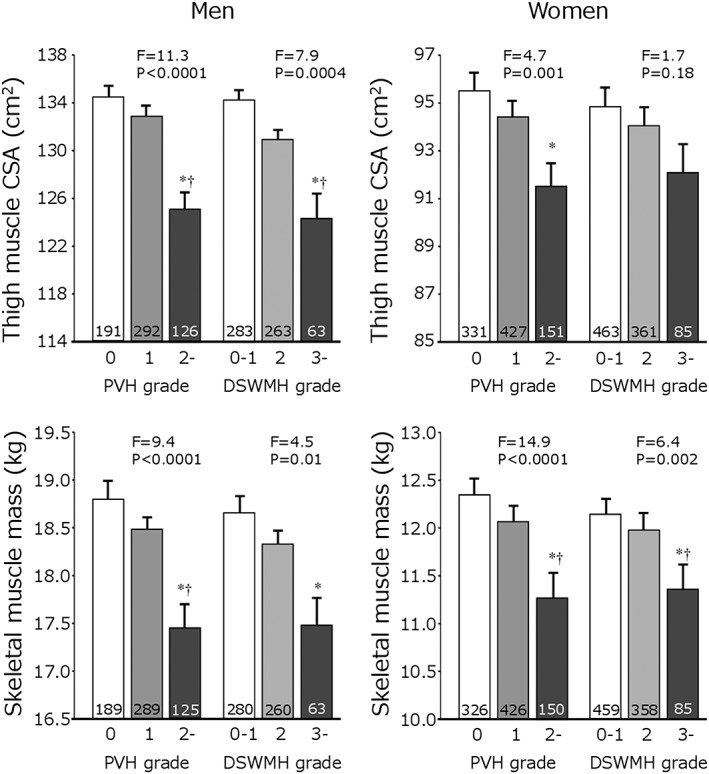
White matter hyperintensity and sarcopenic indices. Two indices for sarcopenia are shown, split by periventricular hyperintensity (PVH) and deep subcortical white matter hyperintensity (DSWMH). The numbers in the columns indicate the number of subjects. Values are mean ± SEM. *P < 0.05 vs. first tertile. †P < 0.05 vs. second tertile.
Odds ratios of sarcopenic indices for the presence of WMHs are shown in Table 2. Even after adjustment for possible confounding parameters (adjustment 1), low thigh muscle CSA was significantly associated with WMHs in men, while low skeletal muscle mass was significantly related to WMHs in women. Further adjustment for baPWV (adjustment 2) eliminated the significant association in men but not in women.
Table 2.
Odds ratios for the presence of white matter hyperintensities
| Parameters for sarcopenia | Men | Women | |||||
|---|---|---|---|---|---|---|---|
| Odds ratio | 95% CI | P | Odds ratio | 95% CI | P | ||
| Thigh muscle CSA/1 SD | n | 603 | 902 | ||||
| No adjustment | 0.63 | 0.52–0.77 | <.0001 | 0.81 | 0.69–0.96 | .015 | |
| Adjustment 1 | 0.74 | 0.54–099 | .046 | 0.88 | 0.70–1.11 | .29 | |
| Adjustment 2 | 0.75 | 0.55–1.01 | .059 | 0.89 | 0.70–1.14 | .30 | |
| Skeletal muscle mass/1 SD | n | 609 | 909 | ||||
| No adjustment | 0.65 | 0.53–0.79 | <.0001 | 0.67 | 0.56–0.80 | <.0001 | |
| Adjustment 1 | 0.80 | 0.60–1.08 | .15 | 0.73 | 0.57–0.93 | .01 | |
| Adjustment 2 | 0.82 | 0.60–1.11 | .20 | 0.73 | 0.57–0.94 | .01 | |
CI, confidence interval.
Odds ratios for the presence of white mater hyperintensities, stratified by increase in sarcopenic indices (by 1 SD).
Adjustment 1: adjusted for age, body mass index, systolic blood pressure, triglyceride levels, total cholesterol levels, high‐density lipoprotein cholesterol levels, glucose levels, immunoreactive insulin levels, use of antihypertensive drugs, antidyslipidemic drugs, antidiabetic drugs, current smoking, alcohol intake, physical activity (1 + 2 + 3 + 4).
Adjustment 2: Further adjustment for brachial–ankle pulse wave velocity.
White matter hyperintensity was defined as periventricular hyperintensity grade ≥ 2 and/or deep subcortical white matter hyperintensity grade ≥ 3. One SD of thigh muscle CSA was 18.92 cm2 for men and 13.49 cm2 for women, and that of skeletal muscle mass was 3.14 kg for men and 2.02 kg for women.
Sarcopenic indices and cognitive scores
Touch Panel‐type Dementia Assessment Scale scores (a continuous variable) showed a modest but significant positive association with thigh muscle CSA (men: r = 0.16, P < 0.0001; women: r = 0.08, P = 0.016), and skeletal muscle mass (men: r = 0.15, P = 0.0002; women: r = 0.14, P < 0.0001) (Figure 3).
Figure 3.
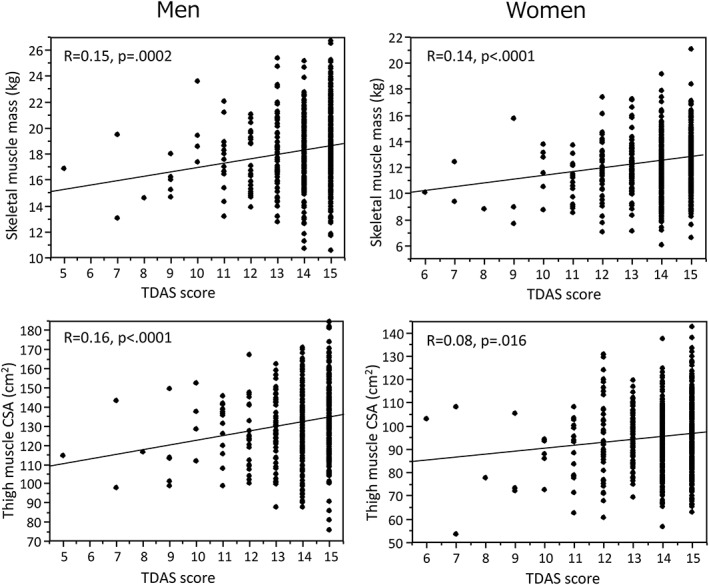
Scatter plots showing relationship between touch panel‐type dementia assessment scale (TDAS) score and thigh muscle cross‐sectional area (CSA) (top) and skeletal muscle mass (bottom) in men and women.
Multiple regression analyses showed that thigh muscle CSA was significantly positively related to TDAS score in men independently of other possible confounding parameters (S2), while in women, skeletal muscle mass was significantly and independently associated with TDAS score (S3). Further adjustment with baPWV and WMHs eliminated the association between thigh muscle CSA and TDAS score in men, but not the association between skeletal muscle mass and TDAS score in women.
Muscle mass decline and cognitive impairment
Odds ratios of muscle mass decline for the presence of cognitive impairment are shown in Table 3. Muscle mass decline (defined as the bottom 10% of the studied population) was significantly associated with cognitive impairment in women, even after adjustment for confounding parameters including baPWV and WMHs. However, muscle mass decline in men was not associated with cognitive impairment.
Table 3.
Odds ratios of sarcopenia for the presence of cognitive impairment
| Men | Women | |||||||
|---|---|---|---|---|---|---|---|---|
| Sarcopenia definition | Model | Odds ratio | 95% CI | P | Odds ratio | 95% CI | P | |
| Thigh muscle CSA | n | 603 | 902 | |||||
| Bottom 20% | No adjustment | 2.57 | 1.36–4.74 | 0.004 | 1.56 | 0.89–2.65 | 0.12 | |
| Adjustment 1 | 1.75 | 0.75–4.03 | 0.19 | 1.19 | 0.61–2.24 | 0.61 | ||
| Adjustment 2 | 1.69 | 0.72–3.91 | 0.23 | 1.13 | 0.57–2.15 | 0.72 | ||
| *Bottom 10% | No adjustment | 1.84 | 0.77–3.95 | 0.16 | 2.92 | 1.55–5.24 | 0.001 | |
| Adjustment 1 | 0.87 | 0.30–2.32 | 0.79 | 2.58 | 1.21–5.33 | 0.015 | ||
| Adjustment 2 | 0.81 | 0.28–2.18 | 0.69 | 2.58 | 1.18–5.43 | 0.02 | ||
| Skeletal muscle mass | n | 609 | 909 | |||||
| Bottom 20% | No adjustment | 2.05 | 1.07–3.81 | 0.03 | 2.12 | 1.24–3.52 | 0.007 | |
| Adjustment 1 | 1.48 | 0.67–3.23 | 0.33 | 1.65 | 0.87–3.07 | 0.13 | ||
| Adjustment 2 | 1.55 | 0.81–2.90 | 0.18 | 1.54 | 0.81–2.90 | 0.18 | ||
| *Bottom 10% | No adjustment | 2.20 | 0.96–4.60 | 0.06 | 2.95 | 1.57–5.29 | 0.001 | |
| Adjustment 1 | 1.43 | 0.53–3.58 | 0.47 | 2.50 | 1.16–5.23 | 0.02 | ||
| Adjustment 2 | 1.46 | 0.54–3.69 | 0.44 | 2.38 | 1.09–5.04 | 0.03 | ||
CI, confidence interval.
Subjects with a muscle mass in the top 80% were used as controls.
Adjustment 1: adjusted for age, body mass index, systolic blood pressure, triglyceride levels, total cholesterol levels, high‐density lipoprotein cholesterol levels, glucose levels, immunoreactive insulin levels, use of antihypertensive drugs, antidyslipidemic drugs, antidiabetic drugs, current smoking, alcohol intake, and physical activity.
Adjustment 2: further adjusted for brachial–ankle pulse wave velocity and the presence of white matter hyperintensity. White matter hyperintensity was defined as periventricular hyperintensity grade ≥2 and/or deep subcortical white matter hyperintensity grade ≥3.
Discussion
The present study showed that sarcopenic indices were significantly associated with arterial stiffness, brain WMHs, and cognitive test scores. We also observed that subjects with muscle mass decline, defined as the bottom 10% of the studied population, had cognitive impairment in the middle‐aged to elderly female population. These findings indicate that sarcopenia, a component of frailty, plays an important role in cognitive decline in the general population.
Several cross‐sectional and longitudinal studies have demonstrated a close association between frailty and cognitive impairment.1 Other possible frailty‐related symptoms, such as orthostatic hypotension, are also associated with cognitive dysfunction and dementia.26 We previously showed that decreased one‐leg standing time was significantly related to cognitive dysfunction.22 Rockwood's model of frailty even allows poor cognition to be included as one of the possible components of frailty,27 leading to the proposal of the condition known as cognitive frailty.28 However, specific factors of frailty associated with cognitive decline are not fully understood.
Sarcopenia, one of the main components of frailty, may underlay the connection between frailty and cognitive impairment. However, studies of the association between sarcopenia and dementia are inconclusive.15, 16, 17, 18, 19 In a large cohort of 7105 elderly women, body composition, low fat mass, and low fat‐free soft mass were significantly associated with cognitive impairment after adjustment for multiple possible confounding variables.15 In the EIDOS cohort, cognitive impairment was significantly associated with slow walking speed and low hand grip strength, but sarcopenic parameters obtained from dual‐energy X‐ray absorptiometry were not related to cognitive impairment.16 Longitudinal findings are also not conclusive. In a 1 year follow up of 131 Japanese elderly subjects, sarcopenia was associated with a larger decline in MMSE scores.18 However, the longitudinal EPIDOS–Toulouse study reported that decreased muscle mass and walking speeds were not associated with cognitive decline in 181 elderly women.19 These findings suggest that differences in the methods used to evaluate sarcopenia, the definition of sarcopenia, and the studied population could underlie the inter‐study inconsistency.29
In the present study, we corroborated previous findings providing insight into the underlying mechanisms linking sarcopenia and cognitive decline. Arterial stiffness has been demonstrated as a risk factor for cognitive decline.10, 11 We have demonstrated that muscle mass showed a significant but modest association with baPWV, which may explain the non‐linear relationship between muscle mass decline and higher baPWV. Because arterial stiffness has also been identified as an underlying mechanism for brain small vessel disease, we further evaluated the possible association between sarcopenic indices and WMHs, which is also thought to be related to cognitive impairment.14
Several studies, including meta‐analyses, report that arterial stiffness is a risk factor for cognitive impairment.10, 11, 12, 13 Recent observations in the Framingham cohort suggest that aortic stiffness is associated with white‐matter injury and cognitive function in midlife,13 consistent with our hypotheses. In the present study, we observed that sarcopenic indices were also related to WMHs, even though the association varied between men and women, as well as between sarcopenic parameters. Thigh muscle CSA was significantly associated with WMHs in men, but co‐varying for baPWV eliminated the significance of this association. However, in women, skeletal muscle mass was significantly associated with WMHs, and interestingly, this association persisted even after correction for baPWV. This finding suggests that other, as yet unknown mechanisms, may also link WMHs and sarcopenic indices in women.
We observed that sarcopenic indices were marginally associated with TDAS scores in men, even after adjustment for several possible confounding parameters. However, muscle mass decline in the bottom 10 and 20% of subjects was not related to cognitive impairment. However, in women, muscle mass decline in the bottom 10% of subjects was significantly related to cognitive impairment, even after adjustment for baPWV and WMHs. Although the precise explanations for the difference between men and women observed in the present study have not yet been elucidated, the arbitrary definition of muscle mass decline (bottom 10 and 20%) might account for this observation. In multiple regression analyses, baPWV was independently associated with TDAS score in women, while WMHs, but not baPWV, was a significant determinant of TDAS score in men (Table S1). These findings indicate that the underlying pathology relating to cognitive decline may differ between men and women in the present population. A negative association between sarcopenia and cognitive impairment was also reported in a large British male population.17
Sarcopenia can be prevented or slowed using multidisciplinary approaches, including physical exercise and nutritional improvement.30 The usefulness of exercise intervention for slowing cognitive decline has been extensively demonstrated in the general population, as well as in dementia patients.31 These findings suggest that sarcopenia could be a useful target for intervention to prevent cognitive decline in the elderly population.
There are several limitations to the present study. Although we evaluated two indices of sarcopenia, we did not measure walking speed. Because slow walking speed is a component of sarcopenia and frailty, inclusion of walking speed could further strengthen the interpretation of the findings. The definition of sarcopenia was arbitrary, and accordingly, the absolute cut‐off values could be different from those of other institutes. All of the participants were independent in daily life. Accordingly, the findings in the present study may not be applicable to dependent frail subjects. Further studies with subjects with different backgrounds and ethnicities are necessary to confirm our findings.
In summary, sarcopenic indices, thigh muscle CSA and skeletal muscle mass, are modestly but significantly related to arterial stiffness and the presence of WMHs, which could explain, at least in part, the association between frailty and cognitive impairment. Sarcopenia may be a useful target for intervention to prevent not only frailty but also cognitive impairment.
Conflict of interest
All authors declare that they have no conflict of interest.
Supporting information
Table S1. Clinical characteristics of study participants split by cutoff value of TDAS score in men and women
Table S2. Multiple regression analyses for the Touch Panel‐type Dementia Assessment Scale score in men.
Table S3. Multiple regression analyses for the Touch Panel‐type Dementia Assessment Scale score in women.
Acknowledgements
This work was supported in part by Grants‐in‐Aid for Scientific Research from the Ministry of Education, Culture, Sports, Science and Technology (no. 25670353 and 16K15419).
The authors certify that they comply with the ethical guidelines for authorship and publishing of the Journal of Cachexia, Sarcopenia and Muscle.32
Kohara, K. , Okada, Y. , Ochi, M. , Ohara, M. , Nagai, T. , Tabara, Y. , and Igase, M. (2017) Muscle mass decline, arterial stiffness, white matter hyperintensity, and cognitive impairment: Japan Shimanami Health Promoting Program study. Journal of Cachexia, Sarcopenia and Muscle, 8: 557–566. doi: 10.1002/jcsm.12195.
References
- 1. Robertson DA, Savva GM, Kenny RA. Frailty and cognitive impairment‐‐a review of the evidence and causal mechanisms. Ageing Res Rev 2013;12:840–851. [DOI] [PubMed] [Google Scholar]
- 2. Dodge HH, Mattek NC, Austin D, Hayes TL, Kaye JA. In‐home walking speeds and variability trajectories associated with mild cognitive impairment. Neurology 2012;78:1946–1952. [DOI] [PMC free article] [PubMed] [Google Scholar]
- 3. Welmer AK, Rizzuto D, Qiu C, Caracciolo B, Laukka EJ. Walking speed, processing speed, and dementia: a population‐based longitudinal study. J Gerontol A Biol Sci Med Sci 2014;69:1503–1510. [DOI] [PubMed] [Google Scholar]
- 4. Ries JD, Echternach JL, Nof L, Gagnon Blodgett M. Test–retest reliability and minimal detectable change scores for the timed “up & go” test, the six‐minute walk test, and gait speed in people with Alzheimer disease. Phys Ther 2009;89:569–579. [DOI] [PubMed] [Google Scholar]
- 5. Verghese J, Ayers E, Barzilai N, Bennett DA, Buchman AS, Holtzer R, et al. Motoric cognitive risk syndrome: Multicenter incidence study. Neurology 2014;83:2278–2284. [DOI] [PMC free article] [PubMed] [Google Scholar]
- 6. Fried LP, Tangen CM, Walston J, Newman AB, Hirsch C, Gottdiener J, et al. Cardiovascular health study collaborative research group. Frailty in older adults: evidence for a phenotype. J Gerontol Med Sci 2001;56A:M146–M156. [DOI] [PubMed] [Google Scholar]
- 7. Chen LK, Liu LK, Woo J, Assantachai P, Auyeung TW, Bahyah KS, et al. Sarcopenia in Asia: consensus report of the Asian working group for sarcopenia. J Am Med Dir Assoc 2014;15:95–101. [DOI] [PubMed] [Google Scholar]
- 8. Abbatecola AM, Chiodini P, Gallo C, Lakatta E, Sutton‐Tyrrell K, Tylavsky FA, et al. Health ABC study. Pulse wave velocity is associated with muscle mass decline: Health ABC study. Age 2012;34:469–478. [DOI] [PMC free article] [PubMed] [Google Scholar]
- 9. Ochi M, Kohara K, Tabara Y, Kido T, Uetani E, Ochi N, et al. Arterial stiffness is associated with low thigh muscle mass in middle‐aged to elderly men. Atherosclerosis 2010;212:327–332. [DOI] [PubMed] [Google Scholar]
- 10. Singer J, Trollor JN, Baune BT, Sachdev PS, Smith E. Arterial stiffness, the brain and cognition: a systematic review. Ageing Res Rev 2014;15:16–27. [DOI] [PubMed] [Google Scholar]
- 11. van Sloten TT, Protogerou AD, Henry RM, Schram MT, Launer LJ, Stehouwer CD. Association between arterial stiffness, cerebral small vessel disease and cognitive impairment: A systematic review and meta‐analysis. Neurosci Biobehav Rev 2015;53:121–130. [DOI] [PMC free article] [PubMed] [Google Scholar]
- 12. Watfa G, Benetos A, Kearney‐Schwartz A, Labat C, Gautier S, PARTAGE study investigators , et al. Do arterial hemodynamic parameters predict cognitive decline over a period of 2 years in individuals older than 80 years living in nursing homes? The PARTAGE study. J Am Med Dir Assoc 2015;16:598–602. [DOI] [PubMed] [Google Scholar]
- 13. Pase MP, Himali JJ, Beiser A, Maillard P, Tsao C, et al. Association of aortic stiffness with cognition and brain aging in young and middle‐aged adults: The Framingham third generation cohort study. Hypertension 2016;67:513–519. [DOI] [PMC free article] [PubMed] [Google Scholar]
- 14. Prins ND, Scheltens P. White matter hyperintensities, cognitive impairment and dementia: an update. Nat Rev Neurol 2015;11:157–165. [DOI] [PubMed] [Google Scholar]
- 15. Nourhashémi F, Andrieu S, Gillette‐Guyonnet S, Reynish E, Albarède JL, Grandjean H, et al. Is there a relationship between fat‐free soft tissue mass and low cognitive function? Results from a study of 7,105 women. J Am Geriatr Soc 2002;50:1796–1801. [DOI] [PubMed] [Google Scholar]
- 16. Abellan van Kan G, Cesari M, Gillette‐Guyonnet S, Dupuy C, Nourhashémi F, Schott AM, et al. Sarcopenia and cognitive impairment in elderly women: Results from the EPIDOS cohort. Age Ageing 2013;42:196–202. [DOI] [PubMed] [Google Scholar]
- 17. Papachristou E, Ramsay SE, Lennon LT, et al. The relationships between body composition characteristics and cognitive functioning in a population‐based sample of older British men. BMC Geriatr 2015;15:172. [DOI] [PMC free article] [PubMed] [Google Scholar]
- 18. Nishiguchi S, Yamada M, Shirooka H, et al. Sarcopenia as a risk factor for cognitive deterioration in community‐dwelling older adults: A 1‐year prospective study. J Am Med Dir Assoc 2016;17:372.e5‐8. [DOI] [PubMed] [Google Scholar]
- 19. van Kan GA, Cesari M, Gillette‐Guyonnet S, Dupuy C, Vellas B, Rolland Y. Association of a 7‐year percent change in fat mass and muscle mass with subsequent cognitive dysfunction: the EPIDOS‐Toulouse cohort. J Cachexia Sarcopenia Muscle 2013;4:225–229. [DOI] [PMC free article] [PubMed] [Google Scholar]
- 20. Ohara M, Kohara K, Tabara Y, Igase M, Miki T. Portable indices for sarcopenia are associated with pressure wave reflection and central pulse pressure: the J‐SHIPP study. J Hypertens 2015;33:314–322. [DOI] [PubMed] [Google Scholar]
- 21. Ohara M, Kohara K, Tabara Y, Ochi M, Nagai T, Igase M. Sarcopenic obesity and arterial stiffness, pressure wave reflection and central pulse pressure: The J‐SHIPP study. Int J Cardiol 2014;174:214–217. [DOI] [PubMed] [Google Scholar]
- 22. Tabara Y, Okada Y, Ohara M, Uetani E, Kido T, Ochi N, et al. Association of postural instability with asymptomatic cerebrovascular damage and cognitive decline: The Japan Shimanami health promoting program study. Stroke 2015;46:16–22. [DOI] [PubMed] [Google Scholar]
- 23. A new guideline making committee of a brain dock . Brain MRI examination In Japanese Society for Detection of Asymptomatic Brain Disease , ed. Braindock Guideline 2014, 4th ed. Tokyo, Japan: Kyobunsha; 2014. p 38–47 (In Japanese). [Google Scholar]
- 24. Inoue M, Jinbo D, Nakamura Y, Taniguchi M, Urakami K. Development and evaluation of a computerized test battery for Alzheimer's disease screening in community‐based settings. Am J Alzheimers Dis Other Demen 2009;24:129–135. [DOI] [PMC free article] [PubMed] [Google Scholar]
- 25. Tomiyama H, Yamashina A, Araia T, Hirose K, Koji Y, Chikamori T, et al. Influences of age and gender on results of noninvasive brachial–ankle pulse wave velocity measurement—a survey of 12 517 subjects. Atherosclerosis 2003;166:303–309. [DOI] [PubMed] [Google Scholar]
- 26. Mehrabian S, Duron E, Labouree F, Rollot F, Bune A, Traykov L, et al. Relationship between orthostatic hypotension and cognitive impairment in the elderly. J Neurol Sci 2010;299:45–48. [DOI] [PubMed] [Google Scholar]
- 27. Rockwood K, Fox RA, Stolee P, Robertson D, Beattie BL. Frailty in elderly people: an evolving concept. CMAJ 1994;150:489–495. [PMC free article] [PubMed] [Google Scholar]
- 28. Kelaiditi E, Cesari M, Canevelli M, van Kan GA, Ousset PJ, Gillette‐Guyonnet S, et al. IANA/IAGG. Cognitive frailty: Rational and definition from an (I.A.N.A./I.A.G.G.) international consensus group. J Nutr Health Aging 2013;17:726–734. [DOI] [PubMed] [Google Scholar]
- 29. Kohara K. Sarcopenic obesity in aging population: current status and future directions for research. Endocrine 2014;45:15–25. [DOI] [PubMed] [Google Scholar]
- 30. Cruz‐Jentoft AJ, Landi F, Schneider SM, et al. Prevalence of and interventions for sarcopenia in ageing adults: a systematic review. Report of the International Sarcopenia Initiative (EWGSOP and IWGS). Age Ageing 2014;43:748–759. [DOI] [PMC free article] [PubMed] [Google Scholar]
- 31. Forbes D, Thiessen EJ, Blake CM, Forbes SC, Forbes S. Exercise programs for people with dementia. Cochrane Database Syst Rev 2013;12:CD006489. [DOI] [PubMed]
- 32. von Haehling S, Morley JE, Coats AJS, Anker SD. Ethical guidelines for publishing in the Journal of Cachexia, Sarcopenia and Muscle: update 2015. J Cachexia Sarcopenia Muscle 2015;6:315-6. [DOI] [PMC free article] [PubMed] [Google Scholar]
Associated Data
This section collects any data citations, data availability statements, or supplementary materials included in this article.
Supplementary Materials
Table S1. Clinical characteristics of study participants split by cutoff value of TDAS score in men and women
Table S2. Multiple regression analyses for the Touch Panel‐type Dementia Assessment Scale score in men.
Table S3. Multiple regression analyses for the Touch Panel‐type Dementia Assessment Scale score in women.