

Abstract
Background
Progressive loss of muscle mass is a major characteristic of cancer cachexia. Consensus definitions for cachexia provide different options to measure muscle mass. This study describes the effect of different methods to determine muscle mass on the diagnosis of cancer cachexia. In addition, the association of cachexia with other features of cachexia, quality of life, and survival was explored.
Methods
Prior to chemotherapy, cachexia was assessed by weight loss, body mass index, and muscle mass measurements, the latter by mid‐upper arm muscle area (MUAMA), computed tomography (CT) scans, and bio‐electrical impedance analysis (BIA). In addition, appetite, inflammation, muscle strength, fatigue, quality of life, and survival were measured, and associations with cachexia were explored.
Results
Included were 241 patients with advanced cancer of the lung (36%), colon/rectum (31%), prostate (18%), or breast (15%). Mean age was 64 ± 10 years; 54% was male. Prevalence of low muscle mass was as follows: 13% with MUAMA, 59% with CT, and 93% with BIA. In turn, the prevalence of cachexia was 37, 43, and 48%, whereby weight loss >5% was the most prominent component of being defined cachectic. Irrespective of type of muscle measurement, patients with cachexia presented more often with anorexia, inflammation, low muscle strength, and fatigue and had lower quality of life. Patients with cachexia had worse overall survival compared with patients without cachexia: HRs 2.00 (1.42–2.83) with MUAMA, 1.64 (1.15–2.34) with CT, and 1.50 (1.05–2.14) with BIA.
Conclusions
Although the prevalence of low muscle mass in patients with cancer depended largely on the type of muscle measurement, this had little influence on the diagnosis of cancer cachexia (as the majority of patients was already defined cachectic based on weight loss). New studies are warranted to further elucidate the additional role of muscle measurements in the diagnosis of cachexia and the association with clinical outcomes.
Keywords: Cachexia, Muscle mass, Cancer
Introduction
Cachexia is a clinically relevant syndrome in cancer and is associated with reduced tolerance to anticancer therapy, reduced quality of life, and reduced survival.1, 2, 3, 4 In ancient times, Hippocrates described cachexia as ‘the flesh is consumed and becomes water,... the abdomen fills with water, the feet and legs swell, the shoulders, clavicles, chest and thighs melt away…’.5 Recently, cachexia has been defined as ‘a complex metabolic syndrome associated with underlying illness and characterized by loss of muscle with or without loss of fat mass’.6 Other features of cachexia are chronic inflammation, poor appetite, decreased muscle strength, and fatigue.7, 8
Cachexia is often underestimated for several reasons, for example the high prevalence of overweight. In a study of Kyle et al., excess fat mass reduced the sensitivity of body mass index (BMI) to detect nutritional depletion in a general hospital population.9 In a study by Sun et al. cachexia was underestimated by oncologists in 77% of the patients, mainly due to good performance status and normal BMIs of the patients.10
A uniform framework to identify patients with cachexia might be helpful for decision making on supportive treatment in patient care, and for research, to be able to compare clinical trials. In 2011, a consensus definition and diagnostic framework for cancer cachexia have been put forward with accompanying cut‐off values for weight loss, BMI, and low muscle mass.6 This framework provides four different options to measure muscle mass: dual energy X‐ray imaging (DEXA), computed tomography (CT), or magnetic resonance imaging (MRI), BIA, and mid‐upper arm muscle area (MUAMA). It is unknown if, and to what extent, the choice for type of muscle measurement affects the diagnosis of cancer cachexia. As DEXA, CT, and MRI are primarily being used in research and BIA and MUAMA in clinical practice, it would be helpful to know whether the measurements are interchangeable in the diagnosis of cancer cachexia. Therefore, the aim of the present study was to detect whether different measures of muscle mass affect the diagnosis of cancer cachexia. A second aim was to explore the association between cachexia (with different muscle measurements) and other features of cachexia, quality of life, and survival in patients with advanced cancer.
Subjects and methods
Patients aged 18 years or older with advanced prostate, lung, breast, or colorectal cancer who were scheduled for palliative chemotherapy treatment at the Departments of Medical Oncology or Pulmonology of the VU University Medical Center Amsterdam were invited to enter the study. Systemic treatment in the past month, clinically overt ascites or serious pitting edema, and missing values for one of the muscle measurements were exclusion criteria. The research protocol was approved by the Medical Ethics Committee of the VU University Medical Center Amsterdam and registered in the Netherlands National Trial Register under number NTR3094. The study was performed in accordance with the ethical standards laid down in the Declaration of Helsinki of 1975 as revised in 1983, and written informed consent was obtained from all participants
Study design
In this observational study, features of cachexia—weight loss, muscle mass, appetite, inflammation, hand grip strength, and fatigue—were determined prior to chemotherapy according to the methods described below. Furthermore, data on WHO performance status,11 comorbidity (Charlson Comorbidity Index),12 and treatment line (counted as consecutive treatment line) were obtained from the medical records.
Cancer cachexia
Weight and height
Body weight was measured (with patients wearing light indoor clothes without shoes) within 0.2 kg on a calibrated scale (Seca type 888). Self‐reported weight from 6 months before inclusion was assessed in order to calculate percentage weight loss. A correction factor for clothes or clothes and shoes was made by deducting weight with, respectively, 1.6 and 2.0 kg for men and 1.0 and 1.3 kg for women.13 Body mass index was calculated as the ratio of body weight (kg)/height (m)2.
Muscle mass
Three different muscle measurements were used in the diagnostic framework of cancer cachexia to detect low skeletal muscle: MUAMA, CT scans, and BIA.
Mid‐upper arm muscle area (MUAMA)
Mid‐upper arm circumference (MUAC) was measured two times at the midpoint of the non‐dominant upper arm between the acromion process and the tip of the olecranon process, using a tape measure. To calculate the mid‐arm muscle circumference, the triceps skin fold (TSF) was measured two times by a trained dietician at the same point using a John Bull skin fold caliper (British Indicators, Ltd., West Sussex, UK). The mean value of these measurements was recorded. Mid‐upper arm muscle circumference (MUAMC) was calculated as follows: MUAC‐(π*TSF). Corrected MUAMA in mm was calculated as follows: (MUAMC × MUAMC) / 100) / (4* π) minus 10.0 for males and minus 6.5 for females.14
Skeletal muscle by computed tomography
Skeletal muscle area (cm2) was measured with SliceOmatic Software V 5.0 (Tomovision, Magog, Canada) using routine CT scans conducted for diagnostic purposes. The third lumbar vertebra (L3) was used as a standard landmark15; the first image extending from L3 to the iliac crest was chosen to measure total muscle cross‐sectional area. The L3 region contains psoas, paraspinal muscles, and the abdominal wall muscles. In patients with lung cancer abdominal CT images were not available; therefore, the fourth thoracic vertebra (T4) was used for the assessment of the skeletal muscle area. T4 contains pectoralis muscles, external intercostal, serratus anterior, teres major, subscapularis, infraspinatus, rhomboid major, erector spinae, and trapezius muscles. The structures of the specific muscles were quantified based on pre‐established thresholds of Hounsfield units (HU) (−29 to +150) of muscle tissue.16
Cross‐sectional areas (cm2) of the sum of all these muscles were computed by summing tissue pixels and multiplying by the pixel surface area for each patient. Skeletal muscle index (SMI) was calculated as the ratio of skeletal muscle area (cm2)/height (m)2.
Fat free mass index by bio‐electrical impedance analysis
Fat free mass index (FFMI) was determined using a bioelectrical impedance analyser (Quadscan, Bodystat, Douglas, Isle of Men, United Kingdom). The measurements were performed prior to chemotherapy, before infusion with fluids, with the patient in supine position. Two current electrodes (Bodystat Electrodes, Bodystat) were placed at the right side at the clean dorsal surfaces of hand and foot on the distal portion of the second metacarpal and metatarsal, respectively. Two detector electrodes were placed at the posterior wrist between the styloid processes of the radius and ulna and at the anterior ankle between the tibial and fibular malleoli. Fat free mass in kg was calculated as: [(height2 / BIA resistance at 50 kHz*0.401) + (gender*3.825) + (age*0.071)] + 5.102.17 Fat free mass was normalized for height and termed FFMI.
Diagnosis of cachexia
Cachexia was defined applying the diagnostic framework of Fearon et al. 6:
Unintentional weight loss > 5% in the previous 6 months OR
Weight loss >2% in 6 months in combination with BMI < 20 kg/m2 OR
*Cut‐off values of muscle mass at T4 level for CT scans have not been provided by the consensus paper.6 The cut‐off values presented are based on a study where patients had SMI data on both L3 and T4 levels; T4 cut‐off values are based on the validated L3 cut‐off value (data not published).
Cachexia features
Patients with cachexia present often with other features such as anorexia, inflammation, low hand grip strength, and fatigue. The methods of these measurements are described below.
Anorexia
Patients filled out two appetite questionnaires: The anorexia/cachexia subscale of the functional assessment of anorexia/cachexia thereapy questionnaire (FAACT‐A/CS) (fourth version, Dutch)18 and the visual analogue scale (VAS) for appetite. Based on previous research, poor appetite was defined as a score ≤37 on the FAACT‐A/CS questionnaire or ≤70 on the VAS for appetite.19
Inflammation
Plasma concentrations of C‐reactive protein (CRP) were measured with an automated latex‐enhanced immunoturbidimetric assay on a Modular P analyser (Roche Diagnostics, Almere, The Netherlands).20 Inflammation was defined as a plasma CRP concentration of ≥8 mg/L (upper limit of normality of the VU University Medical Center).
Low hand grip strength
Hand grip strength was measured using a hydraulic hand dynamometer (Baseline, Fabrication Enterprises, New York). The test was performed sitting with the elbow flexed at 90°, forearm and wrist in neutral position. Patients were instructed to perform two maximal isometric contractions with the right hand. Maximal values were recorded to the nearest 0.5 kg, and the mean of the measurements was used. Grip strength below the fifth percentile of healthy adults21 was regarded as low hand grip strength.
Fatigue
Patients filled out the functional assessment of chronic illness therapy‐fatigue (FACIT‐F) questionnaire, a questionnaire with 13 items that measures an individual's level of fatigue during their usual daily activities over the past week. The level of fatigue is measured on a four‐point Likert scale, resulting of a total score between 0 and 52 with a lower score indicating more fatigue.22
Quality of life
Patients filled out the European Organization for Research and Treatment of Cancer—Quality of Life Questionnaire C30 (EORTC QLQC30) questionnaire, a multidimensional validated cancer‐specific questionnaire that includes global quality of life and subdomains of physical functioning, role functioning, emotional functioning, cognitive functioning, and social functioning. EORTC QLQC30 subscales were calculated according to the EORTC QLQC30 manual and vary from 0 to 100. A high score for a functional or quality of life scale represents a high level of functioning or quality of life.23, 24
Survival
A year after the last patient had been included, survival data were obtained from the electronic medical record of each patient. Survival time was defined as time from inclusion in the study until death. Patient who were still alive were censored at date of last consultation in the hospital or with general practitioner.
Statistical analyses
Statistical analyses were performed using SPSS for Windows version 22 (IBM Corporation, Armonk, NY, USA). Descriptive statistics [count (%), means ± SD, or median and interquartile ranges, as appropriate] were used to describe the study sample regarding patient characteristics and prevalence of low muscle mass and cachexia.
To assess differences in cachexia features and quality of life between patients with and without cachexia based on different muscle measurements, independent t‐tests were used for normal distributed variables (global quality of life and fatigue), Mann Whitney analyses for not normal distributed variables (VAS anorexia, FAACT‐A/CS, CRP, physical functioning, role functioning, emotional functioning, cognitive functioning, and social functioning), and Chi2 tests for categorical variables (anorexia, inflammation, and WHO performance score).
Cox proportional hazards analyses were performed to test associations between overall survival and cachexia (with MUAMA for muscle, CT for muscle, and BIA for muscle, respectively) in patients with stage IV cancer. In multiple regression analyses, adjustments were made for age, sex, cancer type, treatment line (≥second vs. first) and comorbidity (CCI ≥ 1 vs. 0). A P‐value of ≤0.05 was considered significant for all analyses.
Results
Patients
Three‐hundred and sixty‐four patients were invited to participate in this study of which 241 were eligible and willing to participate (Figure 1). Mean age was 64 ± 10 years, 54% was male, and the patients were diagnosed with stage III–IV lung cancer (n = 87, 36%), stage IV colon/rectal cancer (n = 76, 31%), stage IV prostate cancer (n = 43, 18%), or stage IV breast cancer (n = 36, 15%). The majority of patients (79%) was planned to receive first line therapy (Table 1). Mean weight loss was 2.5 ± 6.0%, and mean BMI was 25.0 ± 4.0 kg/m2. Twenty‐two patients (9%) had a BMI of <20 kg/m2.
Figure 1.
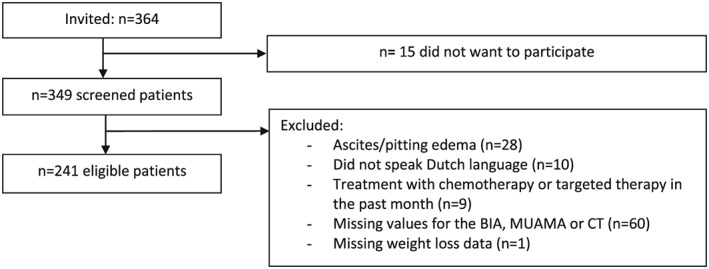
Flowchart.
Table 1.
Patient characteristics (n = 241)
| n (%) | |
|---|---|
| Sex (male) | 130 (54) |
| Age (years)* | 64 ± 10 |
| Cancer site | |
| Colorectal | 76 (31) |
| Lung | 86 (36) |
| NSCLC stage III | 29 (12) |
| NSCLC stage IV | 47 (19) |
| SCLC LD | 4 (2) |
| SCLC ED | 6 (3) |
| Breast | 36 (15) |
| Prostate | 43 (18) |
| Treatment line | |
| First | 190 (79) |
| Second | 31 (13) |
| Higher than second | 20 (8) |
| Surgery in past 6 months | 37 (15) |
Abbreviations: ED, extensive disease; LD, limited disease; NSCLC, non small cell lung cancer; SCLC, small cell lung cancer.
Mean ± sd.
Prevalence of low muscle mass and cachexia
Low muscle mass was prevalent in 13% of patients (n = 32) according to MUAMA, in 59% of patients (n = 142) according to CT and in 93% of patients (n = 224) according to BIA (Figure 2A). The prevalence of cachexia was 37% (n = 88) with MUAMA as muscle measurement, 43% (n = 103) with CT, and 48% (n = 115) with BIA. Eighty‐six patients (36%) were cachectic according to all muscle measurements, 123 patients (51%) were not cachectic according to all muscle measurements, and disagreement in the presence of cachexia occurred in 13% of patients (n = 32, Figure 2B). Weight loss >5% was the factor with the highest influence on the diagnosis of cachexia: out of 88 patients in the cachexia MUAMA category, 78 were already diagnosed by the presence of >5% weight loss. This was 78/103 in the cachexia‐CT group and 78/115 in the cachexia‐BIA group (Figure 2C, 2D, and 2E).
Figure 2.
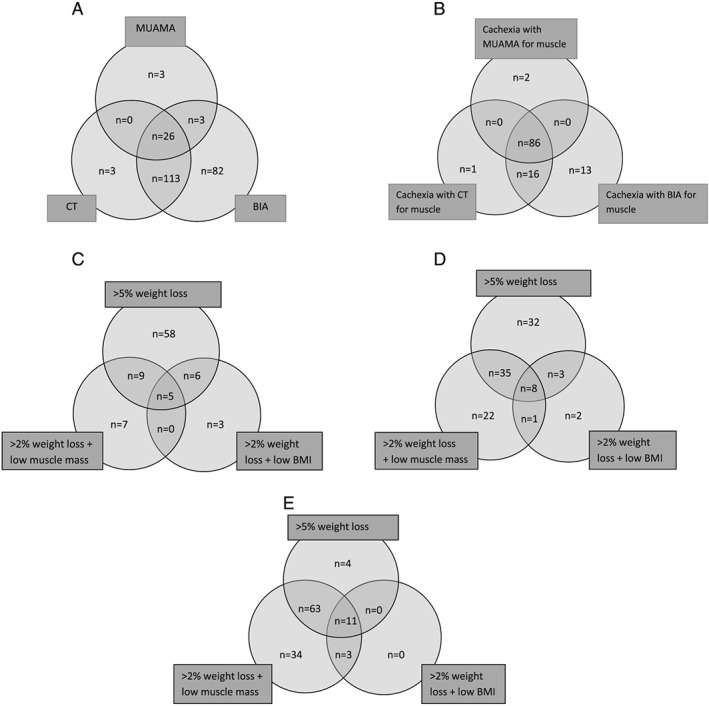
(A). Low muscle mass according to three measurements of muscle mass (n = 230; n = 11 had normal muscle mass according to all three measurements). (B). Overlap in diagnosis of cachexia with different muscle measurements (n = 118; n = 123 had no cachexia). (C). Origin of cachexia diagnosis [with mid‐upper arm muscle area (MUAMA) for muscle, n = 88]. (D). Origin of cachexia diagnosis [with (computed tomography) CT for muscle, n = 103]. (E). Origin of cachexia diagnosis [with bio‐electrical impedance analysis (BIA) for muscle, n = 115].
Association between cachexia and features, quality of life, and survival
Patients with cachexia showed more clinical symptoms and had poorer survival than patients without cachexia, irrespective of type of muscle measurement applied:
Patients with cachexia were more frequently anorectic (57–61% by FAACT‐A/CS, dependent on type of muscle measurement) than patients without cachexia (35–39%, P < 0.01). This was also seen for fatigue: cachexia 31–32 points on FACIT‐fatigue scale vs. no cachexia 37 points, P < 0.005. Presence of inflammation and low hand grip strength was significantly higher in patients with cachexia (71–72 and 42–43%) compared with patients without cachexia (53–57 and 26%, P < 0.05) for two of the three muscle measurements in the diagnostic criteria of cachexia. Furthermore, performance status, overall quality of life, physical functioning, role functioning, cognitive functioning, and social functioning were all significantly different between patients with cachexia compared with patients without cachexia (P < 0.01) for the three muscle measurements (Table 2).
Table 2.
Differences in features of cachexia and quality of life between cachexia groups defined by different muscle measurements
| MUAMA for muscle | CT for muscle | BIA for muscle | |||||||
|---|---|---|---|---|---|---|---|---|---|
| Cachexia (n = 88) % | No cachexia (n = 153) % | P | Cachexia (n = 103) % | No cachexia (n = 138) % | P | Cachexia (n = 115) % | No cachexia (n = 126) % | P | |
| Appetite | |||||||||
| VAS ≤ 70 | 51 | 39 | 0.076 | 53 | 37 | 0.017 | 52 | 36 | 0.010 |
| FAACT ≤ 37 | 60 | 39 | 0.002 | 61 | 35 | <0.001 | 57 | 36 | 0.001 |
| Inflammation | |||||||||
| CRP ≥ 8d | 71 | 57 | 0.048 | 69 | 58 | 0.109 | 72 | 53 | 0.004 |
| Hand grip strength | |||||||||
| <5th percentilec | 41 | 29 | 0.124 | 43 | 26 | 0.019 | 42 | 26 | 0.019 |
| Fatigue (FACIT‐F) b | 31 ± 13 | 37 ± 11 | 0.002 | 31 ± 13 | 37 ± 11 | <0.001 | 32 ± 12 | 37 ± 11 | 0.004 |
| WHO performance status d | |||||||||
| 0 | 22 | 42 | 0.001 | 25 | 41 | 0.007 | 25 | 43 | 0.008 |
| 1 | 57 | 54 | 57 | 54 | 58 | 52 | |||
| ≥2 | 21 | 5 | 18 | 5 | 17 | 5 | |||
| EORTC QLQ C30 | |||||||||
| Quality of lifeb | 52 ± 23 | 62 ± 23 | 0.002 | 52 ± 22 | 64 ± 22 | <0.001 | 53 ± 22 | 64 ± 23 | <0.001 |
| Physical functioninga | 70 (47–87) | 80 (67–93) | 0.001 | 73 (47–87) | 80 (67–93) | <0.001 | 73 (53–87) | 80 (60–93) | 0.004 |
| Role functioninga | 67 (33–67) | 67 (50–100) | <0.001 | 67 (33–67) | 67 (50–100) | <0.001 | 67 (33–67) | 67 (50–100) | 0.001 |
| Emotional functioninga | 71 (58–83) | 75 (58–92) | 0.357 | 75 (58–83) | 75 (58–92) | 0.389 | 75 (58–83) | 75 (58–92) | 0.129 |
| Cognitive functioninga | 83 (67–100) | 92 (83–100) | 0.140 | 83 (67–100) | 83 (83–100) | 0.194 | 83 (67–100) | 83 (83–100) | 0.245 |
| Social functioninga | 67 (50–100) | 83 (67–100) | 0.006 | 67 (50–100) | 83 (67–100) | 0.010 | 67 (50–100) | 83 (67–100) | 0.017 |
BIA, bio‐electrical impedance analysis; CRP, C‐reactive protein; CT, computed tomography; EORTC QLQ C30, European Organization for Research and Treatment of Cancer—Quality of Life Questionnaire C30; FACIT‐F, functional assessment of chronic illness therapy‐fatigue; FAACT, functional assessment of anorexia/cachexia therapy; MUAMA, mid‐upper arm muscle circumference.
Median (interquartile range), Mann–Whitney test.
Mean ± sd, independent t‐test.
%,chi2.
Reference values.21
Missing values for CRP: n = 34; for WHO performance status: n = 70.
Finally, cachectic patients had a worse overall survival compared with non‐cachectic patients after adjustment for age, sex, tumour type, treatment line, and comorbidity: HR 2.00 (1.42–2.83), P < 0.001 for cachexia with MUAMA for muscle; HR 1.64 (1.15–2.34), P = 0.006 for cachexia with CT for muscle and HR 1.50 (1.05–2.14), P = 0.025 for cachexia with BIA for muscle (Table 3).
Table 3.
Multiple Cox regression analyses of the association between cachexia with different muscle measurements and survival (n = 202 patients with stage IV cancer)
| HR (95% CI) | P‐value | |
|---|---|---|
| Cachexia, MUAMA for muscle | 2.00 (1.42–2.83) | <0.001 |
| Cachexia, CT for muscle | 1.64 (1.15–2.34) | 0.006 |
| Cachexia, BIA for muscle | 1.50 (1.05–2.14) | 0.025 |
BIA, bio‐electrical impedance analysis; CI, confidence interval; CT, computed tomography; HR, hazard ratio; MUAMA, mid‐upper arm muscle circumference.
Adjusted for age, sex, tumour type, treatment line, and comorbidity.
Discussion
This is the first study to assess the effect of different measures of muscle mass on the diagnosis of cancer cachexia. Although a large disagreement of 85% on presence of low muscle was found, this had only limited effect on the diagnosis of cancer cachexia. The main reason is that the majority of patients were already defined cachectic by concurrent weight loss of >5% weight loss in the previous 6 months, which thus appeared to be the factor with the highest influence on the diagnosis of cachexia.
Irrespective of type of muscle measurement used, patients with cachexia suffered more often from anorexia, inflammation, low hand grip strength and fatigue, and lower quality of life scores and had worse overall survival compared with patients without cachexia.
A previous study also described disagreement between different muscle measures in patients with cancer,25 whereby low muscle mass according to MUAMC was prevalent in 15% of patients and according to DEXA in 67% of the same patients. Another study showed that prevalence of low muscle mass ranged between 52 and 86% in elderly patients, dependent of type of muscle measurement and chosen cut‐off value.26 The effect of the disagreement in detection of low muscle mass on the diagnosis of cachexia has not been studied previously. We found that prevalence of low muscle mass depended on the type of muscle measurement used; however, these differences in low muscle mass had little influence on the diagnosis of cancer cachexia.
Recently, the diagnostic criteria of cancer associated weight loss were revised which led to a grading system based on BMI adjusted weight loss cut‐off points. Even a subtle amount of weight loss of more than 2.4% was significantly related to shorter survival.27 Muscle measures were not available in this study, but the authors have planned to incorporate these measures into the grading system.27 When the adaption of the grading system will be prepared, a number of issues need to be addressed. For example, our study showed that cut‐off values for low muscle mass need to be (re‐) validated because current muscle measures with their accompanying cut‐off values give different results. Furthermore, attention must be paid to the accuracy and practical availability of measurements. Computed tomography, DEXA, or MRI is regarded as the most accurate method to measure muscle mass; however, these methods are not frequently used in clinical practice. Measurement of MUAMA has been more frequently used in clinical practice but is less accurate due to a high inter‐rater variability.28 Muscle mass measured with BIA needs to be interpreted with caution and cannot be used in patients with altered fluid balance.28 Multiple equations exist to calculate muscle mass from raw data for different BIA analysers and patient populations,29 unknown is which equation can be used best in patients with cancer cachexia. As CT scans are part of routine tumour assessment, this measurement should be made available for clinicians as well.
In our study, cachexia was associated with anorexia, inflammation, fatigue, reduced quality of life, and reduced survival. This result is in line with the results in earlier studies.1, 2, 3, 4, 8, 30, 31, 32, 33 Effective interventions for cachexia with improvement of appetite, fatigue, quality of life, and survival are eagerly awaited. A validated diagnostic framework will help to select the right target group for interventions.
A strength of our study is that we were able to compare three different muscle measurements within each patient. Measurement of BIA and MUAMA was performed by the same researcher within each patient. All measurements were performed by trained researchers. Due to logistic reasons, the CT scans, made for diagnostic purposes, were not performed on the same day as the measurements of BIA and MUAMA. Median (interquartile range) of days between CT scan and the other measures was 17 (7–29) days. However, we do not think that this limitation explains the results we found. Furthermore, muscle mass assessment at T4 level still needs validation. Another limitation is the recall of body weight of 6 months ago. Although Haverkort et al. 34 showed that self‐reported body weight is reliable, recall of body weight might be more difficult.
In conclusion, this is the first study comparing different muscle mass measurements in the diagnostic framework of cachexia. Despite a large disagreement between muscle measures in identifying a low muscle mass in patients, the effect on the diagnosis of cancer cachexia was limited. Future studies should focus on refinement of the diagnostic framework of cancer cachexia and specifically the role for muscle measurements in the diagnosis of cancer cachexia.
Acknowledgements
The authors certify that they comply with the ethical guidelines for authorship and publishing of the Journal of Cachexia, Sarcopenia and Muscle: update 2015.35
This study was financially supported by Fonds NutsOhra (1002‐039). The funder had no role in study design, data collection and analysis, decision to publish, or preparation of the manuscript.
Author contributions
S.B., J.L., H.V., and M.dvdS. designed research; S.B. conducted research; S.B., J.L., H.V., and M.dvdS. analysed and interpreted data; S.B., J.L., A.B., H.V., and M.dvdS. wrote the paper. S.B. and M.dvdS. had primary responsibility for the final content. All authors read and approved the final manuscript.
Conflict of interest
S. Blauwhoff‐Buskermolen: no conflicts of interest
J.A.E. Langius: no conflicts of interest
A. Becker: no conflicts of interest
H.M.W. Verheul: no conflicts of interest
M.A.E. de van der Schueren: no conflicts of interest
Blauwhoff‐Buskermolen, S. , Langius, J. A. E. , Becker, A. , Verheul, H. M. W. , and de van der Schueren, M. A. E. (2017) The influence of different muscle mass measurements on the diagnosis of cancer cachexia. Journal of Cachexia, Sarcopenia and Muscle, 8: 615–622. doi: 10.1002/jcsm.12200.
Clinical trial registry: http://www.trialregister.nl/trialreg/index.asp NTR3094
References
- 1. Thoresen L, Frykholm G, Lydersen S, Ulveland H, Baracos V, Birdsell L, et al. The association of nutritional assessment criteria with health‐related quality of life in patients with advanced colorectal carcinoma. Eur J Cancer Care (Engl) 2012;21:505–516. [DOI] [PubMed] [Google Scholar]
- 2. Thoresen L, Frykholm G, Lydersen S, Ulveland H, Baracos V, Prado C, et al. Nutritional status, cachexia and survival in patients with advanced colorectal carcinoma. Different assessment criteria for nutritional status provide unequal results. Clin Nutr 2013;32:65–72. [DOI] [PubMed] [Google Scholar]
- 3. Vigano A, Del Fabbro E, Bruera E, Borod M. The cachexia clinic: from staging to managing nutritional and functional problems in advanced cancer patients. Crit Rev Oncog 2012;17:293–303. [DOI] [PubMed] [Google Scholar]
- 4. Blum D, Stene G, Solheim T, Fayers P, Hjermstad M, Baracos V, et al. Validation of the Consensus‐Definition for Cancer Cachexia and evaluation of a classification model—a study based on data from an international multicentre project (EPCRC‐CSA). Ann Oncol 2014;25:1635–1642. [DOI] [PubMed] [Google Scholar]
- 5. von Haehling S, Anker SD. Cachexia as a major underestimated and unmet medical need: facts and numbers. J Cachexia Sarcopenia Muscle 2010;1:1–5. [DOI] [PMC free article] [PubMed] [Google Scholar]
- 6. Fearon K, Strasser F, Anker SD, Bosaeus I, Bruera E, Fainsinger RL, et al. Definition and classification of cancer cachexia: an international consensus. Lancet Oncol 2011;12:489–495. [DOI] [PubMed] [Google Scholar]
- 7. Gordon JN, Green SR, Goggin PM. Cancer cachexia. QJM 2005;98:779–788. [DOI] [PubMed] [Google Scholar]
- 8. van der Meij BS, Schoonbeek CP, Smit EF, Muscaritoli M, van Leeuwen PAM, Langius JAE. Pre‐cachexia and cachexia at diagnosis of stage III non‐small‐cell lung carcinoma: an exploratory study comparing two consensus‐based frameworks. Br J Nutr 2013;109:2231–2239. [DOI] [PubMed] [Google Scholar]
- 9. Kyle UG, Pirlich M, Lochs H, Schuetz T, Pichard C. Increased length of hospital stay in underweight and overweight patients at hospital admission: a controlled population study. Clin Nutr 2005;24:133–142. [DOI] [PubMed] [Google Scholar]
- 10. Sun L, Quan XQ, Yu S. An epidemiological survey of cachexia in advanced cancer patients and analysis on its diagnostic and treatment status. Nutr Cancer 2015;67:1056–1062. [DOI] [PubMed] [Google Scholar]
- 11. Oken MM, Creech RH, Tormey DC, Horton J, Davis TE, McFadden ET, et al. Toxicity and response criteria of the Eastern Cooperative Oncology Group. Am J Clin Oncol 1982;5:649–655. [PubMed] [Google Scholar]
- 12. Charlson ME, Pompei P, Ales KL, MacKenzie CR. A new method of classifying prognostic comorbidity in longitudinal studies: development and validation. J Chronic Dis 1987;40:373–383. [DOI] [PubMed] [Google Scholar]
- 13. Frank E, Dunlop AL. What does a patient's outfit weight? Fam Med 2000;32:595–596. [PubMed] [Google Scholar]
- 14. Gibson RS. Anthropometric assessment of body composition In Principles of Nutritional Assessment, 2nd ed. New York: Oxford University Press; 2005. p 273–298. [Google Scholar]
- 15. Shen W, Punyanitya M, Wang Z, Gallagher D, St‐Onge MP, Albu J, et al. Total body skeletal muscle and adipose tissue volumes: estimation from a single abdominal cross‐sectional image. J Appl Physiol 2004;97:2333–2338. [DOI] [PubMed] [Google Scholar]
- 16. Mitsiopoulos N, Baumgartner RN, Heymsfield SB, Lyons W, Gallagher D, Ross R. Cadaver validation of skeletal muscle measurement by magnetic resonance imaging and computerized tomography. J Appl Physiol (1985) 1998;85:115–122. [DOI] [PubMed] [Google Scholar]
- 17. Janssen I, Heymsfield SB, Ross R. Low relative skeletal muscle mass (sarcopenia) in older persons is associated with functional impairment and physical disability. J Am Geriatr Soc 2002;50:889–896. [DOI] [PubMed] [Google Scholar]
- 18. Ribaudo JM, Cella D, Hahn EA, Lloyd SR, Tchekmedyian NS, Von Roenn J, et al. Re‐validation and shortening of the Functional Assessment of Anorexia/Cachexia Therapy (FAACT) questionnaire. Qual Life Res 2000;9:1137–1146. [DOI] [PubMed] [Google Scholar]
- 19. Blauwhoff‐Buskermolen S, Ruijgrok C, Ostelo R, de Vet H, Verheul H, de van der Schueren M, et al. The assessment of anorexia in patients with cancer: cut‐off values for the FAACT‐A/CS and the VAS for appetite. Support Care Cancer 2016;24:661–666. [DOI] [PMC free article] [PubMed] [Google Scholar]
- 20. Burtis CA, Ashwood ER, Tietz NW. Tietz Textbook of Clinical Chemistry. Philadelphia: W.B. Saunderson Company; 1994. [Google Scholar]
- 21. Bohannon RW, Peolsson A, Massy‐Westropp N, Desrosiers J, Bear‐Lehman J. Reference values for adult grip strength measured with a Jamar dynamometer: a descriptive meta‐analysis. Physiotherapy 2006;92:11–15. [Google Scholar]
- 22. Yellen SB, Cella DF, Webster K, Blendowski C, Kaplan E. Measuring fatigue and other anemia‐related symptoms with the Functional Assessment of Cancer Therapy (FACT) measurement system. J Pain Symptom Manage 1997;13:63–74. [DOI] [PubMed] [Google Scholar]
- 23. Aaronson NK, Ahmedzai S, Bergman B, Bullinger M, Cull A, Duez NJ, et al. The European Organization for Research and Treatment of Cancer QLQ‐C30: a quality‐of‐life instrument for use in international clinical trials in oncology. J Natl Cancer Inst 1993;85:365–376. [DOI] [PubMed] [Google Scholar]
- 24. Fayers PM, Aaronson NK, Bjordal K, Groenvold M, Curran D, Bottomley A, on behalf of the EORTC Quality of Life Group . The EORTC QLQ‐C30 Scoring Manual. European Organisation for Research and Treatment of Cancer: Brussels; 2001. [Google Scholar]
- 25. Wallengren O, Iresjo B, Lundholm K, Bosaeus I. Loss of muscle mass in the end of life in patients with advanced cancer. Support Care Cancer 2015;23:79–86. [DOI] [PubMed] [Google Scholar]
- 26. Minetto M, Caresio C, Menapace T, Hajdarevic A, Marchini A, Molinari F, et al. Ultrasound‐based detection of low muscle mass for diagnosis of sarcopenia in older adults. PM R 2016;8:453–462. [DOI] [PubMed] [Google Scholar]
- 27. Martin L, Senesse P, Gioulbasanis I, Antoun S, Bozzetti F, Deans C, et al. Diagnostic criteria for the classification of cancer‐associated weight loss. J Clin Oncol 2015;33:90–99. [DOI] [PubMed] [Google Scholar]
- 28. Di Sebastiano KM, Mourtzakis M. A critical evaluation of body composition modalities used to assess adipose and skeletal muscle tissue in cancer. Appl Physiol Nutr Metab 2012;37:811–821. [DOI] [PubMed] [Google Scholar]
- 29. Kyle UG, Bosaeus I, De Lorenzo AD, Deurenberg P, Elia M, Gomez JM, et al. Bioelectrical impedance analysis‐‐part I: review of principles and methods. Clin Nutr 2004;23:1226–1243. [DOI] [PubMed] [Google Scholar]
- 30. Fearon KC, Voss AC, Hustead DS. Definition of cancer cachexia: effect of weight loss, reduced food intake, and systemic inflammation on functional status and prognosis. Am J Clin Nutr 2006;83:1345–1350. [DOI] [PubMed] [Google Scholar]
- 31. Lasheen W, Walsh D. The cancer anorexia–cachexia syndrome: myth or reality? Support Care Cancer 2010;18:265–272. [DOI] [PubMed] [Google Scholar]
- 32. Wallengren O, Lundholm K, Bosaeus I. Diagnostic criteria of cancer cachexia: relation to quality of life, exercise capacity and survival in unselected palliative care patients. Support Care Cancer 2013;21:1569–1577. [DOI] [PubMed] [Google Scholar]
- 33. Wesseltoft‐Rao N, Hjermstad MJ, Ikdahl T, Dajani O, Ulven SM, Iversen PO, et al. Comparing two classifications of cancer cachexia and their association with survival in patients with unresected pancreatic cancer. Nutr Cancer 2015;67:472–480. [DOI] [PubMed] [Google Scholar]
- 34. Haverkort EB, de Haan RJ, Binnekade JM, van Bokhorst‐de van der Schueren M. Self‐reporting of height and weight: valid and reliable identification of malnutrition in preoperative patients. Am J Surg 2012;203:700–707. [DOI] [PubMed] [Google Scholar]
- 35. von Haehling S, Morley JE, Coats AJS, Anker SD. Ethical guidelines for publishing in the Journal of Cachexia, Sarcopenia and Muscle: update 2015. J Cachexia Sarcopenia Muscle 2015;6:315–316. [DOI] [PMC free article] [PubMed] [Google Scholar]