Abstract
In amblyopia, a visual disorder caused by abnormal visual experience during development, the amblyopic eye (AE) loses visual sensitivity whereas the fellow eye (FE) is largely unaffected. Binocular vision in amblyopes is often disrupted by interocular suppression. We used 96-electrode arrays to record neurons and neuronal groups in areas V1 and V2 of six female macaque monkeys (Macaca nemestrina) made amblyopic by artificial strabismus or anisometropia in early life, as well as two visually normal female controls. To measure suppressive binocular interactions directly, we recorded neuronal responses to dichoptic stimulation. We stimulated both eyes simultaneously with large sinusoidal gratings, controlling their contrast independently with raised-cosine modulators of different orientations and spatial frequencies. We modeled each eye's receptive field at each cortical site using a difference of Gaussian envelopes and derived estimates of the strength of central excitation and surround suppression. We used these estimates to calculate ocular dominance separately for excitation and suppression. Excitatory drive from the FE dominated amblyopic visual cortex, especially in more severe amblyopes, but suppression from both the FE and AEs was prevalent in all animals. This imbalance created strong interocular suppression in deep amblyopes: increasing contrast in the AE decreased responses at binocular cortical sites. These response patterns reveal mechanisms that likely contribute to the interocular suppression that disrupts vision in amblyopes.
SIGNIFICANCE STATEMENT Amblyopia is a developmental visual disorder that alters both monocular vision and binocular interaction. Using microelectrode arrays, we examined binocular interaction in primary visual cortex and V2 of six amblyopic macaque monkeys (Macaca nemestrina) and two visually normal controls. By stimulating the eyes dichoptically, we showed that, in amblyopic cortex, the binocular combination of signals is altered. The excitatory influence of the two eyes is imbalanced to a degree that can be predicted from the severity of amblyopia, whereas suppression from both eyes is prevalent in all animals. This altered balance of excitation and suppression reflects mechanisms that may contribute to the interocular perceptual suppression that disrupts vision in amblyopes.
Keywords: anisometropia, binocular interaction, development, interocular perceptual suppression, strabismus
Introduction
The link between neural and perceptual abnormalities in amblyopia remains poorly understood. Amblyopia is primarily manifest in the clinical setting as an acuity difference between the eyes, so most physiological studies have evaluated neural responses to monocular stimulation (for review, see Levi, 2013). These responses can only partly account for impaired contrast sensitivity and stereoacuity in amblyopic monkeys with experimental strabismus (a turned eye) or anisometropia (unilateral refractive error), the primary amblyopiogenic factors in humans. There are comparatively few studies of cortical activity with binocular viewing (Sengpiel and Blakemore, 1994; Smith et al., 1997; Kumagami et al., 2000; Norcia et al., 2000; Mori et al., 2002; Bi et al., 2011). Binocular assessment stands to improve the characterization of amblyopia's pathophysiology because it can account for binocular interaction. This pathophysiology is of both clinical and basic interest: between 3% and 4% of adults suffer amblyopia (Attebo et al., 1998) and the pathology provides a framework for understanding cortical plasticity over the course of development.
Interocular suppression, wherein one eye's image is unseen, is a key behavioral hallmark in amblyopia and indeed plays a dual role. Suppression is “nature's way out of trouble” (von Noorden and Campos, 2002) in that it affords the developing visual system immunity to double vision (diplopia) and object confusion (two objects appear in one location), both of which arise from incongruent input signals from the eyes (Schor, 1977; Sireteanu et al., 1981; Freeman and Jolly, 1994; Freeman et al., 1996; Kilwinger et al., 2002; Li et al., 2011, 2013a). Conversely, chronic suppression may cause amblyopia (Sireteanu and Fronius, 1981; von Noorden and Campos, 2002) and suppression persists into adulthood, thereby canceling signals that would otherwise support stereoscopic vision, form vision through the amblyopic eye (AE), and support vergence (Horton and Hocking, 1996). Indeed, recent efforts to treat amblyopia using dichoptic stimuli equated for perceived contrast are motivated in terms of their ability to alleviate chronic suppression and, in turn, to alleviate amblyopia (Cleary et al., 2009; Hess et al., 2010; Knox et al., 2012; Li et al., 2013a, b; Ooi et al., 2013). Regardless, the cellular mechanisms underpinning suppression are largely unknown.
Using a novel dichoptic method, we have investigated binocular interactions in six amblyopic macaque monkeys (Macaca nemestrina) and two visually normal controls. These amblyopes were behaviorally verified; overall, the deficits ranged from mild to severe. Data revealed binocular suppression: introducing contrast to the AE decreased responses at binocular cortical sites. We modeled receptive field (RF) organization of excitation and suppression, leading to the novel observation that, although there was a reduction in the binocularity of site excitation in amblyopic cortex, suppression remained intact. This plastic change could be central to the preservation of single vision in amblyopia, suppressing otherwise conflicting spatial information arising from the two eyes and thus avoiding double vision.
Materials and Methods
Subjects.
Animal care and experimental procedures were conducted in accordance with protocols approved by the New York University Animal Welfare Committee and conformed to the National Institutes of Health's Guide for the Care and Use of Laboratory Animals. We studied eight adult female macaques (M. nemestrina): six behaviorally verified amblyopes and two visually normal controls. Amblyopia resulted from rearing with either unilateral blur, a model for anisometropic amblyopia, or experimental strabismus, leading to strabismic amblyopia. Methods for inducing the development of amblyopia have been described in detail previously (Kiorpes, Kiper, and Movshon, 1993; Kiorpes, Tang and Movshon, 1999). Briefly, anisometropia was produced by rearing with extended-wear soft contact lenses (Contact Lens Precision Labs; MedLens Innovations). A strong blurring lens (−8 or −10 diopters) was placed in one eye and a plano lens in the fellow eye (FE). Strabismus was induced surgically in 3 animals at 2–3 weeks of age by resection of the medial rectus muscle and transection of the lateral rectus muscle of 1 eye. The control animals were untreated.
Behavioral testing and histology.
Subjects' contrast sensitivity was measured monocularly using a two-alternative forced-choice sine wave grating detection task (Kiorpes et al., 1999). Amblyopia severity was quantified using an amblyopia index (AI). AI varies from 0 to 1, indicating, at one extreme, no difference in contrast sensitivity between the eyes and, at the other extreme, complete blindness in the AE. At the end of electrophysiological recording (described below), the animal was killed with an overdose of sodium pentobarbital and perfused transcardially. Behavioral testing and histology are described in detail in Shooner et al. (2015).
Surgical preparation.
Electrophysiological recording took place between 2 and 17 years after behavioral testing. Because amblyopia is caused by abnormal binocular experience during the critical period of development and, left untreated, persists into adulthood in both humans and monkeys (Kiorpes et al., 1998; Chua and Mitchell, 2004), it is unlikely that the time elapsed between behavioral and electrophysiological measurements is a significant factor in the present study. Experiments typically lasted 5 d, during which we maintained anesthesia and paralysis with continuous intravenous infusion of sufentanil citrate (initially 6 μg/kg/h and increased thereafter to maintain a suitable level of anesthesia) and vecuronium bromide (0.1 mg/kg/h) in isotonic dextrose-Normosol solution. We monitored vital signs constantly (electroencephalograph, blood pressure, heart rate, lung pressure, end-tidal pCO2, temperature, and urine flow and osmolarity) and actively maintained these signs within appropriate physiological limits. We dilated pupils with topical atropine and protected the corneas with oxygen-permeable contact lenses. Supplementary lenses were chosen via direct ophthalmoscopy to make the retinas conjugate with the experimental display. We used two mirrors to redirect the eyes' optical axes independently to separate locations on the stimulus monitor.
Electrophysiological recording.
We described electrophysiological recording techniques previously (Shooner et al., 2015). In brief, we made an occipital craniotomy and durotomy, allowing visualization of the operculum and lunate sulcus, and implanted a 96-electrode “Utah” array (Blackrock Systems) near the estimated location of the V1/V2 border. Array electrodes were 1 mm long, 400 μm apart, and formed a regular, rectangular grid parallel to the cortical surface. We pneumatically inserted the array to a depth of 500–1000 μm. After the initial recording, the array was removed and either a new array or the same array was implanted at a different border location. In each animal, we performed two implantations in each cortical hemisphere: one medial, in cortex representing the parafoveal visual field, and one lateral, close to the cortical representation of the fovea.
Visual stimulation.
We presented stimuli on a gamma-corrected CRT monitor (Eizo T966), with spatial resolution 1280 × 960 pixels, temporal resolution 120 Hz, and mean luminance 35 cd/m2. Viewing distance was 1.14 m (parafoveal implantations) or 2.28 m (foveal implantations). Stimuli were generated using an Apple Macintosh computer running Expo (http://corevision.cns.nyu.edu).
We created dichoptic stimuli by multiplying each of two sinusoidal “carrier” gratings by a raised, sinusoidal “modulator” grating, as illustrated in Figure 1. Both carriers drifted at 4.1 Hz. For each implantation, we hand-mapped the response fields of many cortical sites using a sinusoidal grating patch, qualitatively determining each site's response field position and preference for spatial frequency (SF) and drift direction. The SFs and drift directions of the carriers comprising the dichoptic stimuli were identical between eyes and chosen based on hand mapping to drive many cortical sites. Stimuli appeared within a vignetted circular aperture of diameter equal to eight carrier cycles; stimuli were centered to encompass all sites' response fields. Carrier contrast was sinusoidally modulated between 0% and 40%. We used moderate-contrast stimuli to minimize the effect of contrast adaptation, the attenuation of neuronal responses typically seen after prolonged exposure to high-contrast stimuli (Movshon and Lennie, 1979). Sclar et al. (1989) examined the effect of low- and moderate-contrast adapters (3.5%, 12.5%, and 50%) on responses of neurons in macaque V1, finding that 49 of the 56 neurons studied were virtually unaffected. From trial to trial, we independently and pseudorandomly varied the modulators' drift directions and SFs (six directions relative to the carrier's direction: 0, 60, … 300°; seven relative SFs: 0, 0.12,0.24, 0.48, 0.96, 1.44, and 1.92 × carrier's SF). Trials were 4 s in duration and followed one another with no intertrial interval. The two modulators drifted at different rates of 0.5 and 1.67 Hz; this “frequency tagging” enabled estimation of response field organization separately each eye.
Figure 1.
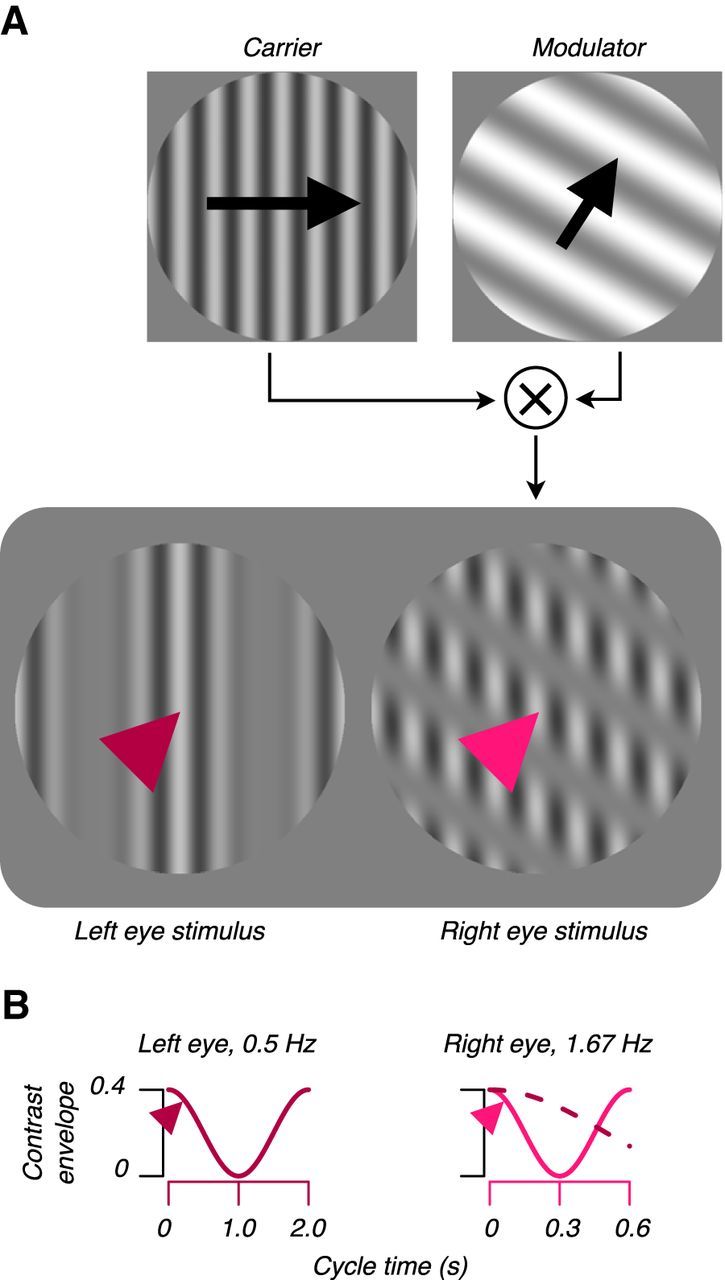
Dichoptic stimulus construction. We multiplied two large patches of sinusoidal carrier grating with two raised, sinusoidal modulators (shown for the RE only) (A). Carriers' SFs, drift directions, and speeds were identical. We drifted one modulator at 0.5 Hz (here, LE) and the other at 1.67 Hz (RE) (B). Contrast envelopes were sinusoidal. From trial to trial, we independently varied modulators' SFs and drift directions, enabling estimation of the multiunit RF in each eye. The left and right arrowheads in A mark the spatial locations of the contrast envelopes illustrated in B. The LE contrast envelope is reproduced as a dashed line (B, right) to illustrate the different modulator drift speeds. Arrows and arrowheads are for illustration and did not appear in the stimulus.
Response measures.
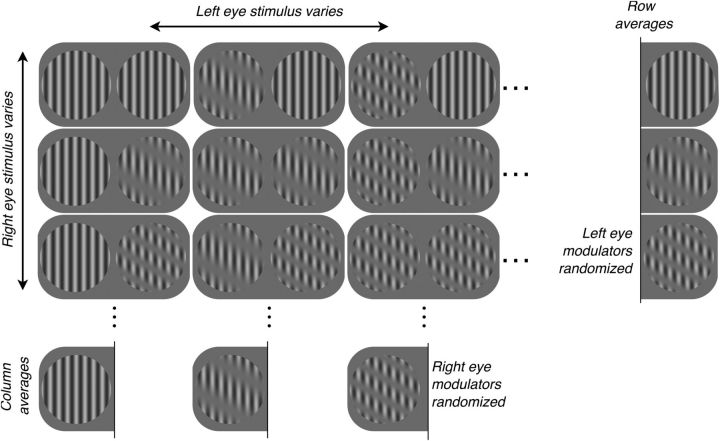
The experiment comprised 37 × 37 = 1369 trials, each of 4 s duration (Fig. 2). We presented 37 different stimuli to the left eye (LE): the full-field (0 cycles/degree [c/deg]) contrast modulation of the carrier grating (Fig. 2, top left icon) plus six other modulator SFs and six modulator drift directions. Similarly, we presented 37 different stimuli to the right eye (RE). Each LE stimulus was paired with each RE stimulus and vice versa and the resulting dichoptic stimuli were each presented once. From trial to trial, we randomized the spatial phases of LE and RE carriers and the modulators independently. As described in detail in Results, data analysis was synchronized to the phase shifts of the modulators. To obtain the response of a cortical site to a particular LE stimulus, we averaged fundamental responses on all 37 trials of that stimulus (shown in Fig. 2 as a column average). In doing so, we assumed that, because LE and RE modulators drifted at different rates and because the relative phase of modulators was randomized across trials, averaging fundamental responses to the LE modulator mitigates systematic effects of the RE modulator but retains the drive provided by the carrier. We obtained the response to a RE stimulus in an analogous way (as illustrated in Fig. 2 by averaging a row).
Figure 2.
Experimental design. The experiment comprised 37 × 37 = 1369 trials, represented by this design matrix fragment. There were 37 different LE stimuli, shown here varying across columns: six modulator SFs and six modulator drift directions, plus the full-field (0 c/deg) contrast modulation of the carrier grating (top, leftmost icon). There were 37 different RE stimuli, shown here varying across rows. The LE and RE modulators drifted at different rates (Fig. 1). We presented each LE stimulus, paired once with each RE stimulus (e.g., the first column of the matrix), and vice versa. From trial to trial, we independently randomized the starting spatial phases of LE and RE carriers and modulators; we accounted for these modulator phases when averaging responses over trials. To obtain the response of a cortical site to a particular LE stimulus, we averaged responses on all trials of that stimulus, shown here as averaging a column of the matrix. Under reasonable assumptions, a column average removes systematic effects of the modulator in the RE; that is, the effective RE stimulus is a half-contrast carrier grating. Similarly, the response to a RE stimulus was obtained by averaging a row.
For each eye, we fit a functional model, described in detail below, to these modulator responses in the SF domain. We used the inverse Fourier transform of the model fit to infer the spatial composition of the RF. This RF model comprises an excitatory subregion and a suppressive subregion and therefore can capture both excitatory and suppressive effects of an eye on cortex (Tanaka and Ohzawa, 2009; Hallum and Movshon, 2014). Because amblyopes' binocular vision is disrupted by suppression, we used this model to investigate alterations to the way in which FE and AEs impart excitation and suppression to cortex.
Multiunit RF model.
We modeled the spatial organization of multiunit RF centers and surrounds separately in each eye using a difference of Gaussian envelopes (DoGE). Each eye's center-surround field, which describes the sensitivity of a cortical site to contrast modulations of the carrier grating, is constrained by 12 parameters as follows:
 |
where
 |
and
 |
The term Ac specifies the gain of the excitatory Gaussian. The terms μcx and μcy specify the position of the excitatory Gaussian relative to the center of the stimulus. The terms σcx and σcy specify the radii of the excitatory Gaussian. The five other similarly labeled terms pertain to the suppressive Gaussian. Two additional parameters not shown enabled each Gaussian to rotate about its offset position.
DoGE is commonly used to model the spatial organization of the retinal ganglion cell's RF to luminance variations (Rodieck and Stone, 1965; Enroth-Cugell and Robson, 1966). However, here, as in a monocular precursor of this model applied to single-unit responses in cat (Tanaka and Ohzawa, 2009) and monkey (Sceniak et al., 1999, 2001; Cavanaugh et al., 2002a; Levitt and Lund, 2002; Hallum and Movshon, 2014), we used DoGE in a different context: to model the spatial organization and sensitivity of cortical neurons to the contrast of a carrier grating (Fig. 1).
To find the model parameters that best accounted for the measured responses, we minimized the squared error between the model's response and the measured response at each SF by treating real and imaginary components of responses separately. For each site or neuron, multiple fits were performed using different starting parameters. Parameters were adjusted iteratively using the Nelder–Mead optimization algorithm.
Ocular dominance index (ODI) and excitation index (EI).
These fits allowed us to estimate the magnitudes of excitation and suppression comprising RFs. Using these magnitudes, we derived ODIs and EIs. In the AE, we defined the EI as follows:
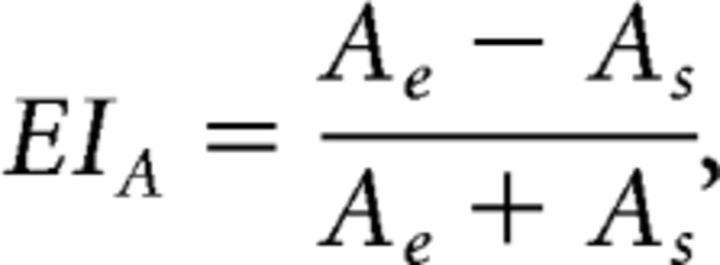 |
where Ae is the integral of the AE's fitted RF after half-wave rectification (suppressive regions of the field were zeroed) and As is the absolute value of the integral of the fitted field after zeroing excitation. Similarly, the equation for the FE is as follows:
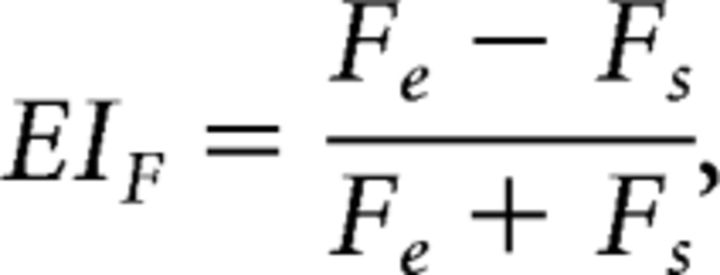 |
This EI varies between 1 and −1, indicating that the RF imparted only excitation or only suppression, respectively, to the responses measured at a site. An EI near 0 indicated balanced excitation and suppression.
We derived the ODI separately for excitation as follows:
 |
and for suppression as follows:
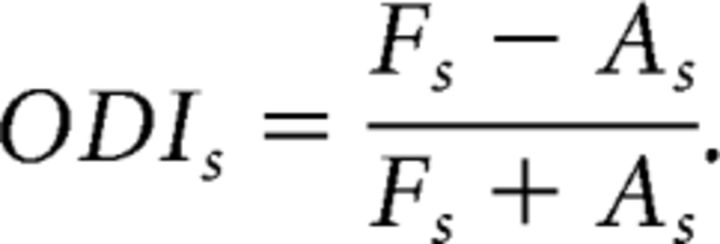 |
The ODI varies between 1 and −1. An ODIe of 1 indicates that the excitatory field in the FE (or, in the control subjects, the RE) dominated the AE (or, in the control subjects, the LE). An ODIe of −1 indicates that the AE dominated the FE. Similarly, ODIs indicates whether the FE suppressive fields dominated the AE or vice versa.
Responsive/unresponsive cortical sites.
To determine whether a cortical site was driven by stimulation of an eye, we fit a descriptive model to its response amplitudes pooled over modulators that drifted in opposite directions but were otherwise identical. We fit the model using ordinary least-squares, and computed a χ2 statistic adjusted for the model's degrees of freedom. When this model provided a better description of responses than the mean (over all modulator SFs and orientations), we deemed the site responsive to that eye.
Experimental design and statistical analyses.
Amblyopes vary widely in the strength of their visual deficits; our sample size of six amblyopes was necessary to span the range from mild to severe amblyopia. In each subject, we sought to maximize the number of multiunit sites characterized and found four array penetrations per animal to be an upper limit given the geometry of our placement on the V1/V2 border and need for careful histological reconstruction of each recorded site. To compare derived measures (ODIs and EIs) across subjects, we used the Kruskal–Wallis rank-sum test implemented in R (version 3.2.3), a language and environment for statistical computing.
Results
We analyzed responses from 28 of 32 array implantations in six amblyopic subjects and two visually normal controls; data from four implantations in three amblyopic subjects were discarded because the experiment was not run to completion. Typically, multiunit response fields were within 1° of the fovea (lateral array implantations; n = 14) or at eccentricities between 2° and 7° (medial implantations; n = 14). We quantified multiunit selectivity for modulator SF and drift direction. Unresponsive sites were discarded and we modeled the monocular and binocular response fields of those that remained. Histology revealed 82 sites recorded in the moderate anisometrope (AI = 0.42) were in visual area V4. These data showed little quantitative difference from data recorded in V1 and V2 and were included in population analyses.
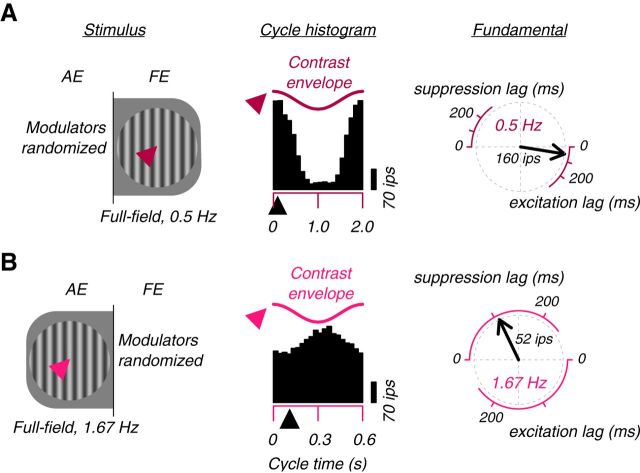
We recorded from 2688 sites in amblyopic and normal visual cortex; 2042 (76%) responded reliably to visual stimulation. The introduction of the carrier grating to a cortical site's response field in either eye, either by full-field stimulation or via the passage of a drifting contrast modulation (Fig. 1), often modulated firing rates. In Figure 3A, we illustrate responses to FE stimulation measured at a single site in a strabismic amblyope. There, we modulated the overall contrast of this FE, full-field stimulus at 0.5 Hz, presenting the stimulus 37 times for 4 s on each trial. The histogram shows the site's response averaged over two cycles and 37 trials. Because we dichoptically paired this stimulus with all 37 different stimuli appearing in the AE (see Materials and Methods), this trial average, under our assumptions, averaged away any systematic effects of the modulator in the AE, but retained drive provided by the sinusoidal carrier grating appearing in that eye. As shown, the responses synchronized to the periodic introduction and withdrawal of the carrier grating; at a cycle time of 0 s, with the addition of a short latency period, the multiunit firing rate approached 270 impulses/s; during the opposite phase of the modulation, that is, at a cycle time of ∼1 s, the site's response was near 0. We computed the fundamental (0.5 Hz) response to this FE, full-field stimulus. The phase lag of the fundamental response, plotted on the right of Figure 3A, suggested that these responses were excitatory and occurred with a short lag (55 ms).
Figure 3.
The FE excites cortex and the AE suppresses it. A, Example cortical site that responded strongly to FE stimulation. The cycle histogram is the mean of all trials of full-field (0 c/deg) contrast modulation of the FE carrier grating (modulation of the AE grating was randomized over these trials; Fig. 2). The response synchronized with the contrast modulation. At a slight lag (black arrowhead below histograms), the response rate decreased/increased with decreasing/increasing contrast, as illustrated by the phase relationship of the response and the contrast envelope shown above (Fig. 1). At right, the fundamental component of the response is shown by the black vector. The vector's clockwise rotation from 0° represents the lag. B, AE stimulation suppressed this site. The histogram is the mean of all trials of full-field contrast modulation of the AE grating. The modulation of the FE grating was randomized over these trials and, under reasonable assumptions, had little modulatory effect on the mean response, but provided the drive that was periodically suppressed. The response synchronized with the periodic stimulus, but with opposite sign. At a slight lag (black arrowhead), the response rate increased/decreased with decreasing/increasing stimulus contrast. At right, the fundamental response is represented by a black vector. The vector's clockwise rotation from 180° represents the suppression lag.
We found abundant suppression: the introduction of the carrier grating to a cortical site's response field often reduced firing rates. In Figure 3B, we illustrate the responses to AE stimulation of the same site that was excited by FE stimulation. Here, we modulated the overall contrast of this AE, full-field stimulus at a rate of 1.67 Hz, again presenting it 37 times for 4 s on each trial. The histogram shows the site's trial-averaged response, which includes the drive provided by the appearance of the carrier grating in the FE, but not the systematic effects of contrast modulation in that eye. As shown, responses synchronized with the periodic introduction and withdrawal of the carrier grating, but they synchronized with opposite phase. At a cycle time of 0 s, after a short latency delay, the multiunit firing rate was low. During the opposite phase of the modulation, that is, at a cycle time of ∼0.3 s, the site's response was high. We computed the fundamental (1.67 Hz) response to this AE, full-field stimulus. The phase of the fundamental response, plotted on the right of Figure 3B, suggested that these responses were suppressive and occurred with a short lag (112 ms). In subsequent figures, we plot excitatory response amplitudes as positive and suppressive response amplitudes as negative.
We observed diverse tuning to modulator orientation and SF. We revealed this diversity by plotting every site's RE and LE modulator tuning curves. In Figure 4 are 10 examples plotting the amplitude of the fundamental response against the SF of the contrast modulation for the three different orientations. Recall that these are “second-order” tuning curves: throughout the experiment, the (first-order) parameters governing the carrier gratings' orientation and SF were fixed, but the (second-order) SFs and drift directions of the contrast modulations were varied systematically (Fig. 4, top row icons). In Figure 4A are responses to RE and LE stimulation measured at a single cortical site in the visually normal subject. This site showed band-pass tuning to contrast modulations in the RE, responding preferentially to modulators at moderate SFs (∼0.5 times the carrier grating's SF), and at orientations 60° and 120° relative to the carrier's orientation. However, this site was unresponsive to stimulation of the LE. In Figure 4, B and C, are responses at binocular sites encountered in a visually normal control and a strabismic amblyope, respectively. The former of these two sites showed low-pass modulator tuning that was similar in the two eyes. The latter site showed band-pass and orientation-selective modulator tuning and was not dissimilar from sites often encountered in normal cortex.
Figure 4.
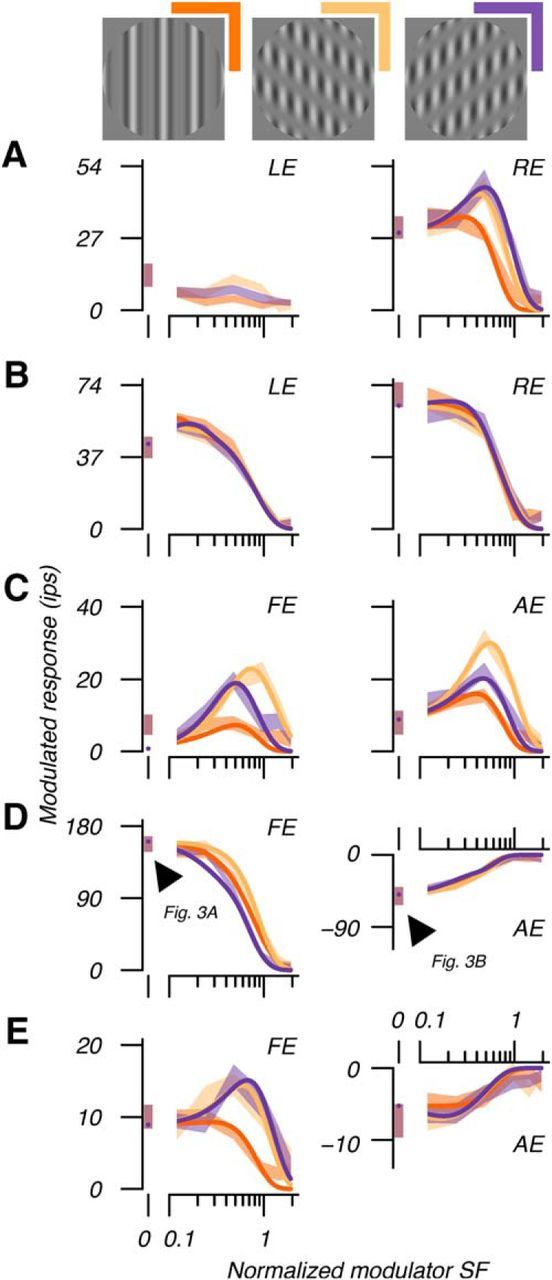
Responses revealed multiunit RF structure. A, At this example monocular site in normal cortex, RE response amplitudes varied with modulator orientation (icons), revealing response field (RF) circular asymmetry. The difference between the optimal response at approximately half the carrier spatial frequency and the full-field response at 0° revealed surround suppression. Curves show the fitted DoGE RF model. The LE was unresponsive (see text). Response amplitudes are pooled over modulator direction and shading shows SEM across trials. B, Example binocular site in normal cortex dominated by RE stimulation. C, Example strabismic amblyopic site responsive to FE and AE stimulation. D, Example strabismic amblyopic site dominated by the FE, but nonetheless highly responsive to both eyes. Responses to the AE were suppressive (cf. Fig. 3B). For this reason, we have represented the response amplitudes as negative. Arrowheads indicate responses illustrated in Figure 3. E, Example anisometropic amblyopic site. This site was binocular, but responses to the AE were again suppressive.
A distinctive feature of data recorded from amblyopic animals was suppression. Data from two sites showing suppression are shown in Figure 4, D and E, one from a strabismic amblyope and the other from an anisometrope. The first site showed low-pass tuning in the FE, responding preferentially to full-field contrast modulation and showing little preference for modulator orientation. This site was suppressed by stimulation of the AE. This pattern of suppression was similarly low pass and impartial to modulator orientation; suppression was greatest for a full-field contrast modulation. The two arrowheads in Figure 4D indicate the responses shown in Figure 3. In addition to low-pass modulator tuning, we often encountered band-pass tuning to FE stimulation, as illustrated in Figure 4E. There, suppression caused by AE stimulation was low pass, similarly to that seen in Figure 4D.
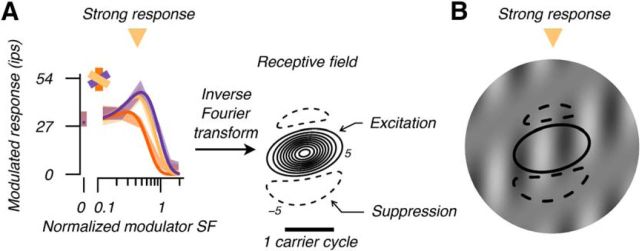
The diversity of modulator tuning (exemplified in Fig. 4D,E) indicated diverse RF composition, which we investigated by modeling responses. We fit the DoGE model in the SF domain separately for each eye (Fig. 5). We computed the inverse Fourier transform of the fit to estimate response field spatial organization (Tanaka and Ohzawa, 2009; Hallum and Movshon, 2014). On the right of Figure 5A, the solid contours show an estimate of the shape and sensitivity of the response field's excitatory center. The dashed contours estimate the suppressive region of the RF. The multiunit excitatory and suppressive subfields are analogous, respectively, to the single-unit classical RF and extraclassical suppressive surround (Sceniak et al., 1999, 2001; Cavanaugh et al., 2002a, b; Levitt and Lund, 2002; Tanaka and Ohzawa, 2009; Henry et al., 2013; Shushruth et al., 2013; Hallum and Movshon, 2014). Note that this multiunit response field should not be confused with the classical RF of a simple cell, the subregions of which are sensitive to changes in luminance. Instead, the field illustrated in Figure 5A comprises subregions that are sensitive to contrast modulations; specifically, modulations in the contrast of the carrier grating used to stimulate the RE. In Figure 5B is a stimulus that should (and did) elicit vigorous firing at this cortical site superimposed by contours of the modeled response field. The anisotropic spatial organization of a response field can account for the changes in modulator SF selectivity with modulator orientation (e.g., low pass vs band pass). As illustrated in Figure 5, a vertical modulator engaged both excitatory center and suppressive surround, whereas a modulator 60° from vertical engaged the excitatory center selectively. This selective engagement of the center released responses from surround suppression, which, in turn, imparted the band-pass selectivity seen in the tuning curve at that modulator orientation.
Figure 5.
Multiunit RF estimate. A, We inverse Fourier transformed the model fit, giving the organization of central excitation (solid contours) and surrounding suppression (dashed). This field describes an envelope of contrast sensitivity to the sinusoidal carrier grating stimulating the RE (Fig. 4). Peak field sensitivity is normalized to 100. Contour interval is 10. B, We superimposed contours −5 and 5 on a stimulus that elicited vigorous responses; when the carrier grating stimulated central excitation, it was mostly absent from the surround suppressive regions as shown. In this and all subsequent figures, we rotated RFs so that the sinusoidal carrier grating is vertical and drifting right.
Response fields varied in their spatial structure and in the relative strengths of excitation and suppression. In Figure 6A are RFs of a binocular cortical site in the visually normal control subject. We normalized fields to peak excitation, thus enabling interocular comparison; at this site, the RE was more sensitive to contrast, as indicated by the contours. We used these modeled response fields to quantify the balance of excitation and suppression within and between eyes. We computed an EI separately for RE and LE fields (see Materials and Methods), which varied between 1, indicating that the response field imparted only excitation at its cortical site, and −1, indicating that the field imparted only suppression. The EIs at this site were close to 1, indicating that excitation outweighed suppression. We also computed an ODI separately for excitation and suppression (see Materials and Methods). The ODI for excitation varied between 1 and −1, indicating that only the RE (or, in amblyopic subjects, the FE) imparted excitation or only the LE (AE) eye imparted excitation, respectively. An ODI for excitation of 0 indicates a site excited equally by either eye. Similarly, the ODI for suppression, which also varies between 1 and −1, indicates the relative strength of suppressive fields in the 2 eyes. The ODIs at this site showed the RE's dominance (ODI > 0), both excitatory (ODIe = 0.15) and suppressive (ODIs = 0.99).
Figure 6.
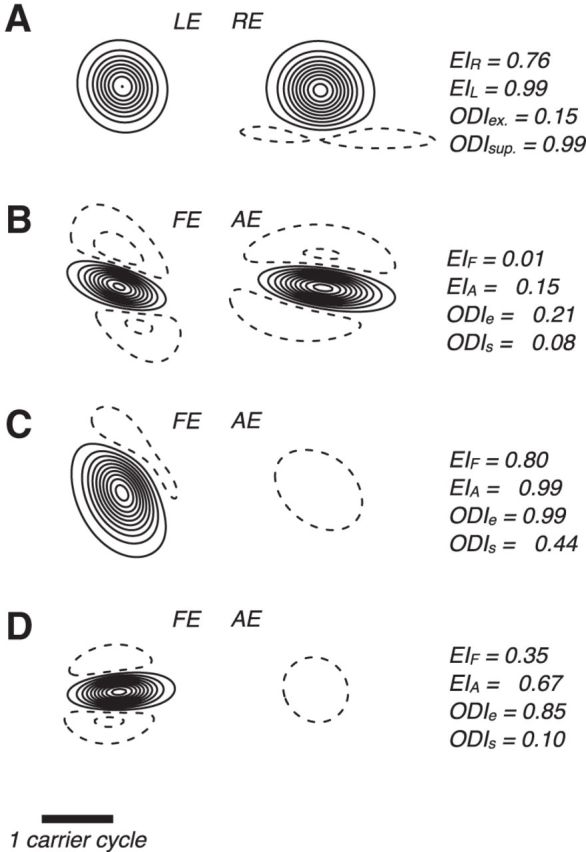
Withdrawal of excitation in the AE. A, Binocular site in normal cortex (cf. Fig. 4B) showing the spatial organization of central excitation (solid contours) and surrounding suppression (dashed) of the RE and LE. We normalized fields to peak excitation. We used field estimates to compute EIs, EIR, and EIL, which vary between 1 and −1, indicating that the RF imparted only excitation or only suppression to the cortical site's response, respectively. EI = 0 indicates balanced excitation and suppression. We also computed an ODI separately for excitation, ODIe, and suppression, ODIs. ODIe = 1 indicates that the excitatory field in the RE (or, in amblyopic subjects, the FE) dominated the LE (or AE). ODIe = −1 indicates excitation in the LE (AE) dominated the RE (FE). Similarly, ODIs indicates whether RE (FE) suppressive fields dominated LE (AE) or vice versa. We rotated these and all other fields illustrated such that the carrier grating is vertical and drifting right. Other graphical conventions are as in Figure 5. B, Fields for example binocular site in amblyopic cortex (cf. Fig. 4C) showing asymmetric organization in both eyes. C, Stimulation of the AE strongly suppressed cortical responses, illustrated here by the suppressive response field in that eye (cf. Figs. 3, 4D). D, Similarly, at this site, stimulation of the AE suppressed cortical responses (cf. Fig. 4E). The scale bar applies to all.
The binocular response fields in Figure 6, C (encountered in a strabismic amblyope) and D (encountered in an anisometropic amblyope), illustrate the disrupted balance of excitation and suppression in amblyopia. Here, the modeled response fields in the FEs appeared similar to fields typically encountered in cortex of the visually normal subjects. These FEs were more sensitive to contrast than their amblyopic counterparts and, accordingly, the ODIs for excitation were near 1. As shown, excitation was largely absent from the modeled response fields in the AEs. Accordingly, the AE EIs were near −1. We also encountered, albeit less frequently, binocular response fields that showed greater sensitivity to contrast modulations in the AE than in the FE and appeared similar to fields that we typically encountered in normal cortex (Fig. 6B).
To quantify the effect of AEs on cortex, we computed ODIs at all responsive sites. For each site, we computed an index between −1 and 1, as illustrated for 4 example binocular sites in Figure 6. Figure 7A shows distributions of these indices for all subjects. We found an association between severity of amblyopia and ocular dominance for excitation, ODIe. Cortex of normal control subjects and cortex of mild amblyopes (e.g., AI = 0.21, 0.24) was approximately equally responsive to stimulation of either eye (median ODIe near 0). Cortex of more severe amblyopes (e.g., AI > = 0.42) was dominated by the FE (medians near 1). This shift of the ocular dominance distribution toward the FE, including a reduction (although not the elimination) of the monocular cortical representation of the AE, is broadly consistent with our previous report in this cohort of animals (Shooner et al., 2015) and previous reports of alterations of binocularity in amblyopic cortex (Movshon et al., 1987; Crawford et al., 1993; Smith et al., 1997; Kiorpes et al., 1998; Bi et al., 2011). Those previous reports tested eyes monocularly when estimating ocular dominance, whereas here we used dichoptic testing. In contrast, we found little association between severity of amblyopia and ocular dominance for suppression, ODIs. In seven of eight subjects, median ODIs was near 0, indicating that FE and AEs had approximately equal suppressive influence. In the most severe anisometrope (AI = 0.75), there was a small number of monocular sites at which spontaneous activity was suppressed by stimulation of the FE, shifting the distribution of ODIs for that animal toward 1.
Figure 7.
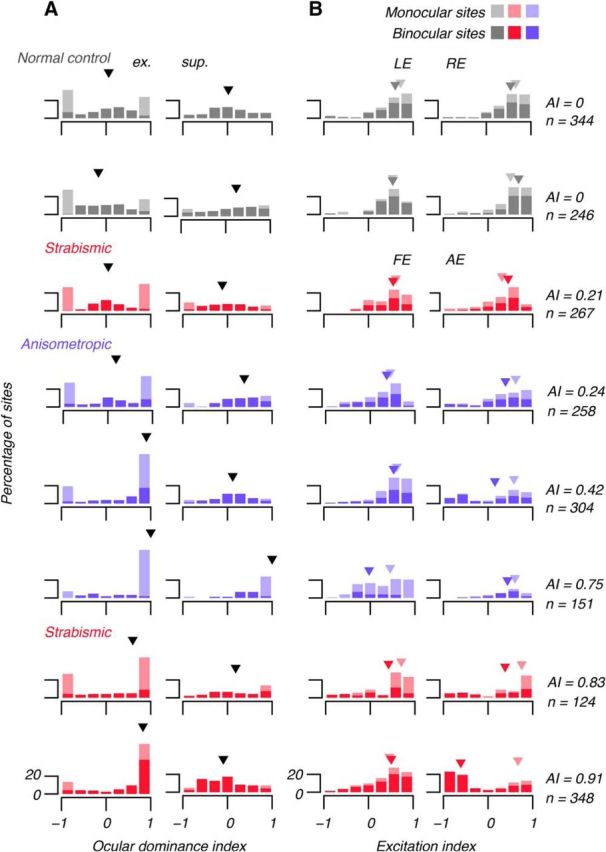
Histograms showing all subjects' ODIs and EIs. Left column of A shows ODIe computed using excitatory (ex.) components of RFs (RFs) (e.g., Fig. 6). Right column of A shows ODIs computed using RF suppression (sup.). In severe amblyopia, ODIe tended to 1, indicating FE domination. There was no systematic effect on ODIs (arrowheads show medians). Left column of B shows EI in left (normal eyes) and FE (AE). Right column of B shows EI in REs and AEs. Dark arrowheads show medians of binocular sites and light arrowheads show medians of monocular sites. There was little systematic effect of amblyopia on EI in FEs; there excitation tended to outweigh suppression (EI > 0), but amblyopia altered RF composition in the AE: at binocular sites in the AE, RF suppression outweighed excitation (EI tended to −1). Stimulation of the AE suppressed binocular cortex.
To quantify the balance of excitation and suppression, we computed an EI for all modeled RFs. Figure 7B shows distributions of the EI separately for fields in the LEs and REs of normals and the FE and AEs of amblyopes. In normal subjects' left and RE fields, excitation outweighed suppression; the median EI for binocular and monocular fields was ∼0.5, indicative of fields comprising an excitatory center and a moderately suppressive surround. By this measure (EI), FE RFs of amblyopes were mostly indistinguishable from RFs in normal eyes. However, in binocular cortex, as amblyopia severity increased, distributions of the EI shifted toward −1, indicative of fields in which suppression outweighed excitation.
Dichoptic stimulation revealed something unexpected: after pooling excitation and suppression, there was no overall reduction of binocularity in amblyopia. Instead, the fraction of binocular sites excited by both eyes decreased, whereas the fraction of binocular sites excited by the FE and suppressed by the AE increased. This is exemplified by the most severely amblyopic subject's distributions in Figure 7 (bottom row). For each subject, we calculated the percentage of binocular sites (considering both excitation and suppression). We found no decrease in the percentage of binocular sites with amblyopia severity (from least to most severely amblyopic: 53%, 52%, 34%, 40%, 40%, 18%, 34%, 67%). This effect is readily overlooked when measuring the responses of single units to monocular stimuli presented sequentially.
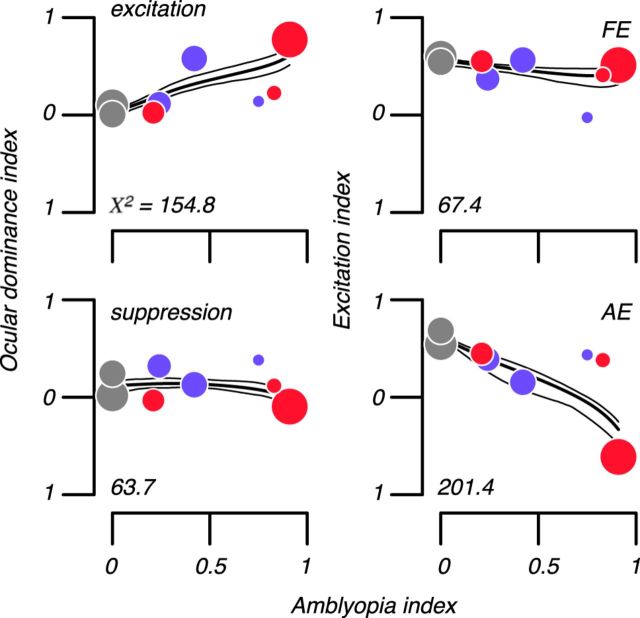
In the visual cortex of amblyopes, the distributions of ODIs and EIs were very different from normal. The top left panel of Figure 8 shows median ODIe of binocular sites in our six amblyopes and two control subjects. Symbol sizes are proportional to the number of binocular sites encountered in each animal. Excitation in the FE dominated AE excitation to a degree associated with amblyopia severity (χ2 = 154.8; p ≪ 0.05), but the prevalence of suppression was largely unaffected by amblyopia (bottom, left). The top right panel of Figure 8 shows median EI of binocular sites in six amblyopes' FEs and control subjects' LEs. Amblyopes' FEs were similar to control eyes in that excitation dominated suppression. However, in AEs, suppression dominated excitation (bottom, right) to a degree associated with amblyopia severity (Kruskal–Wallis rank sum statistic, X2 = 201.4; p ≪ 0.05).
Figure 8.
Altered balance of excitation and suppression in binocular cortex. Top left scatterplot shows median ODI of binocular site excitation in our six amblyopes and two control subjects. Excitation in the FE dominated AE excitation in amounts associated with amblyopia severity (χ2 = 154.8; p ≪ 0.05), but the prevalence of suppression was largely unaffected by amblyopia (bottom, left). Top, right scatterplot shows median EI of binocular sites in six amblyopes' Fes and control subjects' LEs. Symbol size is proportional to number of binocular sites. Amblyopes' FEs were similar to control eyes in that excitation dominated suppression. However, in AEs, suppression dominated excitation (bottom right) in amounts associated with amblyopia severity (Kruskal–Wallis rank sum statistic, χ2 = 201.4; p ≪ 0.05). Solid lines show the best fitting model-free estimate of the dependence of each index on amblyopia severity (thin lines are 95% confidence intervals via bootstrap). Gray, blue, and red symbols show normal, anisometropic, and strabismic subjects, respectively.
Discussion
Using multielectrode arrays, we recorded multiunit activity in visual cortex of six behaviorally assessed amblyopes and two visually normal controls. We presented large gratings dichoptically and applied independent contrast modulations to each eye. A striking feature of our results was the prevalence of suppression in amblyopic cortex: increasing stimulus contrast in the AE often decreased responses at binocular cortical sites. To elucidate these suppressive interactions, we modeled RFs in both eyes using DoGE.
Much of what is known about binocular interactions in amblyopic cortex follows from the binocular interaction paradigm (Ohzawa and Freeman, 1986). There, dichoptic gratings are presented to binocular neurons and the gratings' relative spatial phase is varied parametrically. Dichoptic responses are then compared with monocular responses. The binocular interaction paradigm has produced two main findings. First, responses in early visual cortex of amblyopic monkeys and strabismic cats exhibit reduced selectivity for relative phase compared with visually normal controls, a likely correlate of stereoscopic vision deficits typically seen in amblyopes (Sengpiel and Blakemore, 1994; Smith et al., 1997; Bi et al., 2011). Second, the proportion of neurons showing binocular suppression (i.e., the response to stimulation of both eyes is less than the sum of the eyes' peak monocular responses) increases with amblyopia severity (Bi et al., 2011). We confirm and extend the latter result. We found an association between the FE's domination of amblyopic cortex and amblyopia severity, but no reduction of binocularity in amblyopia. Modeling revealed that, in severe amblyopes, the fraction of binocular cortical sites excited by both eyes decreased, whereas the fraction excited by FE stimulation and suppressed by AE stimulation increased. Within AE RFs, suppression dominated excitation in proportions associated with amblyopia severity. The prevalence of suppression appeared unaltered; only excitation was reduced.
The binocular interaction paradigm as used in earlier studies is difficult to interpret. Typically, it is assumed that a binocular neuron adds inputs from the eyes and, when the response to stimulation of both eyes is less than the sum of monocular responses, suppression is inferred, though it is unclear which eye is suppressed (Bi et al., 2011). Our approach resolves that quandary. In amblyopia, stimulation of the AE may impart only suppression to a cortical site. Under the binocular interaction paradigm, this binocular site may on the basis of monocular testing appear monocular; therefore, its responses to dichoptic stimulation seem anomalous. To illustrate, consider a site with binocular RFs such as those in Figure 6C. Under the binocular interaction paradigm, monocular testing would show strict monocularity, but dichoptic testing would reveal suppression. Our model resolves this anomaly. When the FE was tested monocularly, this site's response was driven by both contrast in the FE (where the EI > 0) and its absence in the AE (where EI < 0). When the AE was tested, the FE provided no drive and the AE's drive was approximately equal to zero because excitation is mostly absent from the eye's RF.
The suppressive effect on binocular cortex of nondominant eye stimulation has been previously observed in the strabismic cat and in human observers with stereoscopic deficits (Sengpiel and Blakemore, 1994; Sengpiel et al., 1994; Norcia et al., 2000). Those studies indicated that suppression depends on stimulus timing and form. In strabismic cat cortex, the ongoing response to dominant eye stimulation can be suppressed by the introduction of a stimulus to the nondominant eye. There, nondominant eye stimuli both parallel and orthogonal to the dominant eye stimulus cause suppression; in normal cat cortex, the suppressive effect of a parallel stimulus appears to be masked by normal binocular facilitation. In stereodeficient human observers, the fusibility of stimuli in the two eyes may be critically important. Norcia et al. (2000) showed that visual evoked responses to stimulation of the dominant eye were suppressed by the introduction of a parallel, but not an orthogonal, stimulus in the nondominant eye.
It can be difficult to differentiate the multiple sources of suppression in cortex. In particular, in the present study, we equalized the time-averaged contrast of stimuli appearing in each eye specifically to minimize any effects of binocular contrast gain control (Truchard et al., 2000). This allowed us to model RF organization at each cortical site using linear methods; that is, by DoGE. We have used a monocular variant of this approach successfully to model the influences of extraclassical subregions on single-unit responses (Tanaka and Ohzawa, 2009; Hallum and Movshon, 2014). There, we reasoned that our model captured a “near” component of surround suppression (Angelucci et al., 2002) that is sensitive to moderate contrasts, orientation tuned, and likely depends on both subcortical and local, intracortical circuits—the same circuits likely to be engaged in the suppression reported in the present study. Binocular contrast gain control, a second source of suppressive binocular interactions in cortex, adjusts neuronal responsiveness to prevailing contrast in the two eyes, enabling operation within a dynamic range. In separate experiments, to be described in a subsequent report, we probed binocular gain control in the same neural populations reported in this study, allowing the identification of multiple forms of suppression (Shooner et al., 2017).
In our visually normal controls, few cortical sites were excited by one eye but suppressed by the other. In amblyopes, many sites had this character. This pattern of suppression in normal controls is not unexpected because, in normal binocular viewing, objects both near to and far from the fixation point (i.e., objects off the visual horopter) give rise to uncoupled luminance, contrast, and form signals in corresponding retinal locations (Sengpiel and Blakemore, 1994). Nevertheless, diplopia is not experienced in normal vision, presumably because of suppressive binocular interactions in cortex such as those we report here. In psychophysical experiments, normal subjects have been shown to undergo interocular suppression (Freeman and Jolly, 1994). In amblyopes, suppressive response fields in the AE were often small (Fig. 6C,D). This presumably permits suppression to operate “regionally,” producing small, circumscribed scotomas and/or abrupt transitions between normal and scotomatous subfields within an eye (Economides et al., 2012).
What cellular mechanisms are likely to create the altered balance of RF excitation and suppression that we report here? In V1 of normal infant monkeys, thalamocortical afferents terminate in layer IV, providing input to long-range horizontal networks of neurons with similar functional properties that are refined over the course of normal development (Hubel et al., 1977; Gilbert and Wiesel, 1989; Malach et al., 1993; Horton and Hocking, 1996; Yoshioka et al., 1996; Kisvárday et al., 1997, 2002). Monocular deprivation during the critical period, an extreme form of abnormal binocular experience that, like strabismus and anisometropia, can lead to amblyopia (Attebo et al., 1998), causes the retraction of both the thalamocortical afferents serving the deprived eye and the dendritic arbors of horizontal connections (Antonini and Stryker, 1993; Trachtenberg and Stryker, 2001) and a reduction of excitatory glutamate receptors (Murphy et al., 2004; Williams et al., 2015). Because both thalamocortical afferents and long-range horizontal connections are central to classical RF formation, their alteration likely caused the attenuation of excitation that we report here. In strabismic cats, GABA-mediated inhibition has been shown to subserve interocular suppression; the GABA-antagonist bicuculline can relieve binocular suppression (Sengpiel et al., 2006). Neurons undergoing binocular suppression exhibit a dissociation between excitatory and inhibitory conductances, specifically, a relative reduction in the former (Scholl et al., 2013), and monocular deprivation of kittens has been shown to leave cortical levels of GAD, the enzyme synthesizing GABA, intact (Bear et al., 1985; but see Hendry and Jones, 1986). These results, like ours, indicate that inhibitory connections between eyes are preserved and that inhibitory mechanisms, in contrast to excitatory ones, are less vulnerable to the influence of abnormal binocular experience during development.
Footnotes
This work was supported by the National Institutes of Health (Grant EY05864 to L.K. and Grant EY22428 to J.A.M., and National Center for Research Resources Grant RR00166 to the Washington National Primate Research Center). We thank Michael Gorman for assistance rearing and behaviorally testing animals, Corey Ziemba for help during experiments, Adam Kohn who helped pilot array recordings in visually normal macaques, and Bob Shapley for comments on the drafted manuscript.
The authors declare no competing financial interests.
References
- Angelucci A, Levitt JB, Lund JS (2002) Anatomical origins of the classical receptive field and modulatory surround field of single neurons in macaque visual cortical area V1. Prog Brain Res 136:373–388. 10.1016/S0079-6123(02)36031-X [DOI] [PubMed] [Google Scholar]
- Antonini A, Stryker MP (1993) Rapid remodeling of axonal arbors in the visual cortex. Science 260:1819–1821. 10.1126/science.8511592 [DOI] [PubMed] [Google Scholar]
- Attebo K, Mitchell P, Cumming R, Smith W, Jolly N, Sparkes R (1998) Prevalence and causes of amblyopia in an adult population. Ophthalmology 105:154–159. 10.1016/S0161-6420(98)91862-0 [DOI] [PubMed] [Google Scholar]
- Bear MF, Schmechel DE, Ebner FF (1985) Glutamic acid decarboxylase in the striate cortex of normal and monocularly deprived kittens. J Neurosci 5:1262–1275. [DOI] [PMC free article] [PubMed] [Google Scholar]
- Bi H, Zhang B, Tao X, Harwerth RS, Smith EL 3rd, Chino YM (2011) Neuronal responses in visual area V2 (V2) of macaque monkeys with strabismic amblyopia. Cereb Cortex 21:2033–2045. 10.1093/cercor/bhq272 [DOI] [PMC free article] [PubMed] [Google Scholar]
- Cavanaugh JR, Bair W, Movshon JA (2002a) Nature and interaction of signals from the receptive field center and surround in macaque V1 neurons. J Neurophysiol 88:2530–2546. 10.1152/jn.00692.2001 [DOI] [PubMed] [Google Scholar]
- Cavanaugh JR, Bair W, Movshon JA (2002b) Selectivity and spatial distribution of signals from the receptive field surround in macaque V1 neurons. J Neurophysiol 88:2547–2556. 10.1152/jn.00693.2001 [DOI] [PubMed] [Google Scholar]
- Chua B, Mitchell P (2004) Consequences of amblyopia on education, occupation, and long term vision loss. Br J Ophthalmol 88:1119–1121. 10.1136/bjo.2004.041863 [DOI] [PMC free article] [PubMed] [Google Scholar]
- Cleary M, Moody AD, Buchanan A, Stewart H, Dutton GN (2009) Assessment of a computer-based treatment for older amblyopes: the Glasgow Pilot Study. Eye 23:124–131. 10.1038/sj.eye.6702977 [DOI] [PubMed] [Google Scholar]
- Crawford ML, Harwerth RS, Smith EL, von Noorden GK (1993) Keeping an eye on the brain: the role of visual experience in monkeys and children. Journal of General Psychology 120:7–19. 10.1080/00221309.1993.9917858 [DOI] [PubMed] [Google Scholar]
- Economides JR, Adams DL, Horton JC (2012) Perception via the deviated eye in strabismus. J Neurosci 32:10286–10295. 10.1523/JNEUROSCI.1435-12.2012 [DOI] [PMC free article] [PubMed] [Google Scholar]
- Enroth-Cugell C, Robson JG (1966) The contrast sensitivity of retinal ganglion cells of the cat. J Physiol 187:517–552. 10.1113/jphysiol.1966.sp008107 [DOI] [PMC free article] [PubMed] [Google Scholar]
- Freeman AW, Jolly N (1994) Visual loss during interocular suppression in normal and strabismic subjects. Vision Res 34:2043–2050. 10.1016/0042-6989(94)90032-9 [DOI] [PubMed] [Google Scholar]
- Freeman AW, Nguyen VA, Jolly N (1996) Components of visual acuity loss in strabismus. Vision Res 36:765–774. 10.1016/0042-6989(95)00171-9 [DOI] [PubMed] [Google Scholar]
- Gilbert CD, Wiesel TN (1989) Columnar specificity of intrinsic horizontal and corticocortical connections in cat visual cortex. J Neurosci 9:2432–2442. [DOI] [PMC free article] [PubMed] [Google Scholar]
- Hallum LE, Movshon JA (2014) Surround suppression supports second-order feature encoding by macaque V1 and V2 neurons. Vision Res 104:24–35. 10.1016/j.visres.2014.10.004 [DOI] [PMC free article] [PubMed] [Google Scholar]
- Hendry SH, Jones EG (1986) Reduction in number of immunostained GABAergic neurones in deprived-eye dominance columns of monkey area 17. Nature 320:750–753. 10.1038/320750a0 [DOI] [PubMed] [Google Scholar]
- Henry CA, Joshi S, Xing D, Shapley RM, Hawken MJ (2013) Functional characterization of the extraclassical receptive field in macaque V1: contrast, orientation, and temporal dynamics. J Neurosci 33:6230–6242. 10.1523/JNEUROSCI.4155-12.2013 [DOI] [PMC free article] [PubMed] [Google Scholar]
- Hess RF, Mansouri B, Thompson B (2010) A new binocular approach to the treatment of amblyopia in adults well beyond the critical period of visual development. Restor Neurol Neurosci 28:793–802. 10.3233/RNN-2010-0550 [DOI] [PubMed] [Google Scholar]
- Horton JC, Hocking DR (1996) An adult-like pattern of ocular dominance columns in striate cortex of newborn monkeys prior to visual experience. J Neurosci 16:1791–1807. [DOI] [PMC free article] [PubMed] [Google Scholar]
- Hubel DH, Wiesel TN, LeVay S (1977) Plasticity of ocular dominance columns in monkey striate cortex. Philos Trans R Soc Lond B Biol Sci 278:377–409. 10.1098/rstb.1977.0050 [DOI] [PubMed] [Google Scholar]
- Kilwinger S, Spekreijse H, Simonsz HJ (2002) Strabismic suppression depends on the amount of dissimilarity between left-and right-eye images. Vision Res 42:2005–2011. 10.1016/S0042-6989(02)00095-0 [DOI] [PubMed] [Google Scholar]
- Kiorpes L, Kiper DC, Movshon JA (1993) Contrast sensitivity and vernier acuity in amblyopic monkeys. Vision Res 33:2301–2311. 10.1016/0042-6989(93)90107-8 [DOI] [PubMed] [Google Scholar]
- Kiorpes L, Kiper DC, O'Keefe LP, Cavanaugh JR, Movshon JA (1998) Neuronal correlates of amblyopia in the visual cortex of macaque monkeys with experimental strabismus and anisometropia. J Neurosci 18:6411–6424. [DOI] [PMC free article] [PubMed] [Google Scholar]
- Kiorpes L, Tang C, Movshon JA (1999) Factors limiting contrast sensitivity in experimentally amblyopic macaque monkeys. Vision Res 39:4152–4160. 10.1016/S0042-6989(99)00130-3 [DOI] [PubMed] [Google Scholar]
- Kisvárday ZF, Tóth E, Rausch M, Eysel UT (1997) Orientation-specific relationship between populations of excitatory and inhibitory lateral connections in the visual cortex of the cat. Cereb Cortex 7:605–618. 10.1093/cercor/7.7.605 [DOI] [PubMed] [Google Scholar]
- Kisvárday ZF, Ferecskó AS, Kovács K, Buzás P, Budd JM, Eysel UT (2002) One axon-multiple functions: specificity of lateral inhibitory connections by large basket cells. J Neurocytol 31:255–264. 10.1023/A:1024122009448 [DOI] [PubMed] [Google Scholar]
- Knox PJ, Simmers AJ, Gray LS, Cleary M (2012) An exploratory study: prolonged periods of binocular stimulation can provide an effective treatment for childhood amblyopia. Invest Ophthalmol Vis Sci 53:817–824. 10.1167/iovs.11-8219 [DOI] [PubMed] [Google Scholar]
- Kumagami T, Zhang B, Smith EL 3rd, Chino YM (2000) Effect of onset age of strabismus on the binocular responses of neurons in the monkey visual cortex. Invest Ophthalmol Vis Sci 41:948–954. [PubMed] [Google Scholar]
- Levi DM. (2013) Linking assumptions in amblyopia. Vis Neurosci 30:277–287. 10.1017/S0952523813000023 [DOI] [PMC free article] [PubMed] [Google Scholar]
- Levitt JB, Lund JS (2002) The spatial extent over which neurons in macaque striate cortex pool visual signals. Vis Neurosci 19:439–452. 10.1017/S0952523802194065 [DOI] [PubMed] [Google Scholar]
- Li J, Thompson B, Lam CS, Deng D, Chan LY, Maehara G, Woo GC, Yu M, Hess RF (2011) The role of suppression in amblyopia. Invest Ophthalmol Vis Sci 52:4169–4176. 10.1167/iovs.11-7233 [DOI] [PubMed] [Google Scholar]
- Li J, Hess RF, Chan LY, Deng D, Yang X, Chen X, Yu M, Thompson B (2013a) Quantitative measurement of interocular suppression in anisometropic amblyopia: a case-control study. Ophthalmology 120:1672–1680. 10.1016/j.ophtha.2013.01.048 [DOI] [PubMed] [Google Scholar]
- Li J, Thompson B, Deng D, Chan LY, Yu M, Hess RF (2013b) Dichoptic training enables the adult amblyopic brain to learn. Curr Biol 23:R308–R309. 10.1016/j.cub.2013.01.059 [DOI] [PubMed] [Google Scholar]
- Malach R, Amir Y, Harel M, Grinvald A (1993) Relationship between intrinsic connections and functional architecture revealed by optical imaging and in vivo targeted biocytin injections in primate striate cortex. Proc Natl Acad Sci U S A 90:10469–10473. 10.1073/pnas.90.22.10469 [DOI] [PMC free article] [PubMed] [Google Scholar]
- Mori T, Matsuura K, Zhang B, Smith EL 3rd, Chino YM (2002) Effects of the duration of early strabismus on the binocular responses of neurons in the monkey visual cortex (V1). Invest Ophthalmol Vis Sci 43:1262–1269. [PubMed] [Google Scholar]
- Movshon JA, Lennie P (1979) Pattern-selective adaptation in visual cortical neurones. Nature 278:850–852. 10.1038/278850a0 [DOI] [PubMed] [Google Scholar]
- Movshon JA, Eggers HM, Gizzi MS, Hendrickson AE, Kiorpes L, Boothe RG (1987) Effects of early unilateral blur on the macaque's visual system. III. Physiological observations. J Neurosci 7:1340–1351. [DOI] [PMC free article] [PubMed] [Google Scholar]
- Murphy KM, Duffy KR, Jones DG (2004) Experience-dependent changes in NMDAR1 expression in the visual cortex of an animal model for amblyopia. Vis Neurosci 21:653–670. 10.1017/S0952523804214146 [DOI] [PubMed] [Google Scholar]
- Norcia AM, Harrad RA, Brown RJ (2000) Changes in cortical activity during suppression in stereoblindness. Neuroreport 11:1007–1012. 10.1097/00001756-200004070-00022 [DOI] [PubMed] [Google Scholar]
- Ohzawa I, Freeman RD (1986) The binocular organization of simple cells in the cat's visual cortex. J Neurophysiol 56:221–242. [DOI] [PubMed] [Google Scholar]
- Ooi TL, Su YR, Natale DM, He ZJ (2013) A push-pull treatment for strengthening the ‘lazy eye’ in amblyopia. Curr Biol 23:R309–R310. 10.1016/j.cub.2013.03.004 [DOI] [PMC free article] [PubMed] [Google Scholar]
- Rodieck RW, Stone J (1965) Analysis of receptive fields of cat retinal ganglion cells. J Neurophysiol 28:832–849. [DOI] [PubMed] [Google Scholar]
- Sceniak MP, Ringach DL, Hawken MJ, Shapley R (1999) Contrast's effect on spatial summation by macaque V1 neurons. Nat Neurosci 2:733–739. 10.1038/11197 [DOI] [PubMed] [Google Scholar]
- Sceniak MP, Hawken MJ, Shapley R (2001) Visual spatial characterization of macaque V1 neurons. J Neurophysiol 85:1873–1887. [DOI] [PubMed] [Google Scholar]
- Scholl B, Tan AY, Priebe NJ (2013) Strabismus disrupts binocular synaptic integration in primary visual cortex. J Neurosci 33:17108–17122. 10.1523/JNEUROSCI.1831-13.2013 [DOI] [PMC free article] [PubMed] [Google Scholar]
- Schor CM. (1977) Visual stimuli for strabismic suppression. Perception 6:583–593. 10.1068/p060583 [DOI] [PubMed] [Google Scholar]
- Sclar G, Lennie P, DePriest DD (1989) Contrast adaptation in striate cortex of macaque. Vision Res 29:747–755. 10.1016/0042-6989(89)90087-4 [DOI] [PubMed] [Google Scholar]
- Sengpiel F, Blakemore C (1994) Interocular control of neuronal responsiveness in cat visual cortex. Nature 368:847–850. 10.1038/368847a0 [DOI] [PubMed] [Google Scholar]
- Sengpiel F, Jirmann KU, Vorobyov V, Eysel UT (2006) Strabismic suppression is mediated by inhibitory interactions in the primary visual cortex. Cereb Cortex 16:1750–1758. [DOI] [PubMed] [Google Scholar]
- Shooner C, Hallum LE, Kumbhani RD, Ziemba CM, Garcia-Marin V, Kelly JG, Majaj NJ, Movshon JA, Kiorpes L (2015) Population representation of visual information in areas V1 and V2 of amblyopic macaques. Vision Res 114:56–67. 10.1016/j.visres.2015.01.012 [DOI] [PMC free article] [PubMed] [Google Scholar]
- Shooner C, Hallum LE, Kumbhani RD, Garcia-Marin V, Kelly JG, Majaj NJ, Movshon JA, Kiorpes L (2017) Asymmetric dichoptic masking in visual cortex of amblyopic macaque monkeys. J Neurosci, in press. [DOI] [PMC free article] [PubMed] [Google Scholar]
- Shushruth S, Nurminen L, Bijanzadeh M, Ichida JM, Vanni S, Angelucci A (2013) Different orientation tuning of near-and far-surround suppression in macaque primary visual cortex mirrors their tuning in human perception. J Neurosci 33:106–119. 10.1523/JNEUROSCI.2518-12.2013 [DOI] [PMC free article] [PubMed] [Google Scholar]
- Sireteanu R, Fronius M (1981) Naso-temporal asymmetries in human amblyopia: consequence of long-term interocular suppression. Vision Res 21:1055–1063. 10.1016/0042-6989(81)90010-9 [DOI] [PubMed] [Google Scholar]
- Sireteanu R, Fronius M, Singer W (1981) Binocular interaction in the peripheral visual field of humans with strabismic and anisometropic amblyopia. Vision Res 21:1065–1074. 10.1016/0042-6989(81)90011-0 [DOI] [PubMed] [Google Scholar]
- Smith EL 3rd, Chino YM, Ni J, Cheng H, Crawford ML, Harwerth RS (1997) Residual binocular interactions in the striate cortex of monkeys reared with abnormal binocular vision. J Neurophysiol 78:1353–1362. [DOI] [PubMed] [Google Scholar]
- Tanaka H, Ohzawa I (2009) Surround suppression of V1 neurons mediates orientation-based representation of high-order visual features. J Neurophysiol 101:1444–1462. 10.1152/jn.90749.2008 [DOI] [PubMed] [Google Scholar]
- Trachtenberg JT, Stryker MP (2001) Rapid anatomical plasticity of horizontal connections in the developing visual cortex. J Neurosci 21:3476–3482. [DOI] [PMC free article] [PubMed] [Google Scholar]
- Truchard AM, Ohzawa I, Freeman RD (2000) Contrast gain control in the visual cortex: monocular versus binocular mechanisms. J Neurosci 20:3017–3032. [DOI] [PMC free article] [PubMed] [Google Scholar]
- von Noorden GK, Campos EC (2002) Binocular vision and ocular motility. St. Louis: Mosby. [Google Scholar]
- Williams K, Balsor JL, Beshara S, Beston BR, Jones DG, Murphy KM (2015) Experience-dependent central vision deficits: Neurobiology and visual acuity. Vision Res 114:68–78. 10.1016/j.visres.2015.01.021 [DOI] [PubMed] [Google Scholar]
- Yoshioka T, Blasdel GG, Levitt JB, Lund JS (1996) Relation between patterns of intrinsic lateral connectivity, ocular dominance, and cytochrome oxidase-reactive regions in macaque monkey striate cortex. Cereb Cortex 6:297–310. 10.1093/cercor/6.2.297 [DOI] [PubMed] [Google Scholar]


