

Abstract
The prognostic value of miR-17-92 cluster high-expression in various tumors remains controversial. Therefore, we conducted this meta-analysis by searching literatures in PubMed, Embase, Cochrane Library, China Biology Medicine disc, China National Knowledge Infrastructure to identify eligible studies. Eventually, we analyzed 36 articles that examined 17 tumor types from 4965 patients. Consequently, high-expression of miR-17-92 cluster in various tumors was associated with unfavorable overall survival in both univariate (HR = 2.05, 95%CI: 1.58–2.65, P<0.001) and multivariate (HR = 2.14, 95%CI: 1.75–2.61, P<0.001) analyses. Likewise, similar results were found in different subgroups of country, test method, miR-17-92 cluster component, sample source and size. Additionally, high-expression of miR-17-92 cluster was linked with poor disease-free survival (Univariate: HR = 1.96, 95%CI: 1.55–2.48, P<0.001; Multivariate: HR = 2.18, 95%CI: 1.63–2.91, P<0.001), favorable progression-free survival (Univariate: HR = 0.36, 95%CI: 0.16–0.80, P = 0.012; Multivariate: HR = 1.55, 95%CI: 0.79–3.05, P = 0.201) and poor cancer specific survival in univariate rather than multivariate analyses (Univariate: HR = 1.77, 95%CI: 1.21–2.60, P = 0.004; Multivariate: HR = 1.77, 95%CI: 0.80–3.92, P = 0.160). However, no association of miR-17-92 cluster high-expression was detected with recurrence or relapse-free survival. In summary, this meta-analysis towards high-expression of miR-17-92 cluster has indicated poor prognosis of various cancers. Notably, future studies comprising large cohort size from multicenter are required to confirm our conclusions.
Introduction
MircoRNAs (miRNAs) are small and single-stranded noncoding RNAs consist of approximately 18–22 evolutionarily conserved nucleotides in length. By binding complementary sequences in the 3′ untranslated region (3′-UTR) of mRNAs, miRNAs either mediate translational suppression or direct mRNAs degradation. Consequently, the mRNAs translation repression or destabilization will lead to down-regulated expression of the encoded proteins1, 2. Meanwhile, as more than half of the sequences encoding miRNAs are located in tumor-associated genomic regions or fragile sites and accumulated evidence has revealed that miRNAs may participate in various cancer-related biological processes including apoptosis, differentiation, proliferation, stress response and metabolism3–5, it is widely-accepted that deregulated expression of miRNAs might be used as a novel kind of biomarkers for early cancer diagnosis or prognosis prediction6.
The miR-17-92 cluster is a typical and most extensively studied example of miRNAs, which located at chromosomal locus 13q31.3 and encoded the miR-17, miR-18a, miR-19a/b, miR-20a, and miR-92a. Recent studies have reported that miR-17-92 cluster was frequently overexpressed in various cancer types, and played critically suppresive role in degradation or inhibition of its target genes7–9. Despite the miR-17-92 cluster has shown great potential in prediction of cancer prognosis, the concretely prognostic value of highly-expressed miR-17-92 cluster in various cancer types remains controversial. However, meta-analysis can explore the authentic and comprehensive results through incorporating all available evidences to get a relatively precise and accurate estimation using statistical software10. Thus, we conduct a meta-analysis to assess the possible correlations between high-expression of miR-17-92 cluster with cancer prognosis, which efforts may hold great promise in exploring some novel potential biomarkers for monitoring therapeutic efficacy and prognosis of various cancers.
Methods
Ethics statement
The PRISMA statement was used to performed the current meta-analysis11. No patient’s privacy or clinical samples were involved in this study, hence the ethical approval was not required.
Search strategy
Literature resources including PubMed, Cochrane Library, Embase, CBM and CNKI were searched for eligible literatures, using the terms (“microRNA OR miRNA OR miR-17 OR miR-18 OR miR-19 OR miR-20 OR miR-92 OR miR-17-92 cluster”), (“survival OR prognosis OR prognostic”) and (“cancer OR tumor OR tumour OR neoplasm OR neoplasma OR neoplasia OR carcinoma OR cancers OR tumors OR tumours OR neoplasms OR neoplasmas OR neoplasias OR carcinomas”). Last search of current investigation was updated on November 25, 2016. Additionally, the publication language was only limited to English and Chinese. In case of omission, we identified the reference lists of the relevant articles and review articles to seek for the potentially relevant studies. We did not contract the corresponding authors if the relevant data were unavailable.
Inclusion and exclusion criteria
Studies met the following criteria could be identified: (1) clinical study about the association of high-expression of miR-17-92 cluster with cancer prognostic value; (2) relevant available data of the hazard ratio (HRs) and their corresponding 95% confidence interval (CIs) to evaluate its associations could be obtained; (3) patients prognostic outcomes including overall survival (OS), cancer-specific survival (CSS), relapse-free survival (RFS), progression-free sur-vival (PFS), disease-free survival (DFS). Studies met the following four criteria were excluded: (1) the available data regarding about associations were absent; (2) similar or duplicate study (when the same or similar cohort was applied, after careful examination, the most complete information was included); (3) other types of articles including reviews or abstracts; (4) studies were involved with cells lines or animal models.
Data extraction
Based on the inclusion and exclusion criteria, we extracted the relevant information from each eligible publication. If disagreements were noticed, we are clearly open to discussion by each other (Kaiping Zhang and Li Zhang), or reviewed by a third author (Min Chao). The data on first author, publication year, study country, age, cancer type, stage range, miRNAs category, sample source, follow-up time, test method, sample size, survival outcome, analysis method, HR and 95%CI and the cut-off value were extracted. We have not contacted any author of the original researches even though the essential information could not be available. Besides, study country came from China and others. Sample source was stratified into tissue, blood, formalin-fixed and paraffin-embedded (FFPE) and tissue microarray (TMA). Test method included immunohistochemistry (IHC), in situ hybridization (ISH) and reverse transcription-polymerase chain reaction (RT-PCR); sample sizes were separated into ≥100 and <100 and cancer types included solid cancer and others. Analysis methods were divided into univariate analysis and multivariate analysis.
Statistical analysis
We explored the association of high-expression of miR-17-92 cluster with cancer prognostic value by applying Review Manager software (RevMan 5, The Cochrane Collaboration, Oxford, UK) and STATA software (Version 12.0, Stata Corpotation, College Station, TX). HR and 95% CI were collected for assessing the prognostic value of highly-expressed miR-17-92 cluster in various cancers. Meanwhile, the heterogeneity has been assessed via chi-square-based Q and I2 test across studies (no heterogeneity I2<25%, moderate heterogeneity I2 = 25–50%, extreme heterogeneity I2 > 50%)12. In case of extreme heterogeneity (I2 > 50% or P < 0.01 for Q test), we used random-effects (DerSimonian and Laird method) model13. Otherwise, fixed-effects (Mantel-Haenszel method) model was introduced14. One-way sensitivity analyses individually removed publications in meta-analysis were conducted to assess results’ stability. It mainly explored the impact of specific study upon mixed HR. The Begg’s funnel plot was performed to evaluated the publication bias. P value less than 0.05 indicated that there was a bias of study15. Additionally, different subgroups consisted of country, test method, sample source, miR-17-92 component, sample size and cancer type were conducted.
Results
Characteristics of the studies
As a result, 36 studies consisted of 4965 samples satisfied the eligible studies16–51 (Fig. 1). The principal characteristics of the included studies were summarized in Table 1. Of these studies, Li’s18 study was involved with two different cohorts of Tianjin cohort and Xiangya cohort. Wu et al.27 designed a multiphase study to identify tissue and serum miRNAs expression, respectively. Fang et al.30 studied miRNAs expression profiles in colorectal cancer (CRC) patients, comparing chemoresistant and chemosensitive groups. Patients were randomly divided into the training set, internal testing set and independent validation set to search for prognostic value of highly-expressed miR-17-92 cluster in stage II colon cancer by Zhang et al.31. Ma et al.43 conducted a study to detect the prognostic value of high-expression of miR-17-5p in CRC using RT-PCR and ISH methods. The expression of miRNAs was measured by RT-PCR in tissues from non small cell lung cancer (NSCLC) patients that originated from Maryland, Norway and Japan by Saito et al.46. As mentioned above, we enrolled them independently into meta-analysis. Eventually, this meta-analysis was established based on 44 studies (Table 2).
Figure 1.
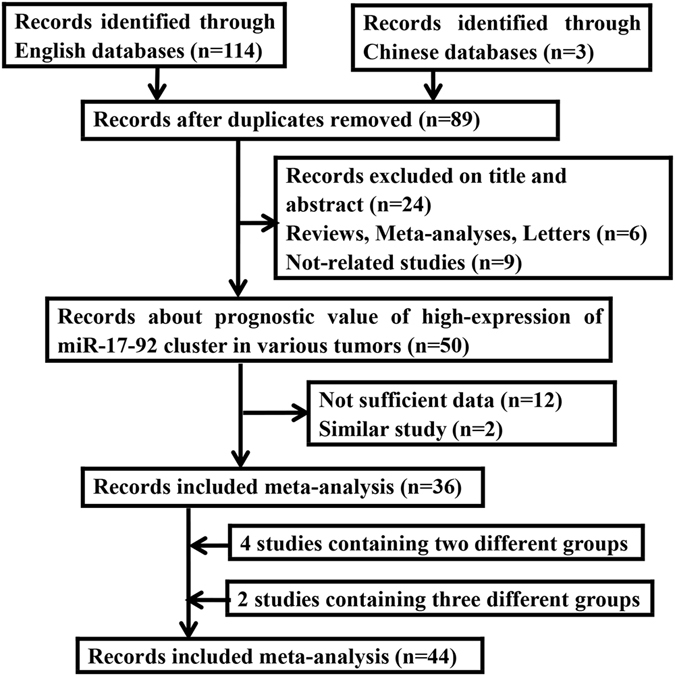
Flow diagram of the study selection process in the meta-analysis.
Table 1.
Main characteristics of the eligible studies.
| First author | Year | Country | Age, Median (range) | Cancer type | Stage range | MicroRNA | Sample size | Follow-up, Median (range) | Outcome |
|---|---|---|---|---|---|---|---|---|---|
| Robaina, M.C.16 | 2016 | Brazil | 7.4 (2–18) | BL | I–IV | miR-17 | 39 | 38.5 (1–69) | OS |
| Ren, C.17 | 2016 | China | NA | GC | I–IV | miR-92a | 180 | 85.2 (79.2–97.2) | OS |
| Li, X.G.18 | 2016 | China | 43 (13–72) | GBM | I–IV | miR-17 | 108 | NA | OS |
| Chen, Y.J.19 | 2015 | China | NA | GC | I–III | miR-18a | 90 | NA | OS |
| Xi, Y.F.20 | 2015 | China | 18 (3–73) | T-LBL | I–IV | miR-17, miR-19 | 57 | NA (1–156) | OS |
| Su, X.P.21 | 2015 | China | NA | HCC | I–IV | miR-92a | 90 | NA | OS |
| Li, J.22 | 2015 | China | 58.7 (NA)* 56.6 (NA)** | CRC | II–III | miR-17-3p | 175 | 36 (33.0–38.1)* 32 (27.5–35.0)** | DFS |
| Hao, M.23 | 2015 | China | 57.5 (33–83) | MM | I–III | miR-19a | 108 | 13.5 (NA) | OS/DFS |
| Ge, Y.Z.24 | 2015 | China | 49.5 (42–62) | RCC | I–IV | miR-19a | 58 | 63.4 (31.5–86.1) | RFS |
| Guo, Y.H.25 | 2015 | China | NA | HCC | I–IV | miR-19 | 51 | NA | OS |
| Xu, X.L.26 | 2014 | China | 63 (45–81) | ESCC | I–IV | miR-17/miR-18a/miR-19a | 105 | 34.5 (0.89–52.0) | OS/PFS |
| Wu, C.H.27 | 2014 | China | NA | NSCLC | I–III | miR-19b | 155 | 29.0 (23.0–35.0) | OS |
| Su, Z.X.28 | 2014 | China | 69.0 (NA) | GC | T1–T4 | miR-18a | 82 | 49.8 (NA) | DFS/CSS |
| Lin, H.M.29 | 2014 | Australia | 68 (46–87) | PCa | NA | miR-20a | 97 | 12 (3–62) | OS |
| Fang, L.30 | 2014 | China | 59 (NA) | CRC | I–IV | miR-17-5p | 376 | NA | OS |
| Zhang, J.X.31 | 2013 | China | 65 (NA) | CC | II | miR-20a-5p | 735 | 66 (50–86) | DFS |
| Zhou, T.32 | 2013 | China | NA | CRC | I–IV | miR-92a | 82 | NA | OS |
| Sanfiorenzo, C.33 | 2013 | France | 65 (NA) | NSCLC | I–III | miR-20a-5p | 52 | NA | DFS |
| Mitani, Y.34 | 2013 | USA | NA | ACC | I–IV | miR-17/miR-20a/miR-92a | 30 | NA | OS |
| Liu, G.H.35 | 2013 | China | 57.09 (20–89) | CRC | I–IV | miR-92a | 166 | 36.4 (4–53) | OS |
| Lin, Q.36 | 2013 | China | 58 (NA) | NSCLC | I–III | miR-19a | 201 | 19 (NA) | OS |
| He, H.C.37 | 2013 | China | 59.80 (43- 86) | PCa | T2A–T4 | miR-19a | 104 | NA | RFS |
| Zheng, J.38 | 2012 | China | NA | HCC | I–IV | miR-17-5p | 96 | NA | OS |
| Chen, Q.39 | 2012 | China | NA | LC | III–IV | miR-17-5p | 221 | NA | OS |
| Yu, G.40 | 2012 | China | 63.0 (35–90) | CC | I–IV | miR-17/miR-18a/miR-19a/miR-19b | 48 | 59.5 (5–66) | OS |
| Wang, M.41 | 2012 | China | NA | GC | I–IV | miR-17-5p/miR-20a | 65 | 36 (NA) | OS |
| Nilsson, S.42 | 2012 | Sweden | 65 (NA) | BCa | I–III | miR-92a | 117 | 78 (NA) | RFS |
| Ma, Y.43 | 2012 | China | 69 (30–87) | CRC | I–IV | miR-17-5p | 425 | 45.60 (0.20–88.47)# 44.60 (0.17–86.53)## | OS |
| Chen, L.44 | 2012 | China | 60 (25–74) | HCC | I–IV | miR-17-5p | 120 | 20 (2–46) | OS/DFS |
| Valladares, A.M.45 | 2011 | Spain | 62.5 (45–76) | GIC | I–IV | miR-17 | 33 | 35 (0–90) | OS/PFS |
| Saito, M.46 | 2011 | USA Norway Japan | 63.6 (32–90) 64.4 (37–82) 59.6 (30–76) | NSCLC | I–III | miR-17 | 89/37/191 | NA | CSS/CSS/RFS |
| Marchini, S.47 | 2011 | Italy | 52 (21–82) | EOC | I | miR-20a | 89 | NA | OS/PFS |
| Liu, R.48 | 2011 | China | NA | PC | III–IV | miR-20a | 38 | NA | OS |
| Chen, Z.L.49 | 2010 | China | 60 (43–75) | ESCC | I–III | miR-92a | 65 | 74 (6–102) | OS |
| Yu, J.50 | 2010 | Japan | 65.5 (36–86) | PC | I–IV | miR-17-5p | 80 | NA | OS |
| Díaz, R.51 | 2008 | Spain | 69 (NA) | CC | I–IV | miR-17-5p | 110 | 68 (68–99) | OS/DFS |
NA, Not available; BL, Burkitt lym phoma; GC, Gastric cancer; T-LBL, T-cell lymphoblastic lymphoma; CRC, Colorectal cancer; RCC, Renal cell carcinoma; ESCC, Esophageal squamous cell carcinoma; MM, Multiple myeloma; NSCLC, Non-small cell lung cancer; LC, Lung cancer; CC, Colon cancer; GBM, Glioblastoma; ACC, Adenoid cystic carcinoma; BCa, Breast cancer; HCC, Hepatocellular carcinoma; GIC, Gastrointestinal cancer; EOC, Epithelial ovarian cancer; PC, Pancreatic cancer; PCa, Prostate cancer; OS, Overall survival; DFS, Disease-free survival; PFS, Progression-free survival; RFS, Recurrence or relapse-free survival; CSS, Cancer specific survival; *Tianjin cohort; **Xiangya cohort; #RT–PCR cohort; ##ISH cohort.
Table 2.
miR-17-92 cluster evaluation and survival data of the selected studies.
| First author | Country | Test method | Cancer type | MicroRNA | Sample source | Outcome | HR (95%CI) | Cut-off value |
|---|---|---|---|---|---|---|---|---|
| Robaina, M.C.16 | Brazil | RT-PCR | BL | miR-17 | FFPE | OS | (M)8.945 (2.150–37.212) | Mean |
| Ren, C.17 | China | ISH | GC | miR-92a | FFPE | OS | (U)2.94 (2.01–4.31)/(M)3.34 (1.67–6.70) | >inal score of normal paracancerous tissue |
| Li, X.G.18 | China | RT-PCR | GBM | miR-17 | Tissue | OS | (U)6.2 (1.3–18.6)/(M)5.1 (0.8–15.9) | Mean |
| Chen, Y.J.19 | China | IHC | GC | miR-18a | TMA | OS | (U)5.530 (3.169–9.650)/(M)4.615 (2.601–8.188) | The final scores > 3.0 |
| Xi, Y.F.20 | China | RT-PCR | T-LBL | miR-17/miR-19 | FFPE | OS | (M)4.225 (1.249–14.293)/(M)2.179 (1.069–4.440) | Median |
| Su, X.P.21 | China | ISH | HCC | miR-92a | FFPE | OS | (U)2.49 (1.37–4.51) | >the average modified histochemical score |
| Li, J.-122 | China | RT-PCR | CRC | miR-17-3p | Blood | DFS | (U)3.72 (1.61–8.60)/(M)3.74 (1.34–10.4) | An optimal cut-off value of 1.613 |
| Li, J.-222 | China | RT-PCR | CRC | miR-17-3p | Blood | DFS | (U)3.09 (1.33–7.24)/(M)3.74 (1.34–10.4) | |
| Hao, M.23 | China | RT-PCR | MM | miR-19a | Blood | OS/DFS | (M)2.995 (1.167–7.690)/(M)2.787 (1.421–5.468) | Mean |
| Ge, Y.Z.24 | China | HiSeq | RCC | miR-19a | Tissue | RFS | (U)9.264 (1.157–74.20)/(M)7.057 (0.636–78.31) | Median |
| Guo, Y.H.25 | China | RT-PCR | HCC | miR-19 | Tissue | OS | (U)0.180 (0.069–0.471)/(M)0.091 (0.026–0.322) | Median |
| Xu, X.L.26 | China | RT-PCR | ESCC | miR-17 | Tissue | OS | (M)2.849 (1.258–6.455) | 2-ΔΔCt > 2 as showing that the target miRNAs was of high expression |
| miR-18a | OS/PFS | (M)2.151 (0.990 –4.675)/(M)1.832 (1.044–3.165) | ||||||
| miR-19a | OS/PFS | (M)3.471 (1.110–10.857)/(M)3.317 (1.032–10.650) | ||||||
| Wu, C.H.-127 | China | RT-PCR | NSCLC | miR-19b | Tissue | OS | (U)3.591 (1.564–8.246)/(M)3.466 (1.389–8.650) | Median |
| Wu, C.H.-227 | China | RT-PCR | NSCLC | miR-19b | Blood | OS | (U)2.243 (1.328–3.790)/(M)1.800 (1.008–3.216) | |
| Su, Z.X.28 | China | RT-PCR | GC | miR-18a | Blood | DFS CSS | (U)1.864 (1.074–3.235)/(M)1.464 (0.776–2.776) (U)1.959 (1.022–3.756)/ (M)1.769 (0.798–3.923) | A cut-off value of 4.85 |
| Lin, H.M.29 | Australia | RT-PCR | PCa | miR-20a | Blood | OS | (U)1.8 (1.0–3.3) | Median |
| Fang, L.-130 | China | ISH | CRC | miR-17-5p | TMA | OS | (M)1.900 (1.195–3.022) | >score 7 |
| Fang, L.-230 | China | ISH | CRC | miR-17-5p | TMA | OS | (M)4.062 (1.235–13.355) | |
| Zhang, J.X.-131 | China | RT-PCR | CC | miR-20a-5p | FFPE | DFS | (U)2.10 (0.97–4.54) | Risk score equals 1 |
| Zhang, J.X.-231 | China | RT-PCR | CC | miR-20a-5p | FFPE | DFS | (U)1.69 (0.88–3.26) | |
| Zhang, J.X.-331 | China | RT-PCR | CC | miR-20a-5p | FFPE | DFS | (U)1.85 (1.25–2.73) | |
| Zhou, T.32 | China | RT-PCR | CRC | miR-92a | Tissue | OS | (U)2.947 (1.494–5.813)/(M)2.342 (1.072–5.115) | An average increase of 2.04-fold |
| Sanfiorenzo, C.33 | France | RT-PCR | NSCLC | miR-20a-5p | Blood | DFS | (M)2.881 (1.009–8.227) | Median |
| Mitani, Y.34 | USA | RT-PCR | ACC | miR-17/miR-20a/miR-92a | Tissue | OS | (M)3.65 (1.27–10.5)/(M)3.65 (1.27–10.5)/ (M)3.21 (1.11–9.34) | A cut off of values > 2 |
| Liu, G.H.35 | China | RT-PCR | CRC | miR-92a | Blood | OS | (U)10.19 (4.05–25.65)/(M)4.36 (1.64–11.57) | Mean |
| Lin, Q.36 | China | RT-PCR | NSCLC | miR-19a | Blood | OS | (U)3.042 (2.082–4.444)/(M)1.438 (1.007–2.052) | More than twofold change |
| He, H.C.37 | China | ISH | PCa | miR-19a | Tissue | RFS | (U)0.85 (0.35–1.77) | Mean |
| Zheng, J.38 | China | RT-PCR | HCC | miR-17-5p | Blood | OS | (U)2.373 (1.293–4.356)/(M)2.192 (1.024–4.691) | Median |
| Chen, Q.39 | China | RT-PCR | LC | miR-17-5p | Blood | OS | (U)1.767 (1.039–3.005) | Median |
| Yu, G.40 | China | RT-PCR | CC | miR-17/miR-18a/miR-19a/miR-19b | Tissue | OS | (M)2.67 (1.31–6.82)/(M)1.68 (0.33–3.43)/ (M)0.87 (0.71–4.38)/(M)1.52 (1.09–2.11)/ (M)0.76 (1.51–5.37)/(M)1.42 (1.44–4.00) | Median |
| Wang, M.41 | China | RT-PCR | GC | miR-17-5p miR-20a | Blood | OS | (U)1.785 (1.110–2.870) (U)1.818 (1.321–2.502)/(M)1.576 (1.102–2.253) | Median |
| Nilsson, S.42 | Sweden | ISH | BCa | miR-92a | FFPE | RFS | (U)0.328 (0.138–0.781)/(M)0.375 (0.145–0.972) | Median |
| Ma, Y.-143 | China | RT–PCR | CRC | miR-17-5p | FFPE | OS | (U)1.68 (1.03–2.74)/(M)2.16 (1.20–3.90) | Median (tumour/non-tumour ratio) |
| Ma, Y.-243 | China | ISH | CRC | miR-17-5p | FFPE | OS | (U)2.58 (1.53–4.34)/(M)2.41 (1.40–4.18) | |
| Chen, L.44 | China | RT-PCR | HCC | miR-17-5p | Tissue | OS/DFS | (M)4.96 (1.78–13.82)/(M)1.79 (1.14–2.98) | Median |
| Valladares, A.M.45 | Spain | RT-PCR | GIC | miR-17 | FFPE | OS/PFS | (M)2.62 (1.55–4.49)/(M)2.11 (1.29–3.45) | Mean |
| Saito, M.-146 | USA | RT-PCR | NSCLC | miR-17 | Tissue | CSS | (U)2.00 (1.10–3.61) | Median |
| Saito, M.-246 | Norway | RT-PCR | NSCLC | miR-17 | Tissue | CSS | (U)1.23 (0.56–2.70) | |
| Saito, M.-346 | Japan | RT-PCR | NSCLC | miR-17 | Tissue | RFS | (U)1.37 (0.80–2.37) | |
| Marchini, S.47 | Italy | RT-PCR | EOC | miR-20a | Tissue | OS PFS | (U)0.376 (0·141–1·006)/(M) 0.367 (0·115–1·172) (U)0.356 (0.159–0.801)/(M) 0.392 (0.142–1.080) | Median |
| Liu, R.48 | China | RT-PCR | PC | miR-20a | Blood | OS | (U)0.56 (0.24–1.34)/(M)0.53 (0.17–1.64) | Risk score > 5.95 |
| Chen, Z.L.49 | China | RT-PCR | ESCC | miR-92a | Tissue | OS | (U)2.801 (1.348–5.814)/(M)2.198 (1.030–4.673) | The 75th percentiles of 2-ΔΔCt |
| Yu, J.50 | Japan | RT-PCR | PC | miR-17-5p | FFPE | OS | (U)1.8 (1.0–3.1)/(M)0.9 (0.4–1.7) | The median expression 5.69 |
| Díaz, R.51 | Spain | RT-PCR | CC | miR-17-5p | Tissue | OS/DFS | (U)1.06 (0.47–2.39)/(U)1.13 (0.48–2.68) | The median of 4.35 |
BL, Burkitt lym phoma; GC, Gastric cancer; T-LBL, T-cell lymphoblastic lymphoma; CRC, Colorectal cancer; RCC, Renal cell carcinoma; ESCC, Esophageal squamous cell carcinoma; MM, Multiple myeloma; NSCLC, Non-small cell lung cancer; LC, Lung cancer; CC, Colon cancer; GBM, Glioblastoma; ACC, Adenoid cystic carcinoma; BCa, Breast cancer; HCC, Hepatocellular carcinoma; GIC, Gastrointestinal cancer; EOC, Epithelial ovarian cancer; PC, Pancreatic cancer; PCa, Prostate cancer; IHC, Immunohistochemistry; ISH, In situ hybridization; HiSeq, High-throughput sequencing; RT-PCR, Reverse transcription-polymerase chain reaction; FFPE, Formalin-fixed and paraffin-embedded; TMA, Tissue microarray; OS, Overall survival; DFS, Disease-free survival; PFS, Progression-free survival; RFS, Recurrence or relapse-free survival; CSS, Cancer specific survival; U, Univariate analysis; M, Multivariate analysis; HR, Hazard ratio; CI, Confidence interval.
Of 44 studies, 41 were written in English and 3 were published in Chinese. The sample sizes ranged from 30 to 376. The included tumor types were as follows: 1 burkitt lym phoma (BL), 4 gastric cancer (GC), 1 T-cell lymphoblastic lymphoma (T-LBL), 8 CRC, 1 renal cell carcinoma (RCC), 2 esophageal squamous cell carcinoma (ESCC), 1 multiple myeloma (MM), 7 NSCLC, 5 colon cancer (CC), 1 adenoid cystic carcinoma (ACC), 1 breast cancer (BCa), 4 hepatocellular carcinoma (HCC), 1 gastrointestinal cancer (GIC), 1 epithelial ovarian cancer (EOC), 2 pancreatic cancer (PC), 1 glioblastoma (GBM), 1 lung cancer (LC), 2 prostate cancer (PCa). Meanwhile, 7 ISH, 35 RT-PCR, 1 IHC and 1 HiSeq in test methods were applied. According to the sample source, there were 12 formalin-fixed and paraffin-embedded (FFPE); 16 tissue, 13 blood and 3 tissue microarray (TMA). As for the survival outcomes, 44 eligible studies were divided into 51 datasets: 31 for OS, 3 for PFS, 4 for RFS, 10 for DFS and 3 for CSS. However, the cut-off value for the high-expression of miR-17-92 cluster was inconsistent among these included studies (Table 2).
Meta-analysis of OS
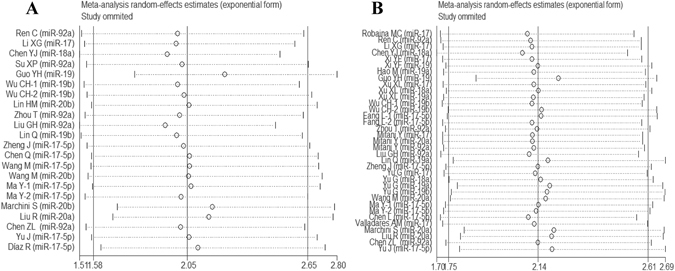
In univariate analysis, 21 studies were involved in current meta-analysis to assess the prognostic value of highly-expressed miR-17-92 cluster in tumors. High-expression of miR-17-92 cluster in various tumors was associated with unfavorable OS (HR = 2.05, 95%CI: 1.58-2.65, P < 0.001) (Fig. 2A). Besides, it seemed that there were certain associations via sub-analyses regarding country, test method, sample source, miR-17-92 component, sample size and cancer type. (Table 3)
Figure 2.
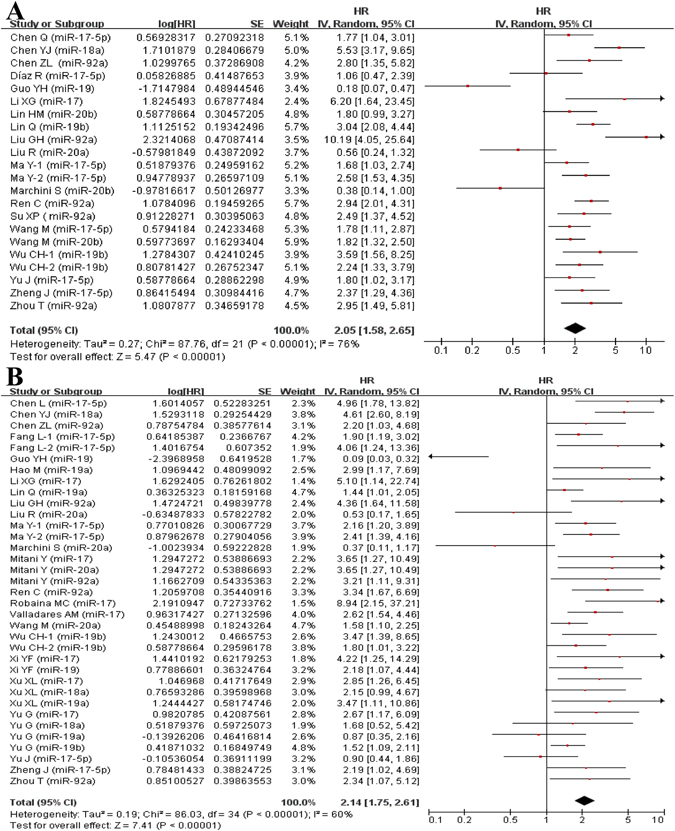
Forest plot of the association between high-expression of miR-17-92 cluster in various tumors and OS under different types of analysis. (A) Univariate analysis; (B) multivariate analysis). The squares and horizontal lines correspond to the study-specific HR and 95% CI. The area of the squares reflects the weight. The diamond represents the summary HR and 95% CI. CI = confidence interval, HR = hazard ratio.
Table 3.
Stratifi ed analysis of the high-expression of miR-17-92 cluster and overall survival.
| No of datasets | HR (95%CI) | P-value | I2 | P h | No of datasets | HR (95%CI) | P-value | I2 | P h | ||
|---|---|---|---|---|---|---|---|---|---|---|---|
| All | 21 | 2.05 (1.58–2.65) | 0.000 | 76.1% | 0.000 | 27 | 2.14 (1.75–2.61) | 0.000 | 60.5% | 0.000 | |
| Country | China | 17 | 2.30 (1.75–3.02) | 0.000 | 75.9% | 0.000 | 22 | 2.13 (1.73–2.63) | 0.000 | 58.2% | 0.000 |
| Others | 4 | 1.18 (0.64–2.16) | 0.602 | 65.6% | 0.033 | 5 | 2.18 (1.12–4.25) | 0.021 | 71.8% | 0.002 | |
| Test method | RT-PCR | 17 | 1.83 (1.36–2.46) | 0.000 | 76.2% | 0.000 | 22 | 2.00 (1.60–2.50) | 0.000 | 60.0% | 0.000 |
| ISH | 3 | 2.74 (2.08–3.60) | 0.000 | 0.0% | 0.869 | 4 | 2.40 (1.77–3.25) | 0.000 | 0.0% | 0.458 | |
| IHC | 1 | 5.53 (3.17–9.65) | 0.000 | / | / | 1 | 4.61 (2.60–8.19) | 0.000 | / | / | |
| Sample source | Tissue | 7 | 1.44 (0.60–3.43) | 0.414 | 85.8% | 0.000 | 10 | 1.98 (1.37–2.88) | 0.000 | 67.0% | 0.000 |
| Blood | 8 | 2.11 (1.53–2.90) | 0.000 | 69.4% | 0.001 | 7 | 1.66 (1.35–2.04) | 0.000 | 42.6% | 0.107 | |
| FFPE | 5 | 2.33 (1.87–2.90) | 0.000 | 3.4% | 0.387 | 7 | 2.35 (1.54–3.00) | 0.000 | 43.1% | 0.091 | |
| TMA | 1 | 5.53 (3.17–9.65) | 0.000 | / | / | 3 | 3.10 (1.58–6.06) | 0.001 | 66.5% | 0.050 | |
| miR-17-92 component | miR-17 | 8 | 1.92 (1.57–2.36) | 0.000 | 3.5% | 0.403 | 14 | 2.41 (1.98–2.94) | 0.000 | 23.1% | 0.204 |
| miR-18 | 1 | 5.53 (3.17–9.65) | 0.000 | / | / | 3 | 3.19 (2.08–4.90) | 0.000 | 46.5% | 0.154 | |
| miR-19 | 4 | 1.55 (0.58–4.11) | 0.380 | 90.1% | 0.000 | 9 | 1.54 (1.01–2.36) | 0.044 | 72.5% | 0.000 | |
| miR-20 | 4 | 1.02 (0.51–2.04) | 0.955 | 79.1% | 0.002 | 4 | 1.01 (0.47–2.60) | 0.827 | 73.9% | 0.009 | |
| miR-92 | 5 | 3.12 (2.41–4.05) | 0.000 | 43.4% | 0.132 | 5 | 2.89 (2.00–4.18) | 0.000 | 0.0% | 0.797 | |
| Sample size | >100 | 10 | 2.60 (1.95–3.47) | 0.000 | 58.6% | 0.010 | 13 | 2.22 (1.87–2.65) | 0.000 | 16.2% | 0.272 |
| <100 | 11 | 1.61 (1.07–2.41) | 0.022 | 81.6% | 0.000 | 14 | 1.80 (1.31–2.48) | 0.000 | 71.4% | 0.000 | |
| Cancer type | Solid cancer | 21 | 2.05 (1.58–2.65) | 0.000 | 76.1% | 0.000 | 24 | 2.04 (1.65–2.52) | 0.000 | 62.2% | 0.000 |
| Others | 0 | / | / | / | / | 3 | 3.10 (1.91–5.03) | 0.000 | 9.6% | 0.345 |
RT-PCR, Reverse transcription-polymerase chain reaction; IHC, Immunohistochemistry; ISH, In situ hybridization; FFPE, Formalin-fixed and paraffin-embedded; TMA, Tissue microarray; HR, Hazard ratio; CI, Confidence interval; P h, P-value of heterogeneity test.
In multivariate analysis, 27 studies were included to assess the prognostic value of miR-17-92 cluster. Consequently, high-expression of miR-17-92 cluster in various tumors was associated with unfavorable OS (HR = 2.14, 95%CI: 1.75–2.61, P < 0.001) (Fig. 2B). Likewise, a similar result was found in different subgroups (Table 3).
Meta-analysis of DFS
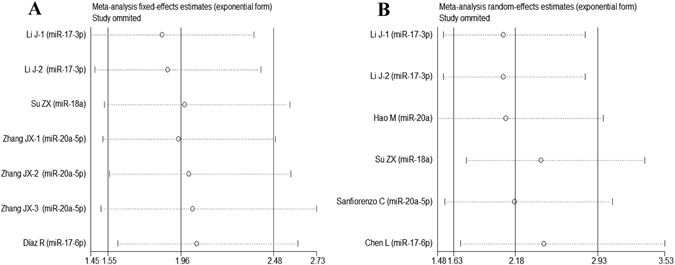
7 studies and 6 studies were included in univariate analysis and multivariate analysis, respectively. Ultimately, we found that high-expression of miR-17-92 cluster was linked with poor DFS both in univariate analysis (HR = 1.96, 95%CI: 1.55-2.48, P < 0.001) (Fig. 3A) and multivariate analysis (HR = 2.18, 95%CI: 1.63–2.91, P < 0.001) (Fig. 3B).
Figure 3.
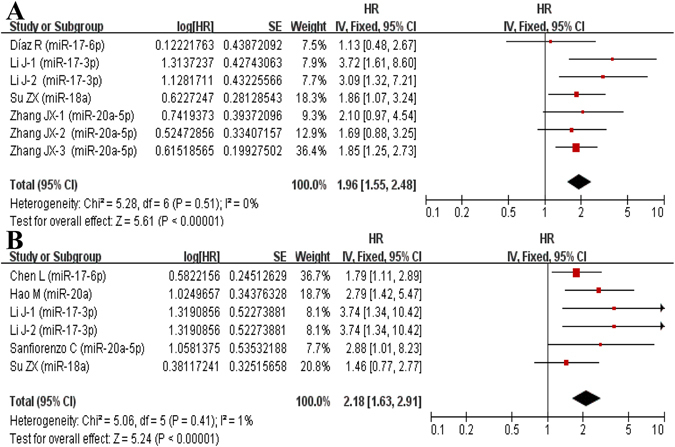
Forest plot of the association between high-expression of miR-17-92 cluster in various tumors and DFS under different types of analysis. (A) Univariate analysis; (B) multivariate analysis). The squares and horizontal lines correspond to the study-specific HR and 95% CI. The area of the squares reflects the weight. The diamond represents the summary HR and 95% CI. CI = confidence interval, HR = hazard ratio.
Meta-analysis of RFS/PFS/CSS
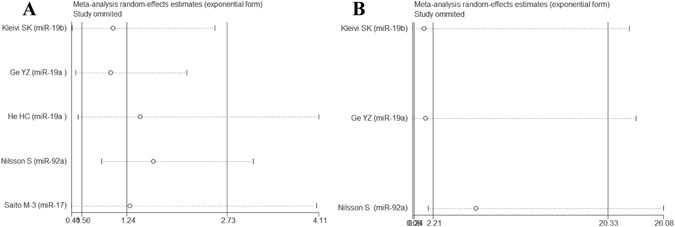
In univariate analysis, there were 5studies, 1 study and 3 studies involved with RFS, PFS and CSS, respectively. Correspondingly, 3 studies, 3 studies and 1 study were collected in multivariate analysis. No association of high-expression of miR-17-92 cluster was detected with RFS (Univariate: HR = 1.24, 95%CI: 0.56–2.73, P = 0.597; Multivariate: HR = 2.21, 95%CI: 0.24–20.33, P = 0.482) (Fig. 4A and B). We also explored that high-expression of miR-17-92 cluster was associated with favorable PFS (Univariate: HR = 0.36, 95%CI: 0.16–0.80, P = 0.012; Multivariate: HR = 1.55, 95%CI: 0.79–3.05, P = 0.201), and poor CSS in the univariate (HR = 1.77, 95%CI: 1.21–2.60, P = 0.004) rather than multivariate analysis (HR = 1.77, 95%CI: 0.80–3.92, P = 0.160).
Figure 4.
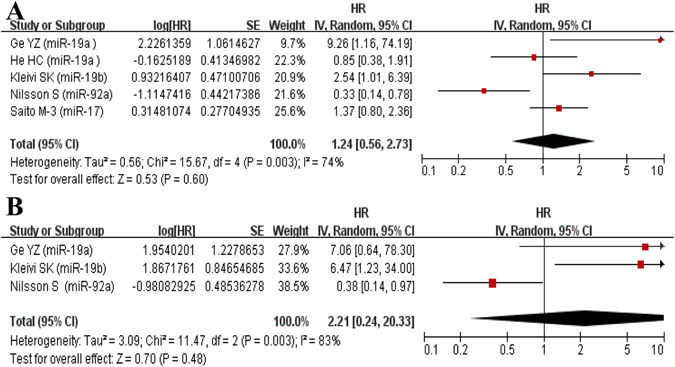
Forest plot of the association between high-expression of miR-17-92 cluster in various tumors and RFS under different types of analysis. (A) Univariate analysis; (B) multivariate analysis). The squares and horizontal lines correspond to the study-specific HR and 95% CI. The area of the squares reflects the weight. The diamond represents the summary HR and 95% CI. CI = confidence interval, HR = hazard ratio.
Sensitivity analysis
Each single study here was deleted at a time to assess the specific effect of the individual data on the pooled HRs, and one-way sensitivity analysis suggested pooled results were relatively stable. Among them, the pooled results of OS, DFS and RFS in both univariate and multivariate analyses were shown in Fig. 5A and B, Fig. 6A and B, Fig. 7A and B, respectively.
Figure 5.
One-way sensitivity analysis of high-expression of miR-17-92 cluster in various tumors with OS under different types of analysis. (A) Univariate analysis; (B) multivariate analysis). Individually removed the studies and suggested that the results of this meta-analysis were stable.
Figure 6.
One-way sensitivity analysis of high-expression of miR-17-92 cluster in various tumors with DFS under different types of analysis. (A) Univariate analysis; (B) multivariate analysis). Individually removed the studies and suggested that the results of this meta-analysis were stable.
Figure 7.
One-way sensitivity analysis of high-expression of miR-17-92 cluster in various tumors with RFS under different types of analysis. (A) Univariate analysis; (B) multivariate analysis). Individually removed the studies and suggested that the results of this meta-analysis were stable.
Publication bias evaluation
In univariate analysis, Begg’s funnel plot indicated that publication bias was not found in meta-analysis of OS (P = 0.822 > 0.05, Fig. 8A), DFS (P = 0.764 > 0.05, Fig. 8C), RFS (P = 0.462 > 0.05, Fig. 8E). Meanwhile, in multivariate analysis, there was no publication bias of OS (P = 0.059 > 0.05, Fig. 8B), DFS (P = 0.348 > 0.05, Fig. 8D), RFS (P = 1.000 > 0.05, Fig. 8F) from Begg’s funnel plot. Moreover, no publication bias was found in each subgroup of mata-analysis of OS. However, we did not evaluated the publication bias for the CSS/PFS meta-analysis because of fewer datasets for meta-analysis.
Figure 8.
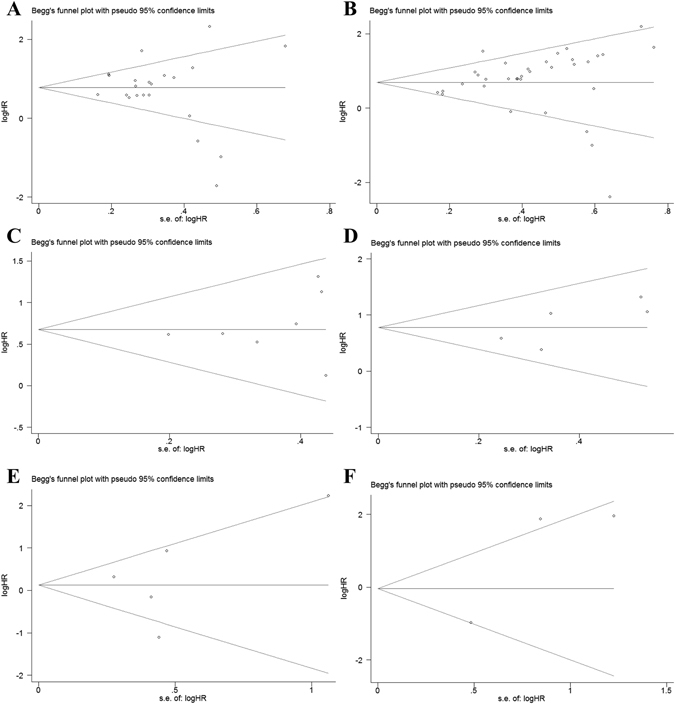
Begg’s funnel plot for publication bias test. (A) OS of high-expression of miR-17-92 cluster in various tumors under univariate analysis; (B) OS of high-expression of miR-17-92 cluster in various tumors under multivariate analysis; (C) DFS of high-expression of miR-17-92 cluster in various tumors under univariate analysis; (D) DFS of high-expression of miR-17-92 cluster in various tumors under multivariate analysis; (E) RFS of high-expression of miR-17-92 cluster in various tumors under univariate analysis; (F) RFS of high-expression of miR-17-92 cluster in various tumors under multivariate analysis;). The x-axis is log (HR), and the y-axis is natural logarithm of HR. The horizontal line in the figure represents the overall estimated log (HR). The two diagonal lines indicate the pseudo 95% confidence limits of the effect estimate. Log (HR) = log-transformed HR, HR = hazard ratio.
Discussion
In recent decades, to explore the clinically useful cancer signatures remains to be the focus of research due to the complexity of cancer. Fortunately, considerable progresses have been achieved to identify the combinatory cancer hallmark-based gene signature sets (CSS sets) for prognostic indicators and therapeutic strategy design. For instance, a model of seven-gene signatures (NHLRC3, ZDHHC21, PRR14L, CCBL1, PTPRB, PNPO and PPIP5K2) was applied to predict OS by dividing colorectal cancer (CRC) patients into low-risk and high-risk groups. Consequently, the poorer OS was detected in high-risk group compared with low-risk CRC patients52. Additionally, the benefit from adjuvant chemotherapy for patients with stage II CRC after surgery remains a matter of debate53. Gao et al. analyzed data from approximately 1000 patients with stage II CRC from 13 independent cohorts and explored eight CSS sets for determining prognosis of patients. The CSS sets accurately stratified patients into low-, intermediate-, high-risk groups, and predicted five-year RFS rates were 94%, 78% and 45%, respectively for 60%, 28% and 12% of patients with stage II disease. Meanwhile, they have addressed that CSS sets-defined high-risk patients with stage II CRC could gain survival benefit from fluorouracil-based adjuvant chemotherapy54.
Apart from CSS sets, miRNAs have also added some novel insights into cancer diagnosis and therapy. Meanwhile, as miRNAs mainly regulated gene expression by targeting the 3′-UTR of mRNAs, the post-transcriptional effects could consequently make the target genes potential cancer hallmarks in clinical trials. For instance, the miR-17-92 cluster consisted of miR-17, miR-18a, miR-19a/b, miR-20a, and miR-92a, has been proven to play significantly regulatory roles in development, progression and prognosis of several cancer types. It was previously reported that miR-18-mediated low-expression of target gene TGF-β intimately contributed to prolonged survival of glioblastoma multiforme (GBM) patients55. Similarly, miR-19 could exhibit modulatory effect on GSK-3β/β-catenin axis, down-regulated target gene GSK-3β could promote the metastatic potential of lung cancer cells, revealing a poor survival outcome for cancer patients56, 57. Besides, miR-20a was able to suppress the hepatocellular cancer cell proliferation and migration by directly targeted RUNX3, while clinical evidences have proved that RUNX3 was negatively associated with tumor progression, lymph node metastasis and poor prognosis58, 59. Collectively, the gene targets of miR-17-92 cluster could potentially serve as different cancer hallmarks. These cancer hallmarks constituted an organizing principle that provided a logical framework for understanding the remarkable diversities of neoplastic diseases60.
Although it appears reasonable to identify the clinically prognostic value of the dysregulated expression of miR-17-92 cluster itself in various cancers, the investigations focused on the clinical correlation between high-expression of miR-17-92 cluster with cancer prognosis were relatively rare and inconclusive. Moreover, small sample-sized studies lacking statistical power often have resulted in apparently contradicting conclusions. Meta-analysis is a useful tool for providing convincing evidence as it could present inconsistent results from different investigations to get a relatively precise estimation. As far as we know, the current meta-analysis is the first try to comprehensively assess the correlation of high-expression of miR-17-92 cluster with cancer prognosis. Meanwhile, the potential associations were explored in different subgroups. Consequently, the finding of significant correlation between high-expression of miR-17-92 cluster and unfavorable OS/DFS/CSS in various tumors by two different statistical methods is of particular interest. Likewise, similar results were found in different subgroups. However, no association of high-expression of miR-17-92 cluster was detected with RFS. Additionally, we demonstrated that high-expression of miR-17-92 cluster was associated with favorable PFS by two different statistical methods. Probably due to relatively fewer studies of RFS/PFS/CSS, these results remain inconclusive and require further investigation.
Due to significant heterogeneity of the current meta-analysis, careful interpretation and search for influencing factors were required. Firstly, impact of ethnicity on prognosis in patients was considerable, which should be take into consideration when evaluating the prognosis of cancer for patients61. It is a well-established fact that formalin-fixation and/or prolonged storage can elicit damage to nucleic acids, further conferring considerable limitation on results62, 63. Accordingly, differences in the detection and quantification methods, types and numbers of miRNAs evaluated and sample source should be also considered as potential sources of heterogeneity. We performed further subgroup analyses according to country, test method, sample source, miR-17-92 cluster component and sample size. All of the subgroup analyses also indicated that high-expression of miR-17-92 cluster was associated with poor OS. As for PFS/RFS/DFS/CSS, we did not perform subgroup analyses due to relatively fewer eligible studies.
Actually, our meta-analysis has its limitations. Firstly, only published studies might not provide sufficient evidences. Additionally, studies regarding various tumors without a consistent cut-off value may influence the ultimate results and two eligible studies20, 25 did not clearly illustrate the hypotype of miR-19. Meanwhile, the heterogeneity suggested that potential or undiscovered factors including adjustment for surgery, radiation, chemotherapy, socioeconomic status, tumor characteristics, and so on might be ignored. Whereas, in spite of aforementioned limitations, a certain relationship of high-expression of miR-17-92 in prognostic value was found in current meta-analysis.
In conclusion, the current study is the first original meta-analysis to address the correlation between the miR-17-92 cluster expression and prognostic value for patients. A marginally significant association was explored in overall population as well as the corresponding subgroups. Concretely, it presented that high-expression of miR-17-92 cluster might be associated with poor OS/DFS/CSS and favorable CSS to some extent, while no association was detected between high miR-17-92 expression with RFS. Notably, due to relatively fewer studies of RFS/PFS/CSS, these results still require further verification in the near future.
Acknowledgements
This work was supported by the Clinical Key Subjects Program of the Ministry of Public Health (Urology) and National Natural Science Foundation of China (81401518, 81630019, 81370856, 81400757). We are also grateful to Dr. Souvik Mendal for helpful discussion and revision in preparing the manuscript.
Author Contributions
Conceived and designed the study: K.Z. and L.Z.; Eligible study collection, quality assessment and data extraction: M.Z. and Y.Z.; Statistical analyses: D.F. and J.J.; Preparation of tables and figures: L.Y., M.X., X.F. and S.F.; Contributed material/analysis tools: X.C., M.C. and C.L.; Wrote and revised the manuscript: K.Z. and L.Z.; All authors reviewed the final manuscript.
Competing Interests
The authors declare that they have no competing interests.
Footnotes
Kaiping Zhang and Li Zhang contributed equally to this work.
Publisher's note: Springer Nature remains neutral with regard to jurisdictional claims in published maps and institutional affiliations.
Contributor Information
Min Chao, Email: cm0654@sina.com.
Chaozhao Liang, Email: liang_chaozhao@163.com.
References
- 1.Ambros V. The functions of animal microRNAs. Nature. 2004;431:350–355. doi: 10.1038/nature02871. [DOI] [PubMed] [Google Scholar]
- 2.Calin GA, et al. Human microRNA genes are frequently located at fragile sites and genomic regions involved in cancers. Proc. Natl. Acad. Sci. USA. 2004;101:2999–3004. doi: 10.1073/pnas.0307323101. [DOI] [PMC free article] [PubMed] [Google Scholar]
- 3.Bartel DP. MicroRNAs: genomics, biogenesis, mechanism, and function. Cell. 2004;116:281–297. doi: 10.1016/S0092-8674(04)00045-5. [DOI] [PubMed] [Google Scholar]
- 4.Grosshans H, Filipowicz W. Molecular biology: the expanding world of small RNAs. Nature. 2008;451:414–416. doi: 10.1038/451414a. [DOI] [PubMed] [Google Scholar]
- 5.Calin GA, Croce CM. MicroRNA signatures in human cancers. Nat. Rev. Cancer. 2006;6:857–866. doi: 10.1038/nrc1997. [DOI] [PubMed] [Google Scholar]
- 6.Jay C, Nemunaitis J, Chen P, Fulgham P, Tong AW. miRNA profiling for diagnosis and prognosis of human cancer. DNA Cell. Biol. 2007;26:293–300. doi: 10.1089/dna.2006.0554. [DOI] [PubMed] [Google Scholar]
- 7.Doebele C, et al. Members of the microRNA-17-92 cluster exhibit a cell-intrinsic antiangiogenic function in endothelial cells. Blood. 2010;115:4944–4950. doi: 10.1182/blood-2010-01-264812. [DOI] [PubMed] [Google Scholar]
- 8.Hayashita Y, et al. A polycistronic microRNA cluster, miR-17-92, is overexpressed in human lung cancers and enhances cell proliferation. Cancer Res. 2005;65:9628–9632. doi: 10.1158/0008-5472.CAN-05-2352. [DOI] [PubMed] [Google Scholar]
- 9.Mendell JT. miRiad roles for the miR-17-92 cluster in development and disease. Cell. 2008;133:217–222. doi: 10.1016/j.cell.2008.04.001. [DOI] [PMC free article] [PubMed] [Google Scholar]
- 10.Munafo MR, Flint J. Meta-analysis of genetic association studies. Trends. Genet. 2004;20:439–444. doi: 10.1016/j.tig.2004.06.014. [DOI] [PubMed] [Google Scholar]
- 11.Liberati A, et al. The PRISMA statement for reporting systematic reviews and meta-analyses of studies that evaluate health care interventions: explanation and elaboration. PLoS Med. 2009;6:e1000100. doi: 10.1371/journal.pmed.1000100. [DOI] [PMC free article] [PubMed] [Google Scholar]
- 12.Higgins JP, Thompson SG. Quantifying heterogeneity in a meta-analysis. Stat. Med. 2002;21:1539–1558. doi: 10.1002/sim.1186. [DOI] [PubMed] [Google Scholar]
- 13.DerSimonian R, Laird N. Meta-analysis in clinical trials. Control Clin. Trials. 1986;7:177–188. doi: 10.1016/0197-2456(86)90046-2. [DOI] [PubMed] [Google Scholar]
- 14.Mantel N, Haenszel W. Statistical aspects of the analysis of data from retrospective studies of disease. J. Natl. Cancer Inst. 1959;22:719–748. [PubMed] [Google Scholar]
- 15.Begg CB, Berlin JA. Publication bias and dissemination of clinical research. J. Natl. Cancer Inst. 1989;81:107–115. doi: 10.1093/jnci/81.2.107. [DOI] [PubMed] [Google Scholar]
- 16.Robaina MC, et al. miR-17-92 cluster components analysis in Burkitt lymphoma: overexpression of miR-17 is associated with poor prognosis. Ann. Hematol. 2016;95:881–891. doi: 10.1007/s00277-016-2653-7. [DOI] [PubMed] [Google Scholar]
- 17.Ren C, et al. Expression and prognostic value of miR-92a in patients with gastric cancer. Tumour Biol. 2016;37:9483–9491. doi: 10.1007/s13277-016-4865-9. [DOI] [PubMed] [Google Scholar]
- 18.Li XG, Lu SK, Wang S. Influence of expression level of miR-17 on prognosis of glioma patients. Journal of Brain and Nervous Diseases. 2016;24:168–171. [Google Scholar]
- 19.Chen YJ, et al. MicroRNA-18a modulates P53 expression by targeting IRF2 in gastric cancer patients. J. Gastroenterol. Hepatol. 2016;31:155–163. doi: 10.1111/jgh.13041. [DOI] [PubMed] [Google Scholar]
- 20.Xi YF, et al. Upregulation of miRNA-17 and miRNA-19 is associated with unfavorable prognosis in patients with T-cell lymphoblastic lymphoma. Exp. Mol. Pathol. 2015;99:297–302. doi: 10.1016/j.yexmp.2015.07.012. [DOI] [PubMed] [Google Scholar]
- 21.Su X, et al. An in vivo method to identify mi-croRNA targets not predicted by computation algorithms: p21 targeting by miR-92a in cancer. Cancer Res. 2015;75:2875–2885. doi: 10.1158/0008-5472.CAN-14-2218. [DOI] [PubMed] [Google Scholar]
- 22.Li J, et al. Serum miRNA expression profile asa prognostic biomarker of stage II/III colorectal adenocarcinoma. Sci. Rep. 2015;5:12921. doi: 10.1038/srep12921. [DOI] [PMC free article] [PubMed] [Google Scholar]
- 23.Hao M, et al. Low serum miR-19a expression as a novel poor prognostic indicator in multiplemyeloma. Int. J. Cancer. 2015;136:1835–1844. doi: 10.1002/ijc.29199. [DOI] [PMC free article] [PubMed] [Google Scholar]
- 24.Ge YZ, et al. MicroRNA expression profiles predict clinical phenotypes and prognosis inchromophobe renal cell carcinoma. Sci. Rep. 2015;5:10328. doi: 10.1038/srep10328. [DOI] [PMC free article] [PubMed] [Google Scholar]
- 25.Guo YH, Liu JW, Wang B, Zhao W, He MY. MiR-19 expression in hepatocellular carcinoma and its clinical significance. Chinese Journal of General Surgery. 2014;23:1217–1221. [Google Scholar]
- 26.Xu XL, et al. MicroRNA-17, microRNA-18a, and microRNA-19a are prognostic indicators inesophageal squamous cell carcinoma. Ann. Thorac. Surg. 2014;97:1037–1045. doi: 10.1016/j.athoracsur.2013.10.042. [DOI] [PubMed] [Google Scholar]
- 27.Wu CH, et al. Serum levels of miR-19b and miR-146a as prognostic biomarkers for non-small cell lung cancer. Tohoku J. Exp. Med. 2014;232:85–95. doi: 10.1620/tjem.232.85. [DOI] [PubMed] [Google Scholar]
- 28.Su ZX, et al. Diagnostic and prognostic value of circulating miR-18a in the plasma of patients with gastric cancer. Tumour Biol. 2014;35:12119–12125. doi: 10.1007/s13277-014-2516-6. [DOI] [PubMed] [Google Scholar]
- 29.Lin HM, et al. Circulating microRNAs are associated with docetaxel chemotherapy outcome incastration-resistant prostate cancer. Br. J. Cancer. 2014;110:2462–2471. doi: 10.1038/bjc.2014.181. [DOI] [PMC free article] [PubMed] [Google Scholar]
- 30.Fang L, et al. MicroRNA-17-5p promotes chemotherapeutic drug resistance and tumour metastasis of colorectal cancer by repressing PTEN expression. Oncotarget. 2014;5:2974–2987. doi: 10.18632/oncotarget.1614. [DOI] [PMC free article] [PubMed] [Google Scholar]
- 31.Zhang JX, et al. Prognostic and predictive value of a microRNA signature in stage II colon cancer: a microRNA expression analysis. Lancet Oncol. 2013;14:1295–1306. doi: 10.1016/S1470-2045(13)70491-1. [DOI] [PubMed] [Google Scholar]
- 32.Zhou T, Zhang G, Liu Z, Xia S, Tian H. Overexpression of miR-92a correlates with tumor metastasis and poor prognosis in patients with colorectalcancer. Int. J. Colorectal Dis. 2013;28:19–24. doi: 10.1007/s00384-012-1528-1. [DOI] [PubMed] [Google Scholar]
- 33.Sanfiorenzo C, et al. Two panels of plasma microRNAs as non-invasive biomarkers for prediction ofrecurrence in resectable NSCLC. PLoS One. 2013;8:e54596. doi: 10.1371/journal.pone.0054596. [DOI] [PMC free article] [PubMed] [Google Scholar]
- 34.Mitani Y, et al. MicroRNA profiling of salivary adenoid cystic carcinoma: association of miR-17-92 upregulation with poor outcome. PLoS One. 2013;8:e66778. doi: 10.1371/journal.pone.0066778. [DOI] [PMC free article] [PubMed] [Google Scholar]
- 35.Liu GH, et al. Sun XF. Serum miR-21 and miR-92a as biomarkers in the diagnosis and prognosis of colorectal cancer. Tumour Biol. 2013;34:2175–2181. doi: 10.1007/s13277-013-0753-8. [DOI] [PubMed] [Google Scholar]
- 36.Lin Q, et al. Serum miR-19a expression correlates with worse prognosis of patients withnon-small cell lung cancer. J. Surg. Oncol. 2013;107:767–771. doi: 10.1002/jso.23312. [DOI] [PubMed] [Google Scholar]
- 37.He HC, et al. Global analysis of the differentially expressed miRNAs of prostate cancer inChinese patients. BMC Genomics. 2013;14:757. doi: 10.1186/1471-2164-14-757. [DOI] [PMC free article] [PubMed] [Google Scholar]
- 38.Zheng J, Dong P, Gao S, Wang N, Yu F. High expression of serum miR-17-5p associated with poor prognosis in patients with hepatocellular carcinoma. Hepatogastroenterology. 2013;60:549–552. doi: 10.5754/hge12754. [DOI] [PubMed] [Google Scholar]
- 39.Chen Q, et al. Prognostic significance of serum miR-17-5p in lung cancer. Med. Oncol. 2013;30:353. doi: 10.1007/s12032-012-0353-2. [DOI] [PubMed] [Google Scholar]
- 40.Yu G, et al. Prognostic values of the miR-17-92 cluster and its paralogs in colon cancer. J. Surg. Oncol. 2012;106:232–237. doi: 10.1002/jso.22138. [DOI] [PubMed] [Google Scholar]
- 41.Wang M, et al. Circulating miR-17-5p and miR-20a: molecular markers for gastric cancer. Mol. Med. Rep. 2012;5:1514–1520. doi: 10.3892/mmr.2012.745. [DOI] [PubMed] [Google Scholar]
- 42.Nilsson S, et al. Downregulation of miR-92a is associated with aggressive breast cancerfeatures and increased tumour macrophage infiltration. PLoS One. 2012;7:e36051. doi: 10.1371/journal.pone.0036051. [DOI] [PMC free article] [PubMed] [Google Scholar]
- 43.Ma Y, et al. Elevated oncofoetal miR-17-5p expression regulates colorectal cancerprogression by repressing its target gene P130. Nat. Commun. 2012;3:1291. doi: 10.1038/ncomms2276. [DOI] [PubMed] [Google Scholar]
- 44.Chen L, Jiang M, Yuan W, Tang H. miR-17-5p as a novel prognostic marker for hepatocellular carcinoma. J. Invest. Surg. 2012;25:156–161. doi: 10.3109/08941939.2011.618523. [DOI] [PubMed] [Google Scholar]
- 45.Valladares AM, et al. Prognostic impact of disseminated tumor cells and microRNA-17-92 clusterderegulation in gastrointestinal cancer. Int. J. Oncol. 2011;39:1253–1264. doi: 10.3892/ijo.2011.1112. [DOI] [PubMed] [Google Scholar]
- 46.Saito M, et al. The association of microRNA expression with prognosis and progression in early-stage, non-small cell lung adenocarcinoma: a retrospective analysis of three cohorts. Clin. Cancer Res. 2011;17:1875–1882. doi: 10.1158/1078-0432.CCR-10-2961. [DOI] [PMC free article] [PubMed] [Google Scholar]
- 47.Marchini S, et al. Association between miR-200c and the survival of patients with stage Iepithelial ovarian cancer: a retrospective study of two independent tumourtissue collections. Lancet Oncol. 2011;12:273–285. doi: 10.1016/S1470-2045(11)70012-2. [DOI] [PubMed] [Google Scholar]
- 48.Liu, R. Diagnosis and prognosis of pancreatic cancer by a novel serum microRNAexpression profile-based biomarker. Tianjin, Tianjin Medical University (2011).
- 49.Chen ZL, et al. microRNA-92a promotes lymph node metastasis of human esophagealsquamous cell carcinoma via E-cadherin. J. Biol. Chem. 2011;286:10725–10734. doi: 10.1074/jbc.M110.165654. [DOI] [PMC free article] [PubMed] [Google Scholar]
- 50.Yu J, et al. MicroRNA miR-17-5p is overexpressed in pancreatic cancer, associated with a poor prognosis, and involved in cancer cell proliferation and invasion. Cancer Biol. Ther. 2010;10:748–757. doi: 10.4161/cbt.10.8.13083. [DOI] [PubMed] [Google Scholar]
- 51.Díaz R, et al. Deregulated expression of miR-106a predicts survival in human colon cancer patients. Genes Chromosomes Cancer. 2008;47:794–802. doi: 10.1002/gcc.20580. [DOI] [PubMed] [Google Scholar]
- 52.Chen, H. et al. A seven-gene signature predicts overall survival of patients with colorectal cancer. Oncotarget 2016, doi:10.18632/oncotarget.10982. [DOI] [PMC free article] [PubMed]
- 53.Meropol NJ. Ongoing challenge of stage II colon cancer. J Clin Oncol. 2011;29:3346–3348. doi: 10.1200/JCO.2011.35.4571. [DOI] [PubMed] [Google Scholar]
- 54.Gao S, et al. Identification and construction of combinatory cancer hallmark-based gene signature sets to predict recurrence and chemotherapy benefit in stage II colorectal cancer. JAMA Oncol. 2016;2:37–45. doi: 10.1001/jamaoncol.2015.3413. [DOI] [PubMed] [Google Scholar]
- 55.Fox JL, Dews M, Minn AJ, Thomas-Tikhonenko A. Targeting of TGFβ signature and its essential component CTGF by miR-18 correlates with improved survival in glioblastoma. RNA. 2013;19:177–190. doi: 10.1261/rna.036467.112. [DOI] [PMC free article] [PubMed] [Google Scholar]
- 56.Zhu J, Han H. miR-19 targeting of GSK3β mediates sulforaphane suppression of lung cancer stem cells. J Nutr Biochem. 2017;44:80–91. doi: 10.1016/j.jnutbio.2017.02.020. [DOI] [PubMed] [Google Scholar]
- 57.Bae GY, et al. Chronic TGFβ stimulation promotes the metastatic potential of lung cancer cells by Snail protein stabilization through integrin β3-Akt-GSK3β signaling. Oncotarget. 2016;7:25366–25376. doi: 10.18632/oncotarget.8295. [DOI] [PMC free article] [PubMed] [Google Scholar]
- 58.Chen Y, et al. MicroRNA-20a-5p targets RUNX3 to regulate proliferation and migration of human hepatocellular cancer cells. Oncol Rep. 2016;36:3379–3386. doi: 10.3892/or.2016.5144. [DOI] [PubMed] [Google Scholar]
- 59.Hsu PI, et al. Loss of RUNX3 expression correlates with differentiation, nodal metastasis, and poor prognosis of gastric cancer. Ann Surg Oncol. 2009;16:1686–1694. doi: 10.1245/s10434-009-0428-2. [DOI] [PubMed] [Google Scholar]
- 60.Wang E, et al. Predictive genomics:a cancer hallmark network framework for predicting tumor clinical phenotypes using genome sequencing data. Semin Cancer Biol. 2015;30:4–12. doi: 10.1016/j.semcancer.2014.04.002. [DOI] [PubMed] [Google Scholar]
- 61.Hashiguchi Y, et al. Impact of race/ethnicity on prognosis in patients who underwent surgery for colon cancer: analysis for white, African, and East Asian Americans. Ann. Surg. Oncol. 2012;19:1517–1528. doi: 10.1245/s10434-011-2113-5. [DOI] [PubMed] [Google Scholar]
- 62.Inoue T, Nabeshima K, Kataoka H, Koono M. Feasibility of archival non-buffered formalin-fixed and paraffin-embedded tissues for PCR amplification: an analysis of resected gastric carcinoma. Pathol. Int. 1996;46:997–1004. doi: 10.1111/j.1440-1827.1996.tb03580.x. [DOI] [PubMed] [Google Scholar]
- 63.Solassol J, et al. KRAS mutation detection in paired frozen and Formalin-Fixed Paraffin-Embedded (FFPE) colorectal cancer tissues. Int. J. Mol. Sci. 2011;12:3191–3204. doi: 10.3390/ijms12053191. [DOI] [PMC free article] [PubMed] [Google Scholar]