

Abstract
Asthmatic patients present more rapid progression of respiratory distress after A(H1N1)pdm09 influenza infection than after seasonal infection. Here, we sought to clarify the pathophysiology of early deterioration in asthmatic patients after A(H1N1)pdm09 infection. Cytokine levels and virus titres in bronchoalveolar lavage fluid from mice with and without asthma after A(H1N1)pdm09 or seasonal H1N1 infection were examined. In asthma/A(H1N1)pdm09 mice, IL-6 and TNF-α levels peaked at 3 days post-infection and were higher than those in all other groups. IFN-γ levels in asthma/A(H1N1)pdm09 mice at 3 days post-infection were higher than in all other mice at any time point, whereas at 7 days post-infection, the levels were lowest in asthma/A(H1N1)pdm09 mice. Virus titres in asthma/A(H1N1)pdm09 mice were highest at 3 days post-infection, and decreased by 7 days post-infection, although the levels at this time point were still higher than that in any other group. Histopathological examination showed more inflammatory cell infiltration and lung tissue destruction in the asthma/A(H1N1)pdm09 group than in any other group. The distinct cytokine profiles in A(H1N1)pdm09-infected asthmatic mice indicated excessive inflammation and virus replication within a few days after infection. Thus, bronchial asthma could be a more exacerbating factor for pandemic influenza infection than for seasonal influenza infection.
Introduction
During the global 2009 H1N1 pandemic [A(H1N1)pdm09], there were significantly higher infection rates in children, and approximately 80% of deaths due to A(H1N1)pdm09 infection occurred in individuals aged < 65 years1. Although the clinical manifestations of A(H1N1)pdm09 and seasonal H1N1 infections were similar2, many severe and fatal cases of A(H1N1)pdm09 occurred not only in patients with underlying diseases but also in healthy children and young adults3, 4. Some reports have shown that bronchial asthma was one of the most common underlying conditions in patients hospitalized with A(H1N1)pdm09 infection5, 6. Additionally, it has been reported that children with asthma showed increased susceptibility to A(H1N1)pdm09 viral infection7, and the incidence of A(H1N1)pdm09 viral infection was significantly higher in children with asthma than in children without asthma7.
Paediatric patients with A(H1N1)pdm09 infection showed milder symptoms than those with seasonal H1N1 infection. However, severe respiratory issues, including pneumonia and acute respiratory distress syndrome (ARDS), have been reported in children and young adults with A(H1N1)pdm09 infection5, 8–10. Bronchial asthma increases the risk of hospital and intensive care admission in infants and children3–6, 10–14. We previously reported that A(H1N1)pdm09 infection, but not seasonal H1N1 infection, induces severe pulmonary inflammation in a mouse model of asthma 7 days after infection14, 15. However, we observed that the duration of the latent period for A(H1N1)pdm09 infection is shorter than 7 days, and patients present earlier progression of pulmonary disease and systemic conditions after infection. Since exacerbation was frequently observed in asthmatic patients after viral infection, we suspect that a cytokine storm, including inflammatory cytokines (interleukin [IL]-6 and tumour necrosis factor [TNF]-α), anti-inflammatory cytokines (IL-10), anti-viral cytokines (interferon [IFN]-γ), and helper T (Th) 2 cytokines (IL-4 and IL-13), may occur in the lung following A(H1N1)pdm09 infection. However, little is known about the early host response against A(H1N1)pdm09 infection in patients with underlying bronchial asthma.
In the present study, we investigated the sequential changes in intra-tracheal cytokine production, viral loads, and pulmonary inflammation in a mouse model of bronchial asthma during the first 7 days after A(H1N1)pdm09 or seasonal H1N1 influenza infection.
Results
Inflammatory cytokine concentrations in bronchoalveolar lavage (BAL) fluid
IL-6, TNF-α, and IL-1β concentrations in BAL fluid obtained 2, 3, and 7 days post-infection are shown in Fig. 1. Although the mean IL-6 levels in asthmatic mice challenged with A(H1N1)pdm09 were low (118.9 pg/mL) at 2 days post-infection, the levels were markedly increased (to 1578.2 pg/mL) at 3 days post-infection, and the levels in all groups remained high at 7 days post-infection. In contrast, IL-6 levels in A(H1N1)pdm09-challenged control mice were 198.6 pg/mL at 2 days post-infection, peaked at 463.5 pg/mL by 3 days post-infection, and remained at similar levels at 7 days post-infection.
Figure 1.

Cytokine levels in bronchoalveolar lavage (BAL) fluid after influenza infection. The levels of interleukin (IL)-6, tumour necrosis factor (TNF)-α, IL-1β, interferon (IFN)-γ, IL-13, and IL-10 in BAL fluids from control and asthmatic mice infected with A(H1N1)pdm09 or seasonal H1N1 (A/Puerto Rico) or mock infected at 2, 3, and 7 days post infection. Data shown are the mean ± standard deviation (SD) of three independent experiments.  : control/A(H1N1)pdm09,
  : asthma/A(H1N1)pdm09,
  : control/seasonal,
  : asthma/seasonal,
  : control/mock,
  : asthma/mock. Control/A(H1N1)pdm09 vs. asthma/A(H1N1)pdm09: †
p < 0.05, ††
p < 0.01; control/seasonal vs. asthma/seasonal: || p < 0.05, || || p < 0.01; control/A(H1N1)pdm09 vs. control/seasonal: p < 0.05; asthma/A(H1N1)pdm09 vs. asthma/seasonal: §
p < 0.05, §§
p < 0.01; asthma/A(H1N1)pdm09 vs. control/seasonal: $$
p < 0.01; and control/A(H1N1)pdm09 vs. asthma/seasonal: ‡
p < 0.05, ‡‡
p < 0.01; mock/control or mock/asthma vs. each group: *p < 0.05, **p < 0.01; day 2 vs. day 3, ¶¶
p < 0.01; day 3 vs. day 7: ##
p < 0.01.
: asthma/mock. Control/A(H1N1)pdm09 vs. asthma/A(H1N1)pdm09: †
p < 0.05, ††
p < 0.01; control/seasonal vs. asthma/seasonal: || p < 0.05, || || p < 0.01; control/A(H1N1)pdm09 vs. control/seasonal: p < 0.05; asthma/A(H1N1)pdm09 vs. asthma/seasonal: §
p < 0.05, §§
p < 0.01; asthma/A(H1N1)pdm09 vs. control/seasonal: $$
p < 0.01; and control/A(H1N1)pdm09 vs. asthma/seasonal: ‡
p < 0.05, ‡‡
p < 0.01; mock/control or mock/asthma vs. each group: *p < 0.05, **p < 0.01; day 2 vs. day 3, ¶¶
p < 0.01; day 3 vs. day 7: ##
p < 0.01.
After challenge with influenza A/Puerto Rico, IL-6 levels in asthmatic mice slowly increased to 161.7 pg/mL by 3 days post-infection, and then reached 654.7 pg/mL at 7 days post-infection. In contrast, IL-6 levels in control mice increased to 433.2 pg/mL at 3 days post-infection, similar to the levels after A(H1N1)pdm09 infection. IL-6 levels in control mice at 3 days post-infection exceeded those of asthmatic mice at this time point (p = 0.015), and peaked to 1696.8 pg/mL at 7 days post-infection.
The TNF-α levels in asthmatic/A(H1N1)pdm09 mice increased to 188.5 pg/mL at 3 days post-infection, which was the highest for all groups, and levels remained high at 7 days post-infection (p = 0.33). In contrast, TNF-α levels in the control/A(H1N1)pdm09 group increased to 63.7 pg/mL at 3 days post-infection, and peaked to 110.7 pg/mL by 7 days post-infection (p = 0.12).
After seasonal virus infection, TNF-α levels in asthmatic mice increased to only 92.2 pg/mL at 3 days post-infection, which was similar to the levels in control/A(H1N1)pdm09 mice (p = 0.06), and these levels were maintained until 7 days post-infection. In contrast, the levels in control mice increased to 161.4 pg/mL by 3 days post-seasonal virus infection, which were similar to those in asthma/A(H1N1)pdm09 mice (p = 1.00), and these levels were maintained until 7 days post-infection. Elevations in IL-6 and TNF-α levels in BAL fluid were not observed in the two mock-infected groups.
The BAL IL-1β levels in control (145.6 pg/mL) and asthmatic mice (100.7 pg/mL) after seasonal infection were significantly higher than the A(H1N1)pdm09-infected groups (control/A(H1N1)pdm09: 16.5 pg/mL, asthmatic/A(H1N1)pdm09: 45.0 pg/mL), respectively.
The early increasing pattern of IL-6 and TNF-α levels (but not IL-1β) in asthmatic mice after A(H1N1)pdm09 infection (but not control mice), was in contrast to the dynamics observed in A/Puerto Rico-infected mice.
Other cytokines in BAL fluid
IFN-γ levels in asthmatic/A(H1N1)pdm09 mice significantly increased to 240.4 pg/mL by 3 days post-infection, which was the highest among all mice at this time point (vs. control/A(H1N1)pdm09, p = 0.007; vs. asthma/seasonal, p = 0.002; vs. control/seasonal, p = 0.001), and then levels increased to 651.5 pg/mL at 7 days post-infection (p = 0.001). IFN-γ levels in control mice at 3 days after A(H1N1)pdm09 infection increased to 70.8 pg/mL, which was significantly lower than the levels in asthmatic/A(H1N1)pdm09 mice at 3 days post-infection (p = 0.007). However, IFN-γ levels in control/A(H1N1)pdm09 mice peaked at 1209.4 pg/mL at 7 days post-infection, which were the highest of all the groups.
IL-10 levels were undetectable in all mice until 3 days post-infection. At 7 days post-infection, the levels in asthmatic/A(H1N1)pdm09 mice increased to 322.1 pg/mL, which was the highest of all the groups (vs. control/A(H1N1)pdm09, p = 0.007; vs. asthma/seasonal, p = 0.0001; vs. control/seasonal, p = 0.005). IL-10 levels in control/A(H1N1)pdm09 mice increased to 202.4 pg/mL at 7 days post-infection. These levels were similar to those in control/seasonal mice (185.3 pg/mL, p = 0.44) but higher than those in asthma/seasonal mice (122.9 pg/mL, p = 0.03).
After seasonal virus infection, the IFN-γ levels in asthmatic mice increased to 72.8 pg/mL at 3 days post-infection, which were similar to the levels in A/Puerto Rico-challenged control and asthmatic mice at 3 days post-infection, but were lower than those in asthmatic/A(H1N1)pdm09 mice at 3 days post-infection (p = 0.002). The IFN-γ levels in asthmatic/seasonal mice then increased to 420.6 pg/mL by 7 days post-infection, which were lower than that in any other group at this time point (vs. asthmatic/A(H1N1)pdm09, p = 0.03; vs. control/A(H1N1)pdm09, p = 0.002; and vs. control/seasonal, p = 0.002). IFN-γ levels in control/seasonal mice only increased to 80.7 pg/mL at 3 days post-infection, but then increased to 945.0 pg/mL by 7 days post-infection (p = 0.0001). Neither IL-10 levels nor IFN-γ levels were elevated in non-infected groups.
BAL IL-13 levels in all asthmatic groups were higher than those in all non-asthmatic control groups, but the differences were not statistically significant. Additionally, the levels in the control/A(H1N1)pdm09 and asthma/A(H1N1)pdm09 groups increased from 3 to 7 days post-infection.
No significant differences in the levels of IL-2, IL-4, or IL-17A, were observed among the groups, and the levels were all below the detection limits.
Cell infiltration in BAL fluid
The differences in the numbers of inflammatory cells in BAL fluid from mice in each of the groups are shown in Fig. 2. The numbers of total cells, lymphocytes, CD4+ cells, and CD8+ cells in all infected groups were increased at 3 days post-infection, and then decreased at 7 days post-infection. The numbers of CD8+ cells in the asthma/A(H1N1)pdm09 and control/seasonal groups were maintained until 7 days post-infection. The number of lymphocytes in control/seasonal group were higher than that in control/A(H1N1)pdm09 at 3 days post-infection, however, there were no significant differences between control/seasonal and asthma/A(H1N1)pdm09, control/A(H1N1)pdm09 and asthma/A(H1N1)pdm09 groups, respectively. Additionally, the numbers of CD4+ cells, neutrophils and eosinophils on the 3 days and CD8+ cells on the 7 days post-infection were higher in the asthmatic/A(H1N1)pdm09 group than other groups respectively, but not statistically. In contrast, the numbers in the control/mock and asthma/mock groups were lower than those in the infected groups.
Figure 2.

The number of infiltrated cells in BAL fluid after influenza infection. Cell infiltration in BAL fluid from control and asthmatic mice infected with vehicle (mock), A(H1N1)pdm09, or seasonal H1N1 (A/Puerto Rico) at 2, 3, and 7 days post-infection as determined by flow cytometry and cytospin samples. Data are the mean ± standard deviation (SD) of three independent experiments.  : control/A(H1N1)pdm09,
  : asthma/A(H1N1)pdm09,
  : control/seasonal,
  : asthma/seasonal,
  : control/mock,
  : asthma/mock. Control/A(H1N1)pdm09 vs. asthma/A(H1N1)pdm09: †
p < 0.05, ††
p < 0.01; control/seasonal vs. asthma/seasonal: ||
p < 0.05, || ||
p < 0.01; control/A(H1N1)pdm09 vs. control/seasonal: *p < 0.05; asthma/A(H1N1)pdm09 vs. asthma/seasonal: §
p < 0.05, §§
p < 0.01; asthma/A(H1N1)pdm09 vs. control/seasonal: $$
p < 0.01; and control/A(H1N1)pdm09 vs. asthma/seasonal: ‡
p < 0.05, ‡‡
p < 0.01; mock group vs. each group: *p < 0.05, **p < 0.01; day 2 vs. day 3, ¶¶
p < 0.01; day 3 vs. day 7: ##
p < 0.01.
: asthma/mock. Control/A(H1N1)pdm09 vs. asthma/A(H1N1)pdm09: †
p < 0.05, ††
p < 0.01; control/seasonal vs. asthma/seasonal: ||
p < 0.05, || ||
p < 0.01; control/A(H1N1)pdm09 vs. control/seasonal: *p < 0.05; asthma/A(H1N1)pdm09 vs. asthma/seasonal: §
p < 0.05, §§
p < 0.01; asthma/A(H1N1)pdm09 vs. control/seasonal: $$
p < 0.01; and control/A(H1N1)pdm09 vs. asthma/seasonal: ‡
p < 0.05, ‡‡
p < 0.01; mock group vs. each group: *p < 0.05, **p < 0.01; day 2 vs. day 3, ¶¶
p < 0.01; day 3 vs. day 7: ##
p < 0.01.
Virus titres in BAL fluid
The virus titres in BAL fluid at 2, 3, and 7 days post-infection are shown in Fig. 3. The mean titres at 2 days post-infection in the A(H1N1)pdm09-infected groups (asthma/A(H1N1)pdm09: 1.9 × 10⁵ pfu/mL and control/A(H1N1)pdm09: 1.1 × 10⁵ pfu/mL) were higher than those in the seasonal-infected groups (asthma/seasonal: 1.4 × 10⁴ pfu/mL, control/seasonal: not detected); however, these differences were not statistically significant. The mean titre in the asthmatic/A(H1N1)pdm09 group at 3 days post-infection (2.2 × 10⁷ pfu/mL) was the highest of all groups, and the differences were significant (vs. control/A(H1N1)pdm09, p = 0.001; vs. asthma/seasonal, p = 0.001), with the exception of the control/seasonal group. The virus titre in the asthmatic/A(H1N1)pdm09 group at 7 days post-infection (2.6 × 10⁶ pfu/mL) was higher than those in any other groups at this time point (vs. control/A(H1N1)pdm09, p = 0.03; vs. asthma/seasonal, p = 0.001; vs. control/seasonal, p = 0.03). After A(H1N1)pdm09 infection, the titre in asthmatic mice at 3 days post-infection was higher than the titre at 7 days post-infection (p = 0.0002). The virus titres in control mice were also higher at 3 days post-infection than at 7 days post-infection (p = 0.006) after challenge with seasonal H1N1.
Figure 3.
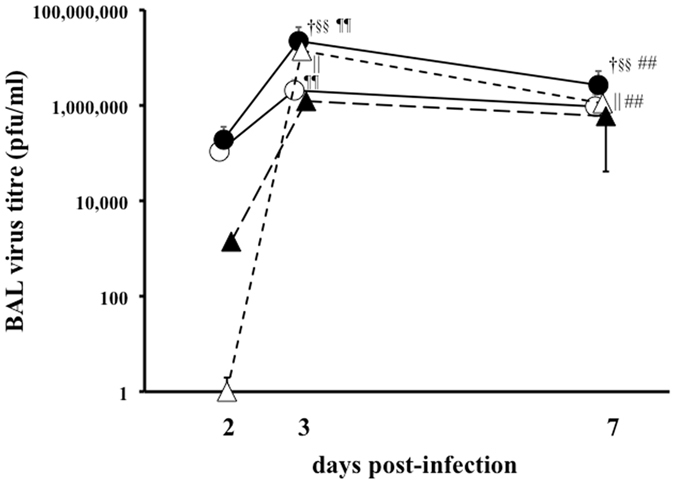
Virus titres in BAL fluid after influenza infection. The virus titres in BAL fluid from control and asthmatic mice infected with A(H1N1)pdm09 or seasonal H1N1 (A/Puerto Rico) at 2, 3, and 7 days post-infection, as determined by the plaque assay. ○: control/A(H1N1)pdm09, ●: asthma/A(H1N1)pdm09, △: control/seasonal, ▲: asthma/seasonal. Data are the mean ± SD of three independent experiments. Control/A(H1N1)pdm09 vs. asthma/A(H1N1)pdm09: † p < 0.05, †† p < 0.01; control/seasonal vs. asthma/seasonal: ||p < 0.05, || ||p < 0.01; asthma/A(H1N1)pdm09 vs. asthma/seasonal: § p < 0.05, §§ p < 0.01; day 2 vs. day 3, ¶¶ p < 0.01; day 3 vs. day 7: ## p < 0.01.
Histopathological findings in the lungs
Figure 4 shows the H&E staining of lung tissues from mice at 2 (A), 3 (B) and 7 (C) days post-infection. The degrees of inflammatory cell infiltration and abscess formation in the asthma/A(H1N1)pdm09 group were more remarkable than in the control/A(H1N1)pdm09, asthma/seasonal, and control/seasonal groups on 2, 3 and 7 days post-infection. In addition, on 7 days post-infection, they were most severe in asthma/A(H1N1)pdm09 mice, compared with other mice.
Figure 4.
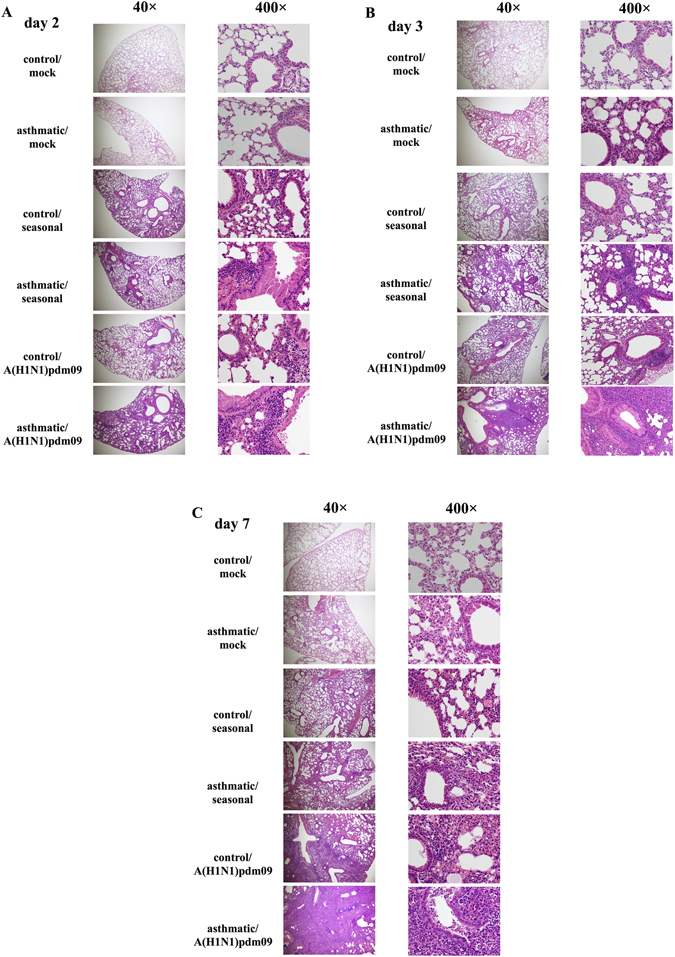
Histopathological findings after influenza infection. Photomicrographs of hematoxylin and eosin (H&E)-stained lung tissue at 2 (A), 3 (B), and 7 (C) days post-infection with mock, seasonal H1N1 (A/Puerto Rico) or A(H1N1)pdm09 influenza virus. Similar results were obtained in six independent mice from each group. Representative findings are shown.
Immunohistochemistry for the distribution of A(H1N1)pdm09
The distribution of type A influenza nucleoprotein antigen (InfA-NP) in the lungs of mice after A(H1N1)pdm09 or seasonal infection were observed by immunohistochemistry (Fig. 5). InfA-NP was detected in the epithelial cells and suspected macrophages in the lungs of asthmatic/A(H1N1)pdm09 (A, day 3) and control/A(H1N1)pdm09 group mice (A, day 2) since the early phase to day 7 (B) after infection, but not in mice from seasonal infected groups. Infiltration of various inflammatory cells was noted, mainly in the alveolar walls in all four infected groups and more around the bronchioles in the A(H1N1)pdm09-infected groups, than in the seasonal H1N1-infected groups. Only the asthmatic/A(H1N1)pdm09 group showed abscess formation with severe inflammation.
Figure 5.

Immunohistochemical findings after influenza infection. Photomicrographs of immunohistochemistry assays of lung tissue in early phase (A), control/A(H1N1)pdm09: day 2, others: day 3), and day 7 (B) post-infection with seasonal or A(H1N1)pdm09 influenza virus (×200). Similar results were obtained in two independent mice from each group. Representative findings are shown.
Discussion
The notable findings in the present study were the early peak in both IL-6 and TNF-α levels, the high inflammatory cell infiltration in BAL fluids, and the severe pulmonary inflammation at 3 days post-infection in asthmatic/A(H1N1)pdm09 mice. The pulmonary cytokine storm at 3 days post-infection in asthma/A(H1N1)pdm09 mice may mirror the rapid exacerbation observed in asthmatic patients13. In contrast, the delayed peak in IL-10 levels and insufficient surge of IFN-γ levels in A(H1N1)pdm09 mice at 7 days post-infection could lead to ineffective exclusion of the viruses. The early potent inflammation associated with high viral loads in the lungs of asthmatic/A(H1N1)pdm09 mice may corroborate the rapid progression of asthmatic patients during outbreaks of pandemic virus infection. Because the dynamics of IL-1β was different from those of IL-6 and TNF-α levels, IL-1β may play other roles after influenza virus infection. In addition, the IL-13 levels were increased in only the asthma/A(H1N1)pdm09 group after the infection. IL-13 may be involved in pathophysiology of A(H1N1)pdm09 infection in asthmatic children. Although IL-2, IL-4, and IL-17A may be involved in the pathogenesis of bronchial asthma and influenza infection, they were undetectable in the BAL fluid from mice in this study. This may be explained by the cytokines’ short half-lives and/or limited roles in this microenvironment.
In asthma/A(H1N1)pdm09 group, the number of CD4+ cells at 3 days and CD8+ cells at 7 days post-infection were higher than those of other groups, respectively. These results show that CD8+ cells may act anti-viral function during influenza infection. We could not recognized whether these were Th1 or Th2 lymphocytes, however both CD4+ and CD8+ cells may play important roles in pathophysiology of A(H1N1)pdm09-infected asthmatic patients.
The histopathological findings in the early phase of infection in asthmatic/A(H1N1)pdm09 mice were severe pneumonia with abscess formation, and were not observed in any other groups (Fig. 4 ).
These results demonstrated that pulmonary inflammation in asthmatic mice is induced beginning in the early phase of A(H1N1)pdm09 infection, which mirrors the finding that A(H1N1)pdm09 infection in asthmatic children induces severe pulmonary complications, including pneumonia, atelectasis, etc., after a shorter incubation period than with seasonal virus infection. After A(H1N1)pdm09 infection, the viral loads in BAL fluid from asthmatic mice were higher than those from control mice, which was not typically observed after seasonal infection (Fig. 3). Immunostaining of the virus showed many InfA-NP-positive cells in the lungs of asthmatic/A(H1N1)pdm09 and control/A(H1N1)pdm09 mice since early phase after viral infection, but not in the lungs of mice from seasonal H1N1 groups, as shown in Fig. 5. Previous reports demonstrated that A(H1N1)pdm09 viral proteins were detected in damaged type II pneumocytes, epithelial cells, and infiltrated macrophages in the lung by immunohistochemistry16–18. In addition, at autopsy after A(H1N1)pdm09 infection, acute diffuse alveolar damage was observed19. Avian influenza viruses preferentially bind to SAα2-3 Gal, which is expressed on distal bronchioles and type II pneumocytes in the lower respiratory tract19. In contrast, seasonal H1N1 influenza viruses bind to SAα2-6 Gal, which is expressed on epithelial cells in the upper respiratory tract. A(H1N1)pdm09 virus binds to both SAα2-6 Gal and SAα2-3Gal19, 20. Predominant replication of A(H1N1)pdm09 virus in the lower respiratory tract, compared with that of seasonal influenza virus, could explain the distinct viral loads shown in Fig. 3. These findings suggested that A(H1N1)pdm09 virus may induce severe pneumonia in asthmatic patients, which is much less likely in seasonal influenza-infected asthmatic patients or non-asthmatic patients. We concluded that severe pulmonary complications are caused not only by the characteristics of the infecting viruses but also by factors in the host defence of asthmatic children during A(H1N1)pdm09 infection.
In the present study, cytokine levels in BAL fluid (Fig. 1) appeared not to be associated with the lung histopathology. The histopathological analyses showed that airway inflammation was augmented in asthmatic mice when compared to control mice infected with either A(H1N1)pdm09 or seasonal influenza (Fig. 4). However, BAL fluid cytokine levels showed no paralleled alterations. In fact, inflammatory cytokine levels in the non-infected groups were equivocally low in mice with or without bronchial asthma, which suggested that these histopathological changes without detectable cytokine elevations, were independent of asthma.
At 3 days post-infection, IFN-γ levels in BAL fluid were significantly higher in the asthmatic/A(H1N1)pdm09 group than in the control/A(H1N1)pdm09 group, in contrast to the pattern at 7 days post-infection. A previous report also showed that IFN-γ levels in asthmatic mice were lower than those in control mice at 7 days after A(H1N1)pdm09 infection21. Virus titres in the asthmatic/A(H1N1)pdm09 group at both 3 and 7 days post-infection were significantly higher than those in control mice, and the titres of asthmatic/A(H1N1)pdm09 mice at 3 days post-infection were the highest among all groups at both 3 and 7 days post-infection. In contrast, the virus titres of the control/seasonal group were significantly lower than those of the asthmatic/seasonal group at both 3 and 7 days post-infection. IFN-γ levels were reportedly reduced in bronchial asthmatic patients, indicating an alteration in the cytokine milieu, with excess production of Th2 cytokines and decreased production of Th1 cytokines22, 23, and it has been reported that bronchial asthma patients show suppressed innate immunity24–26. IFN-γ is produced by Th1 cells, CD8+T (cytotoxic T) cells, natural killer (NK) cells, and NKT cells27, 28, and in our study, IFN-γ levels were elevated against the high virus load in the asthmatic/A(H1N1)pdm09 group at 3 days post-infection, but were not sufficiently augmented at 7 days post-infection. Pulmonary inflammation, through not only the IFN-γ pathway but also other inflammatory molecules, might be involved in the exacerbation observed in A(H1N1)pdm09-infected asthma patients.
We have some limited reasons for the unexplainable reciprocal pattern of virus titres in A(H1N1)pdm09- and seasonal influenza-infected asthmatic mice. The viral titre may depend on both the specificity of these viruses and the distinctive host defences in asthmatic individuals. However, further investigations are needed to characterize the immune responses against A(H1N1)pdm09 infection in asthmatic patients.
In this study, the lung tissues of asthmatic/A(H1N1)pdm09 and control/A(H1N1)pdm09 mice were positive for InfA-NP antigens, whereas the lung tissues of mice in seasonal groups were not, even though virus titres were detected in the BAL fluid of all infected groups. The reasons for this discrepancy may be the lower affinity for the virus receptors present in the lower respiratory tract or some yet unknown properties of the polyclonal antibodies and/or viral strains used, although the reason remains unclear. Further research should be directed toward immunohistochemical studies of the upper respiratory tract along with lung function and airway hyperresponsiveness.
In conclusion, A(H1N1)pdm09 infection can induce more severe pulmonary inflammation in patients with bronchial asthma than seasonal H1N1 infection, based on the dynamics of early excessive production of inflammatory cytokines and the reciprocal depression of anti-viral cytokines, along with high viral loads in a mouse model of bronchial asthma.
Methods
Sensitization of mice and allergen challenge
BALB/c mice (age: 6–8 weeks) were obtained from Chiyoda Kaihatsu Co., Ltd. (Tokyo, Japan) and were sensitized and challenged with grade II ovalbumin (OVA; Sigma-Aldrich., St. Louis, MO, USA), as previously described14, 15. All animal procedures were approved by the Institutional Animal Care and Use Committee of Yamaguchi University (No. 29-S01), and all methods were conducted in accordance with the approved guidelines. This study was performed independently of our previous reports14, 15.
Viruses, infection of mice, and preparation of BAL fluid
Mouse-adapted A(H1N1)pdm09 (strain: A/Narita/1/09) or seasonal H1N1 (strain: A/Puerto Rico) viruses were provided by the National Institute of Infectious Diseases (Tokyo, Japan). On day 31, influenza virus (concentration: 1 × 10⁵ pfu/20 μL) or vehicle (mock-infection) was administered intranasally to mice. Then, mice were euthanized at 2, 3, or 7 days post-infection, and samples were collected.
BAL fluids were collected on day 33, 34, and 38 (2, 3, and 7 days post-infection) with three consecutive 1-mL instillations of phosphate-buffered saline (PBS) at room temperature. The collected BAL fluid was centrifuged at 1,500 rpm for 5 min at 4 °C, and the supernatants were stored at −80 °C for estimation of cytokine levels and virus titres.
Cytokine assays
The concentrations of various cytokines, including IL-1β, IL-2, IL-4, IL-6, IL-10, IL-17A, IFN-γ, and TNF-α, in BAL fluid were measured using the Cytometric Bead Array (CBA) Kit (BD Biosciences, San Diego, CA, USA). The levels of IL-1β and IL-13 in BAL fluid were measured using an ELISA kit (R&D systems, Minneapolis, MN, USA) according to the manufacturer’s instructions. The lower detection limits for IL-1β, IL-2, IL-4, IL-6, IL-10, IL-17A, IFN-γ, TNF-α, and IL-13 were 2.31, 0.1, 0.03, 1.4, 16.8, 0.8, 0.5, 0.9, and 1.5 pg/mL, respectively.
Measurement of CD4+ cells, CD8+ cells, eosinophils, and neutrophils in BAL fluid
Cell pellets were resuspended in PBS and stained with fluorescein isothiocyanate (FITC)-conjugated anti-CD4 (BD Biosciences) and allophycocyanin (APC)-conjugated anti-CD8 (BD Biosciences) antibodies; erythrocytes were lysed by the addition of FACS Lysing Solution (Becton Dickinson, San Diego, CA, USA). The cell suspensions were centrifuged, and the cell pellets were resuspended in PBS containing sodium azide and paraformaldehyde. Then, the cells were analysed with a FACSCalibur flow cytometer (Becton Dickinson) equipped with CellQuest software (Becton Dickinson). Cytospin samples were prepared using Auto Smear CF-12D (Sakura Co., Tokyo, Japan), and cellular infiltration in BAL fluid was assessed on Wright-Giemsa-stained slides (Wako Pure Chemical Industries, Ltd.).
Plaque assay
Plaque assays were performed as described previously10, 11. Briefly, Madin-Darby canine kidney (MDCK) cells (Lonza, Walkersville, MD, USA) were maintained at 37 °C in a humidified 5% CO2 chamber under stationary conditions. Each well of a 6-well plate was seeded with 1 × 10⁶ cells and cultured in α-minimum essential medium (MEM; GIBCO/Invitrogen, Carlsbad, CA, USA) containing 10% foetal bovine serum (FBS), 100 units/mL penicillin (GIBCO), and 100 μg/mL streptomycin (GIBCO). After two washes with serum-free Dulbecco’s modified Eagle’s medium (DMEM; GIBCO/Invitrogen), the cells were maintained in serum-free DMEM at 37 °C for 1 h. Then, each well was overlaid with 200 μL of diluted BAL (10−3, 10−4, and 10−5 dilutions) and incubated at 37 °C for 1 h. After one wash in serum-free DMEM, the cells were overlaid with serum-free DMEM containing 0.8% agarose (Becton, Dickinson and Company, Sparks, MD, USA), 0.1% diethylaminoethyl-Dextran (Sigma-Aldrich), and 7 μg/mL trypsin (Sigma-Aldrich). The cells were cultured at 37 °C for 72 h, fixed in 10% formaldehyde (Wako Pure Chemical Industries, Ltd., Osaka, Japan), and then stained with 0.037% methylene blue (Wako Pure Chemical Industries, Ltd.). Each experiment was performed in duplicate.
Histological and immunohistochemical examination of the lungs
Lung tissues were fixed in 10% buffered formalin for 24 h at room temperature and then embedded in paraffin. Serial sections (3-µm thick) were cut and stained with hematoxylin and eosin (H&E; Muto Pure Chemicals Co., Ltd., Tokyo, Japan). The distribution of viral antigens was examined by immunological staining with a rabbit polyclonal antibody against InfA-NP, which recognize not only A(H1N1)pdm09 and seasonal H1N1, but also H3N2 influenza29. Specific antigen-antibody reactions were visualized by 3,3′-diaminobenzidine tetrahydrochloride staining with the Envision Rabbit/HRP system (DAKO Cytomation). The stained sections were observed by light microscopy to evaluate the degree of pulmonary inflammation and localization of A(H1N1)pdm09-infected cells.
Statistical analysis
The differences between groups were analysed by the Mann-Whitney U test. P values less than 0.05 were considered statistically significant. All analyses and calculations were performed using SPSS version 11.0 (SPSS Inc., Chicago, IL, USA).
Acknowledgements
We thank Dr. Takashi Ichiyama (Division of Pediatrics, Tsudumigaura Medical Center for Children with Disabilities) for critical suggestions, and MT Kenzo Ikemoto (Department of Pathology, Yamaguchi University Graduate School of Medicine), MT Midori Wakabayashi and MT Yoko Mori (Department of Pediatrics, Yamaguchi University Graduate School of Medicine), and Yuko Sato (Department of Pathology, National Institute of Infectious Diseases) for technical support. This study was supported by grants from the Ministry of Health, Labor, and Welfare (H24-Shinko-Ippan-002) and the Ministry of Education, Culture, Sports, Science, and Technology (15K19619).
Author Contributions
Yousuke Fujimoto, Shunji Hasegawa, and Shouichi Ohga were the principal investigators who take primary responsibility for the study. Yousuke Fujimoto, Shunji Hasegawa, Takeshi Matsushige, Hiroyuki Wakiguchi, and Tamaki Nakamura performed the mouse experiments. Hideki Hasegawa, Noriko Nakajima, Akira Ainai, Atsunori Oga, and Hiroshi Itoh performed the histopathological examinations. Komei Shirabe, Shoichi Toda, Ryo Atsuta, and Tsuneo Morishima supported this study with helpful discussions. Yousuke Fujimoto, Shunji Hasegwa, and Shouichi Ohga wrote the first draft of the manuscript.
Competing Interests
The authors declare that they have no competing interests.
Footnotes
Publisher's note: Springer Nature remains neutral with regard to jurisdictional claims in published maps and institutional affiliations.
References
- 1.Fowlkes AL, et al. Epidemiology of 2009 pandemic influenza A (H1N1) deaths in the United States, April-July 2009. Clin. Infect. Dis. 2011;52:S60–68. doi: 10.1093/cid/ciq022. [DOI] [PubMed] [Google Scholar]
- 2.Louie JK, et al. Factors associated with death or hospitalization due to pandemic 2009 influenza A (H1N1) infection in California. JAMA. 2009;302:1896–1902. doi: 10.1001/jama.2009.1583. [DOI] [PubMed] [Google Scholar]
- 3.Athanasiou M, et al. Fatal cases associated with pandemic influenza A (H1N1) reported in Greece. PLoS Curr. 2010;2:RRN1194. doi: 10.1371/currents.RRN1194. [DOI] [PMC free article] [PubMed] [Google Scholar]
- 4.Reichert T, Chowell G, Nishiura H, Christensen RA, McCullers JA. Does glycosylation as a modifier of original antigenic sin explain the case age distribution and unusual toxicity in pandemic novel H1N1 influenza? BMC Infect. Dis. 2010;10:5. doi: 10.1186/1471-2334-10-5. [DOI] [PMC free article] [PubMed] [Google Scholar]
- 5.Jain S, et al. Hospitalized patients with 2009 H1N1 influenza in the United States, April-June 2009. N. Engl. J. Med. 2009;61:1935–1944. doi: 10.1056/NEJMoa0906695. [DOI] [PubMed] [Google Scholar]
- 6.Van Kerkhove MD, et al. Risk factors for severe outcomes following 2009 influenza A (H1N1) infection: a global pooled analysis. PLoS Med. 2011;8:e1001053. doi: 10.1371/journal.pmed.1001053. [DOI] [PMC free article] [PubMed] [Google Scholar]
- 7.Kloepfer KM, et al. Increased H1N1 infection rate in children with asthma. Am. J. Respir. Crit. Care Med. 2012;185:1275–1279. doi: 10.1164/rccm.201109-1635OC. [DOI] [PMC free article] [PubMed] [Google Scholar]
- 8.Perez-Padilla R, et al. Pneumonia and respiratory failure from swine-origin influenza A (H1N1) in Mexico. N. Engl. J. Med. 2009;361:680–689. doi: 10.1056/NEJMoa0904252. [DOI] [PubMed] [Google Scholar]
- 9.Zhang Y, et al. Acute respiratory distress syndrome induced by a swine 2009 H1N1 variant in mice. PLoS One. 2012;7:e29347. doi: 10.1371/journal.pone.0029347. [DOI] [PMC free article] [PubMed] [Google Scholar]
- 10.Terano C, et al. Three children with plastic bronchitis associated with 2009 H1N1 influenza virus infection. Pediatr. Infect. Dis. J. 2011;30:80–82. doi: 10.1097/INF.0b013e3181f10fff. [DOI] [PubMed] [Google Scholar]
- 11.Deng J, et al. Plastic bronchitis in three children associated with 2009 influenza A(H1N1) virus infection. Chest. 2010;138:1486–1488. doi: 10.1378/chest.10-0548. [DOI] [PubMed] [Google Scholar]
- 12.Morris SK, et al. A retrospective cross-sectional study of risk factors and clinical spectrum of children admitted to hospital with pandemic H1N1 influenza as compared to influenza A. BMJ Open. 2012;2:e000310. doi: 10.1136/bmjopen-2011-000310. [DOI] [PMC free article] [PubMed] [Google Scholar]
- 13.Hasegawa S, et al. Characteristics of atopic children with pandemic H1N1 influenza viral infection: pandemic H1N1 influenza reveals ‘occult’ asthma of childhood. Pediatr. Allergy Immunol. 2011;22:e119–123. doi: 10.1111/j.1399-3038.2010.01090.x. [DOI] [PubMed] [Google Scholar]
- 14.Okada S, et al. Analysis of bronchoalveolar lavage fluid in a mouse model of bronchial asthma and H1N1 2009 infection. Cytokine. 2013;63:194–200. doi: 10.1016/j.cyto.2013.04.035. [DOI] [PubMed] [Google Scholar]
- 15.Hasegawa S, et al. Cytokine profile of bronchoalveolar lavage fluid from a mouse model of bronchial asthma during seasonal H1N1 infection. Cytokine. 2014;69:206–210. doi: 10.1016/j.cyto.2014.06.006. [DOI] [PubMed] [Google Scholar]
- 16.Takiyama A, et al. Sudden death of a patient with pandemic influenza (A/H1N1pdm) virus infection by acute respiratory distress syndrome. Jpn. J. Infect. Dis. 2010;63:72–74. [PubMed] [Google Scholar]
- 17.Weinheimer VK, et al. Influenza A viruses target type II pneumocytes in the human lung. J. Infect. Dis. 2012;206:1685–1694. doi: 10.1093/infdis/jis455. [DOI] [PMC free article] [PubMed] [Google Scholar]
- 18.Fujino N, et al. Increased severity of 2009 pandemic influenza A virus subtype H1N1 infection in alveolar type II cells from patients with pulmonary fibrosis. J. Infect. Dis. 2013;207:692–693. doi: 10.1093/infdis/jis739. [DOI] [PubMed] [Google Scholar]
- 19.Nakajima N, et al. Histopathological and immunohistochemical findings of 20 autopsy cases with 2009 H1N1 virus infection. Mod. Pathol. 2012;25:1–13. doi: 10.1038/modpathol.2011.125. [DOI] [PubMed] [Google Scholar]
- 20.Childs RA, et al. Receptor-binding specificity of pandemic influenza A (H1N1) 2009 virus determined by carbohydrate microarray. Nat. Biotechnol. 2009;27:797–799. doi: 10.1038/nbt0909-797. [DOI] [PMC free article] [PubMed] [Google Scholar]
- 21.Samarasinghe AE, et al. The immune profile associated with acute allergic asthma accelerates clearance of influenza virus. Immunol. Cell Biol. 2014;92:449–459. doi: 10.1038/icb.2013.113. [DOI] [PMC free article] [PubMed] [Google Scholar]
- 22.Billiau A, Matthys P. Interferon-gamma: a historical perspective. Cytokine Growth Factor Rev. 2009;20:97–113. doi: 10.1016/j.cytogfr.2009.02.004. [DOI] [PubMed] [Google Scholar]
- 23.Brooks GD, Buchta KA, Swenson CA, Gern JE, Busse WW. Rhinovirus-induced interferon-gamma and airway responsiveness in asthma. Am. J. Respir. Crit. Care Med. 2003;168:1091–1094. doi: 10.1164/rccm.200306-737OC. [DOI] [PubMed] [Google Scholar]
- 24.Barlow JL, et al. IL-33 is more potent than IL-25 in provoking IL-13-producing nuocytes (type 2 innate lymphoid cells) and airway contraction. J. Allergy Clin. Immunol. 2013;132:933–941. doi: 10.1016/j.jaci.2013.05.012. [DOI] [PubMed] [Google Scholar]
- 25.Bauer RN, et al. Influenza enhances caspase-1 in bronchial epithelial cells from asthmatic volunteers and is associated with pathogenesis. J. Allergy Clin. Immunol. 2012;130:958–967. doi: 10.1016/j.jaci.2012.07.013. [DOI] [PMC free article] [PubMed] [Google Scholar]
- 26.Hsu AC, See HV, Hansbro PM, Wark PA. Innate immunity to influenza in chronic airways diseases. Respirology. 2012;17:1166–1175. doi: 10.1111/j.1440-1843.2012.02200.x. [DOI] [PubMed] [Google Scholar]
- 27.Kawakami Y, et al. Inhibition of NK cell activity by IL-17 allows vaccinia virus to induce severe skin lesions in a mouse model of eczema vaccinatum. J. Exp. Med. 2009;206:1219–1225. doi: 10.1084/jem.20082835. [DOI] [PMC free article] [PubMed] [Google Scholar]
- 28.Biron CA, Brossay L. NK cells and NKT cells in innate defense against viral infections. Curr. Opin. Immunol. 2001;13:458–464. doi: 10.1016/S0952-7915(00)00241-7. [DOI] [PubMed] [Google Scholar]
- 29.Sakai K, et al. A mutant H3N2 influenza virus uses an alternative activation mechanism in TMPRSS2 knockout mice by loss of an oligosaccharide in the hemagglutinin stalk region. J. Virol. 2015;89:5154–5158. doi: 10.1128/JVI.00124-15. [DOI] [PMC free article] [PubMed] [Google Scholar]