Abstract
Several recent studies using either viral or transgenic mouse models have shown different results on whether the activation of parvalbumin-positive (PV+) neurons expressing channelrhodopsin-2 (ChR2) in the primary visual cortex (V1) improves the orientation- and direction-selectivity of V1 neurons. Although this discrepancy was thoroughly discussed in a follow-up communication, the issue of using different models to express ChR2 in V1 was not mentioned. We found that ChR2 was expressed in retinal ganglion cells (RGCs) and V1 neurons in ChR2fl/+; PV-Cre mice. Our results showed that the activation of PV+ RGCs using white drifting gratings alone significantly decreased the firing rates of V1 neurons and improved their direction- and orientation-selectivity. Long-duration activation of PV+ interneurons in V1 further enhanced the feature-selectivity of V1 neurons in anesthetized mice, confirming the conclusions from previous findings. These results suggest that the activation of both PV+ RGCs and V1 neurons improves feature-selectivity in mice.
Keywords: Parvalbumin neurons, Primary visual cortex, Retinal ganglion cells, Optogenetics
Introduction
In the mouse visual cortex, parvalbumin (PV)-expressing interneurons are one of the three major non-overlapping classes of inhibitory neurons, and comprise ~20% of all cortical neurons using γ-aminobutyric acid (GABA) as their neurotransmitter [1, 2]. Previous studies have suggested that PV interneurons contribute to primary visual cortex (V1) functions [3, 4]. Interestingly, strong optogenetic activation of PV interneurons markedly reduces the firing of pyramidal neurons and improves the direction-selectivity and orientation-tuning of V1 neurons [5]. On the other hand, moderate activation of PV neurons modulates the spiking responses to visual stimuli but has little effect on feature-selectivity [6]. In studies by Lee et al. and Atallah et al., channelrhodopsin-2 (ChR2) expression was induced by viral injection into V1, whereas Wilson et al. crossed ChR2fl with PV-Cre mice. Moreover, Li et al. used the same ChR2fl; PV-Cre mice to investigate how intracortical excitation affects thalamocortical input [9]. PV-expressing neurons not only exist in V1, but also in some amacrine cells and are prominent among the ganglion cells of the retina in mice [10]. It remains largely unknown whether ChR2 is expressed in PV+ retinal ganglion cells (RGCs) in ChR2fl; PV-Cre mice and, if so, whether activation of the PV+ RGCs affects the feature-selectivity.
Materials and Methods
Animals
All animal care and experiments were performed in accordance with the guidelines of the Fudan University Shanghai Medical College Animal Care and Use Committee. Pvalb-IRES-Cre mice (Stock #008069; Jackson Laboratory, Bar Harbor, ME) with Cre recombinase expression in PV cells [11] were crossed with loxP-flanked-ChR2-tdTomato mice (Stock #012567; Jackson Laboratory) to obtain ChR2fl/+; PV-Cre mice. Adult male C57BL/6J and ChR2fl/+; PV-Cre mice were housed at 25 ± 1 °C and 50 ± 5% humidity with a 12 h light/dark cycle (lights on from 07:00 to 19:00). We used only adult mice, and performed all experiments during the light cycle.
Genotyping
Genomic DNA was extracted from the tail of ChR2fl/+; PV-Cre mice using a DNeasy Blood & Tissue Kit (Qiagen, Hilden, Germany), and PV-Cre and ChR2flox were amplified separately. The PCR amplification of PV-Cre DNA was conducted with 40 cycles of denaturation at 94 °C for 30 s, annealing at 60 °C for 30 s, and elongation at 72 °C for 30 s. The PCR amplification of ChR2flox DNA was conducted with 35 cycles of denaturation at 94 °C for 30 s, annealing at 56 °C for 30 s, and elongation at 72 °C for 30 s. PV-Cre had a band at 500 bp, ChR2flox at 315 bp, and the wild-type at 297 bp.
Immunohistochemistry
For retinal immunostaining, adult retinas were sectioned at 12 μm on a cryomicrotome (CM1950, Leica, Wetzlar, Germany). The sections were permeabilized with 0.5% Triton-X100 in TBS (in mmol/L: 12.4 Tris, 37.7 Tris-HCl, 154.0 NaCl, pH 7.4) for 30 min, blocked with 10% donkey serum (Jackson ImmunoResearch, West Grove, PA) for 2 h at room temperature, and then incubated with anti-DsRed (1:500; TaKaRa Clontech, Shiga, Japan) overnight at 4 °C. After 5 washes in TBS (10 min each), donkey anti-rabbit secondary antibody (1:200; Jackson ImmunoResearch) was applied to the sections for another 2 h at room temperature in the dark. After 3 washes, the sections were stained with DAPI (1:3000) and then washed twice and mounted with Fluoromount-G (Southern Biotech, Birmingham, AL) for imaging.
For brain immunostaining, adult mice were perfused and the brains were fixed in 4% paraformaldehyde overnight and dehydrated in 30% sucrose for 48 h. Brain tissues were sectioned coronally at 30 μm on the cryomicrotome. Sections with the dorsal lateral geniculate nucleus (dLGN) and V1 were collected. After permeabilization with 0.5% Triton-X100 in TBS for 30 min and blocking in 10% donkey serum for 2 h at room temperature, the sections were incubated in anti-DsRed (1:500; TaKaRa Clontech) for 24 h at 4 °C and washed 5 times in TBS. The sections were then incubated with donkey anti-rabbit secondary antibody (1:200; Jackson ImmunoResearch) for 2 h at room temperature in the dark. After 3 washes with TBS, the sections were stained with DAPI (1:3000) and mounted with Fluoromount-G for imaging.
Monocular Enucleation
One eye was enucleated from ChR2fl/+; PV-Cre mice on postnatal day 21 (P21). Then the mice were returned to the rearing cage and three weeks after the surgery they were perfused with phosphate-buffered saline (PBS) followed by 4% paraformaldehyde (PFA). Brain tissues were stained using the immunohistochemistry procedures described above.
Patch-Clamp Recording
Mice were anesthetized with 10% chloral hydrate (0.3 mL per 100 g body weight). Retinas were dissected in Ringer’s solution consisting of (in mmol/L) 124 NaCl, 2.5 KCl, 2 CaCl2, 2 MgCl2, 26 NaHCO3, and 22 glucose, pH 7.35, oxygenated with 95% O2 and 5% CO2. Then the retinas were placed on a filter paper (Merck Millipore, Darmstadt, Germany) in the recording chamber. For brain slices, the slicing artificial cerebrospinal fluid (ACSF) consisted of (in mmol/L) 248 sucrose, 3 KCl, 0.5 CaCl2, 4 MgCl2, 1.25 NaH2PO4, 26 NaHCO3, and 10 glucose, pH 7.35. The recording ACSF consisted of (in mmol/L) 124 NaCl, 3 KCl, 2 CaCl2, 1 MgCl2, 1.25 NaH2PO4, 26 NaHCO3, and 10 glucose, pH 7.35. Both the slicing and recording ACSFs were oxygenated with 95% O2 and 5% CO2.
Action potentials were recorded using a MultiClamp 700B patch-clamp amplifier (Molecular Devices, Sunnyvale, CA), and digitized with Digidata 1440 (Molecular Devices) under a differential interference contrast microscope (Zeiss, Oberkochen, Germany) at room temperature. Glass micropipettes (5–10 MΩ) were pulled on a P-97 micropipette puller (Sutter Instruments, Novato, CA) and filled with internal solution (in mmol/L: 105 K-gluconate, 5 KCl, 0.5 CaCl2, 2 MgCl2, 5 EGTA, 10 HEPES, 4 Mg-ATP, 0.5 GTP-Na, 7 Na-phosphocreatine, and 0.05% Lucifer yellow, pH 7.4). Blue light was generated by a light-emitting diode (Polygon400; Mightex, Toronto, Canada) and focused through a 40× water-immersion objective. pClamp 10 (Molecular Devices) was used for data analysis.
The antagonists of glutamate receptors L-AP4 (50 µmol/L, L-(+)-2-amino-4-phosphonobutyric acid, Tocris, Bristol, UK), D-AP5 (50 µmol/L, D-(−)-2-amino-5-phosphonopentanoic acid, Tocris), and NBQX (20 µmol/L, 2,3-dioxo-6-nitro-1,2,3,4-tetrahydrobenzo[f]quinoxaline-7-sulfonamide, Tocris) were added to the extracellular fluid and applied to the recorded retina by bath perfusion.
In Vivo Electrophysiology
Mice aged P21–P40 were deeply anaesthetized with 2.5% isoflurane in oxygen for 20 min before surgery. The nose and mouth were placed in a respiratory mask and infused with 0.5%–1% isoflurane. The mice were kept on a heating pad (FHC Inc., Bowdoin, ME). Before surgery, lidocaine (10 mg/mL in saline; MP Biomedicals, Santa Ana, CA) was injected under the scalp. After removing the scalp, the front and back of the skull were glued to two copper rods and assembled onto a rotatable mounting platform (Thorlabs Inc., Newton, NJ). A craniotomy window in the skull was made stereotaxically over the V1 area according to the mouse brain atlas, and the dura was carefully removed. The craniotomy was filled with sterile buffered saline (in mmol/L: 150 NaCl, 2.5 KCl, and 10 HEPES, pH 7.4) throughout the recording. The recording platform was carefully adjusted such that the craniotomy plane was at right-angles to the electrodes. The electrodes were carried on micromanipulators (Scientifica, East Sussex, UK) and slowly inserted into layer IV (~400 μm below the cortical surface) of V1. Electrical signals were amplified (Microelectrode AC Amplifier 1800, A-M Systems, Inc., WA), high-pass filtered at 1 Hz and sampled at 20 kHz using Power 1401 (Cambridge Electronic Design, Cambridge, UK).
Visual and Optogenetic Activation
Visual stimuli were generated by Keynote and presented on an LCD monitor (15 cm × 9 cm, 1280 × 1024 pixels, 60 Hz; Feelworld, Shenzhen, China) with a mean luminance of 300 cd/m2. The monitor was placed 10 cm from one eye, subtending an angle of 36.9° horizontally and 24.2° vertically. To measure the direction- and orientation-selectivity of V1 neurons, white square-wave drifting gratings (0.04 cpd/deg, 100% contrast, 2 Hz) were presented at 8 directions (separated by 45°) in a pseudorandom sequence. The stimulus consisted of a 1-s drifting grating, followed by a 4-s gray background. Six repetitions were presented in each experiment.
A black-and-white grating on the LCD monitor was used to optogenetically activate PV+ RGCs for 1 s at 5-s intervals. A 473-nm blue laser (6–8 mW; DPSS, Biogene, Hong Kong, China) was used to optogenetically stimulate V1 throughout the whole process of drifting grating stimulation to the contralateral eye.
Stereotaxic Injection and Optogenetic Stimulation in the dLGN
AAV-flox-ChR2 virus (Obio Technology, Shanghai, China) was injected stereotaxically (RWD Life Sciences, Shenzhen, China) into the dLGN (x = 2.13 cm, y = ±2.07 cm, z = 2.75 cm, when the distance from bregma to lambda was 4.2 cm). A 473-nm blue laser (6–8 mW; DPSS, Biogene, Hongkong, China) was used to optogenetically stimulate the dLGN for 1 s at 5-s or 10-s intervals. Simultaneous recordings were made from V1 neurons using a multi-electrode array.
Data Analysis
The electrophysiological data recorded using spike2 software (Cambridge Electronic Design Limited, Cambridge, UK) were processed using a finite impulse response filter above 300 Hz, then sorted in Offline Sorter (waveform length 800 μs, pre-threshold period 200 μs, dead time 500 μs; Plexon Inc., Dallas, TX). The firing rate was calculated by Spike2 software and MatLab (Mathworks, Natick, MA). Data were discarded if the average firing rate was <2 Hz. The direction-selectivity index (DSI) and orientation selectivity index (OSI) were defined by the following functions: DSI = (Rpref − Rnull)/(Rpref + Rnull) and OSI = (Rpref − Rorth)/(Rpref + Rorth), where Rpref is the firing rate of neurons in the preferred direction or orientation, Rnull is the firing rate in the direction opposite to the preferred direction, and Rorth is the average firing rate in the direction orthogonal to the preferred orientation. The global orientation selectivity index (gOSI) of visual responses was calculated as follows: , where the angles of the grating stimuli varied from 0° to 315°, and R(θ) is the response magnitude at each angle. We fitted the firing rate as a function of orientation by two Gaussian functions with peaks 180° apart: , in which a0 is the untuned component of the response, a1 and a2 are the amplitudes of the two Gaussians, θ0 is the preferred orientation, and σ is the standard deviation of the Gaussian function. Tuning width was measured as σ. Data were analyzed statistically using the Kolmogorov–Smirnov (K–S) test and linear regression. In all cases, a difference was considered significant when P < 0.05. Error bars represent the SEM, and N is the number of animals.
Results
Expression of ChR2 in the Retina and V1 of ChR2fl/+; PV-Cre Mice
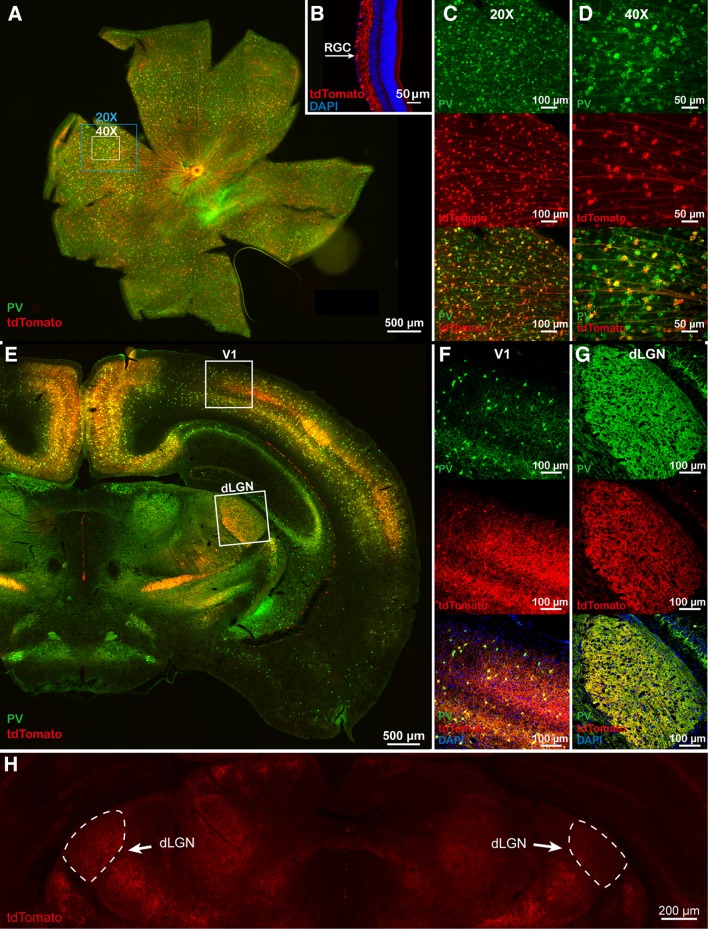
We used ChR2-tdTomatofl/+; PV-Cre mice to visualize ChR2 expression, and fluorescence signals were detected in RGCs (Fig. 1A–D), V1 cells (Fig. 1F), and the dLGN (Fig. 1G) on P21. Over 92% of the PV interneurons in V1 expressed ChR2 in ChR2-tdTomatofl/+; PV-Cre mice (Table 1; n = 19 slices from 4 mice), and 42% of the PV neurons in the retina expressed ChR2 (Table 2; n = 4 retinas from 2 mice). Fluorescence in the dLGN could be attributed to Cre-expressing dLGN cells, the axons of Cre-expressing RGCs, or corticothalamic axons. Therefore, to clarify this, we conducted monocular enucleation in ChR2fl/+; PV-Cre mice on P21, and three weeks later found that the fluorescence intensity in the dLGN decreased (Fig. 1H), consistent with previous reports [12]. As there are very few neuronal cell bodies in the dLGN, this result suggested that the retinal and (or) corticothalamic axons contributed to the fluorescence signals in the dLGN.
Fig. 1.
Immunohistochemistry of ChR2-tdTomato in the retina, dLGN, and V1 of ChR2fl/+; PV-Cre mice. A PV and ChR2 expression in the retina. B Expression of ChR2 in a 12-μm retinal section. C–D High magnification images of the areas labeled by the squares in A. E PV and ChR2 expression in the dLGN and V1. F High magnification of the area (V1) enclosed by the upper square in E. G High magnification of the area (dLGN) enclosed by the lower square in E. H ChR2 expression after monocular enucleation. The left dLGN was ipsilateral to the enucleated eye, whereas the right dLGN was contralateral to the enucleated eye.
Table 1.
Numbers of V1 neurons expressing PV and ChR2.
| Mouse | Slice | PV | ChR2 | Merge | Merge/PV (%) |
|---|---|---|---|---|---|
| #1 | 1 | 67 | 64 | 64 | 95.52 |
| 2 | 76 | 69 | 69 | 90.79 | |
| #2 | 3 | 104 | 97 | 97 | 93.27 |
| 4 | 76 | 73 | 73 | 96.05 | |
| 5 | 73 | 72 | 72 | 98.63 | |
| 6 | 67 | 66 | 66 | 98.51 | |
| 7 | 79 | 75 | 75 | 94.94 | |
| 8 | 74 | 70 | 70 | 94.59 | |
| #3 | 9 | 187 | 166 | 163 | 87.17 |
| 10 | 179 | 168 | 164 | 91.62 | |
| 11 | 87 | 82 | 80 | 91.95 | |
| 12 | 91 | 86 | 83 | 91.21 | |
| 13 | 87 | 82 | 80 | 91.95 | |
| 14 | 91 | 86 | 83 | 91.21 | |
| 15 | 155 | 141 | 137 | 88.39 | |
| 16 | 142 | 132 | 131 | 92.25 | |
| #4 | 17 | 68 | 63 | 62 | 91.18 |
| 18 | 96 | 88 | 88 | 91.67 | |
| 19 | 213 | 198 | 198 | 92.96 | |
| Average | 106 | 99 | 98 | 92.83 |
Table 2.
Numbers of neurons expressing PV and ChR2 in the retina.
| Retina | PV | ChR2 | Merge | Merge/PV (%) |
|---|---|---|---|---|
| #1 | 1781 | 2666 | 691 | 38.80 |
| #2 | 2346 | 2038 | 899 | 38.32 |
| #3 | 4571 | 3376 | 2153 | 47.10 |
| #4 | 4462 | 2837 | 2059 | 46.15 |
| Average | 3290 | 2729 | 1451 | 42.59 |
Activation of PV+ RGCs Enhances Both Direction- and Orientation-Selectivity in V1
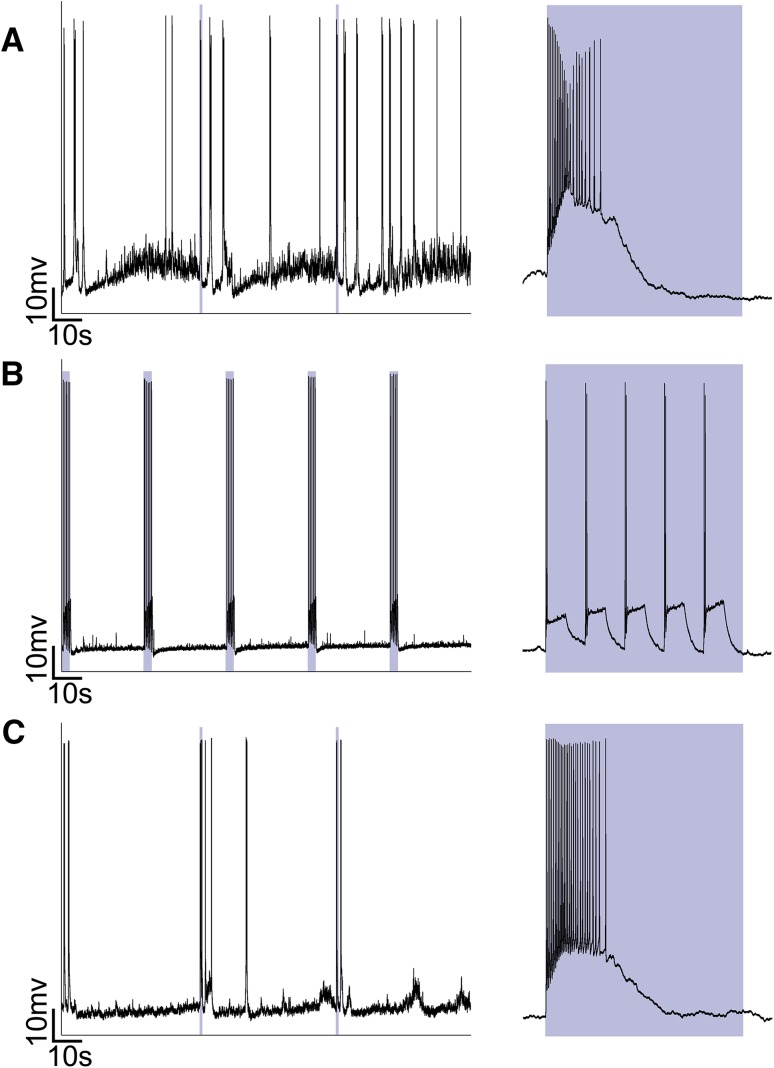
We used whole-cell recording to confirm the optogenetic activation of PV+ RGCs (Fig. 2). PV+ RGCs responded to 470-nm blue light with a high firing rate (Fig. 2A). After blocking the photoreceptor-mediated light responses by applying the mGluR antagonists L-AP4, D-AP5, and NBQX, the PV+ RGCs responded to the 470-nm stimulus with a relatively low firing rate, indicating that 470-nm light optogenetically activates PV+ RGCs (Fig. 2B). At 10 min after drug washout, we found that PV+ RGCs responded to the light with a high firing rate, as before the drug application (Fig. 2C). Thus, we conclude that PV+ RGCs can express ChR2 and be optogenetically activated by 470-nm light.
Fig. 2.
Optogenetic activation of PV+ RGCs in the retina of ChR2fl/+; PV-Cre mice. A Whole-cell recordings from PV+ RGCs. Right panel, response to 1 s exposure to blue light. B Whole-cell recordings in the presence of the mGluR antagonists L-AP4, D-AP5, and NBQX. Right panel, response of a PV+ RGC to 1 s exposure to blue light. C Whole-cell recordings from PV+ RGCs at 10 min after washout of the mGluR antagonists. Right panel, response to 1 s exposure to blue light. Light-blue square indicates light stimulus.
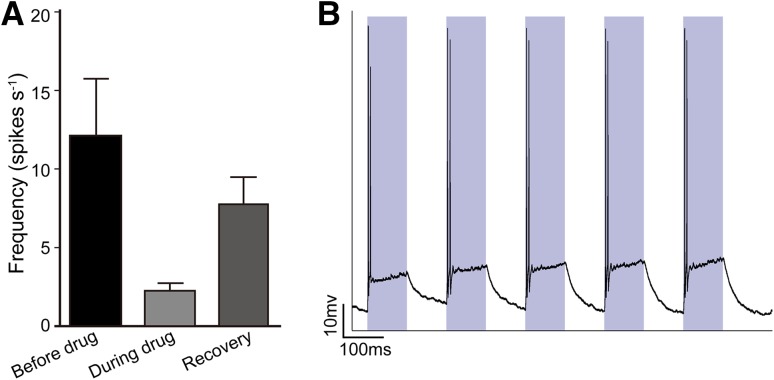
We applied the same mGluR antagonists intravitreously in vivo and found that drifting gratings from the LCD initiated optogenetic responses in V1 neurons after drug application (Fig. 3A). Whole-cell recordings from PV+ interneurons of V1 in brain slices confirmed that 470-nm light directly activated them in ChR2fl/+; PV-Cre mice (Fig. 3B).
Fig. 3.
A V1 responses to drifting gratings after intravitreous application of mGluR antagonists in vivo. B Whole-cell recording from a PV+ interneuron in V1 in an acute mouse brain slice.
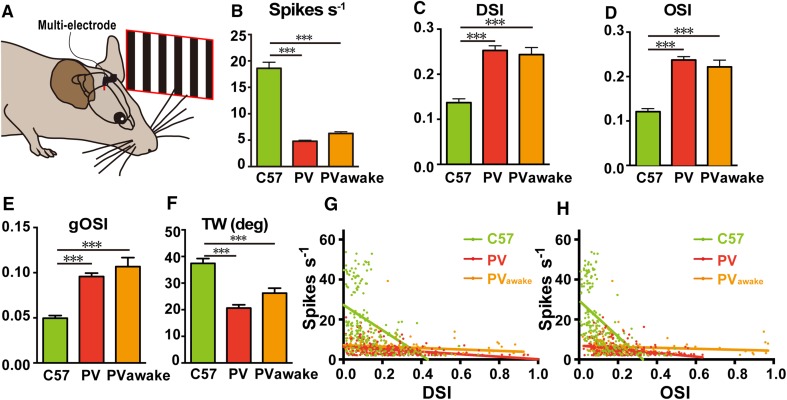
We next determined whether the activity of ChR2-expressing PV+ RGCs affects visual selectivity by comparing the responses of V1 neurons to drifting gratings in C57 wild-type and ChR2fl/+; PV-Cre mice (Fig. 4A). We recorded the spiking of neurons in V1 with multi-electrodes, sorted them into fast-spiking and regular-spiking types, and included both types in the analysis. The average firing rates of V1 neurons upon stimulation with white drifting gratings were significantly decreased in both anesthetized and awake, behaving ChR2fl/+; PV-Cre mice (Fig. 4B). The DSI, OSI, and gOSI of V1 neurons all increased significantly in anesthetized and awake, behaving ChR2fl/+; PV-Cre mice (Fig. 4C–E), together with a decrease in the tuning width (Fig. 4F). These data indicated that activation of PV+ RGCs improves the direction- and orientation-selectivity in V1 neurons. We plotted the DSI of V1 neurons against the average firing rate (Fig. 4G), and found that it was independent of the rate. Similarly, the OSI of V1 neurons was not dependent on their firing rates (Fig. 4H).
Fig. 4.
Optogenetic activation of PV+ RGCs in anesthetized and awake behaving mice. A Schematic of the visual stimulation experiments. The multi-electrode array was inserted into V1. Black-and-white drifting gratings were presented to the contralateral eye. B–H Responses of V1 neurons to drifting gratings in anesthetized C57 (207 cells in 6 mice), and anesthetized (276 cells in 19 mice) or awake (169 cells in 5 mice) ChR2fl/+; PV-Cre mice in terms of firing rate (B), DSI (C), OSI (D), gOSI (E), tuning width (F), DSI versus average firing rate (G), and OSI versus average firing rate (H). Mean ± SEM; ***P < 0.001.
Activation of PV+ Interneurons in V1 Further Enhances Feature-Selectivity
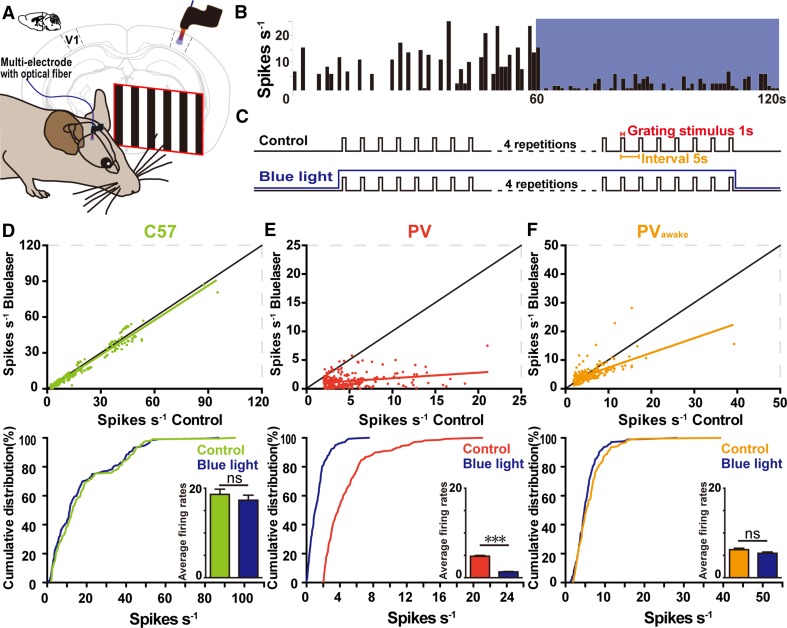
The spontaneous firing rates of V1 neurons decreased when ChR2-expressing PV+ interneurons in V1 were stimulated by blue light in anesthetized ChR2fl/+; PV-Cre mice (Fig. 5A, B). We then recorded V1 responses to drifting gratings (1 s duration, 5 s intervals) while activating PV+ V1 neurons with blue light throughout the stimulation process (Fig. 5C), and found that blue light did not change the firing rates in anesthetized C57 mice (Fig. 5D). However, activation of PV+ interneurons significantly decreased the firing rates of V1 neurons in anesthetized ChR2fl/+; PV-Cre mice (Fig. 5E), and had a weak impact on the firing rates of V1 neurons in awake behaving ChR2fl/+; PV-Cre mice (Fig. 5F).
Fig. 5.
Changes of firing rate in V1 neurons in response to optogenetic stimulation. A Schematic of the optogenetic stimulation experiment. B Blue light presented to V1 significantly decreased the spontaneous firing rates of V1 neurons in anaesthetized ChR2fl/+; PV-Cre mice. C Schematic of optogenetic stimulation experiments. Blue light was presented during exposure to drifting gratings. D–F Cumulative percentage firing rates in anesthetized C57 mice (D; P = 0.608, K–S test), anesthetized ChR2fl/+; PV-Cre mice (E; P < 0.001, K–S test), and awake ChR2fl/+; PV-Cre mice (F; P = 0.5961, K–S test). Insets in D–F, mean firing rates with and without light stimulation. Green, anesthetized C57 mice; red, ChR2fl/+; PV-Cre mice (PV); orange, awake ChR2fl/+; PV-Cre mice (PVawake); dark blue, data from mice with blue light.
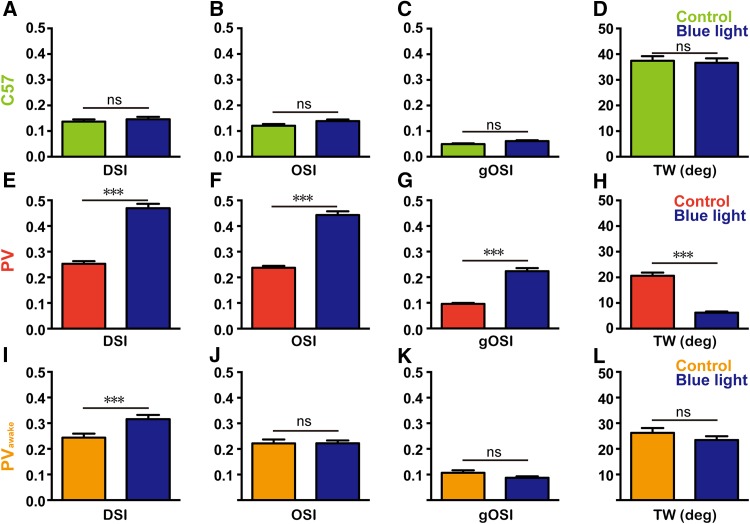
Consistent with the results on firing rates, blue light stimulation did not affect the DSI, OSI, gOSI, or tuning width of V1 neurons in anesthetized C57 mice (Fig. 6A–D). The activation of PV+ interneurons increased the DSI, OSI, and gOSI of V1 neurons in anaesthetized ChR2fl/+; PV-Cre mice (Fig. 6E–G) and decreased the tuning width (Fig. 6H). In awake, behaving ChR2fl/+; PV-Cre mice, optogenetic stimulation of the PV+ interneurons significantly enhanced the direction-selectivity of V1 neurons, but had no significant effect on their OSI, gOSI, and tuning width (Fig. 6I–L).
Fig. 6.
Changes of visual features during optogenetic stimulation in V1. A–D Mean DSI (P = 0.945), OSI (P = 0.543), gOSI (P = 0.248), and tuning width (TW) (P = 0.060) with and without blue light stimulation in C57 mice. E–H Mean DSI (P < 0.001), OSI (P < 0.001), gOSI (P < 0.001), and TW (P < 0.001) with and without light stimulation in anesthetized ChR2fl/+; PV-Cre mice. I–L Mean DSI (P < 0.001), OSI (P = 0.051), gOSI (P = 0.813), and TW (P = 0.256) with and without light stimulation in awake ChR2fl/+; PV-Cre mice. Green, data from anesthetized C57 mice; red, from anesthetized ChR2fl/+; PV-Cre mice (PV); orange, from awake ChR2fl/+; PV-Cre mice (PVawake) without laser stimulation; and dark-blue, optogenetic stimulation in V1 (P values from K–S tests).
Activation of Sparse PV Neurons in the dLGN has no Effect on the Activity of V1 Neurons
Having shown that ChR2 was expressed very sparsely in dLGN neurons (Fig. 1G), in order to determine whether PV neurons in the dLGN affect the visual selectivity of V1 neurons, AAV-ChR2-flox virus was injected into the dLGN of PV-Cre mice and electrophysiological recordings made 4 weeks later (Fig. 7A). A few dLGN neurons expressed ChR2-tdTomato (Fig. 7B), and the firing rates of V1 neurons were similar with or without optogenetic stimulation of the dLGN (Fig. 7C–D).
Fig. 7.
Firing rates of V1 neurons with optogenetic stimulation of PV neurons in the dLGN. A Schematic of the dLGN stimulation experiments. A multi-electrode array was inserted into V1, while an optical fiber was inserted into the dLGN. B Arrowhead shows the expression of ChR2-tdTomato in the dLGN after virus injection. C, D The firing rates of V1 neurons during stimulation did not differ from those during the 5-s (P = 0.109) or the 10-s inter-stimulus interval (P = 0.665, K–S test).
Discussion
Several recent studies have addressed the question of how cortical PV+ neurons affect direction- and orientation-selectivity in V1 [5–7]. Lee et al. and Atallah et al. both used virus-mediated expression of ChR2 in PV+ neurons in V1, so there was no ChR2 expression in the retina. They both found that activation of PV+ neurons for 4 s enhanced the direction-selectivity and decreased the tuning width in V1 in anesthetized mice. Lee et al. later reported similar results in awake mice. On the other hand, Wilson et al. used ChR2fl/+; PV-Cre mice, which express ChR2 in RGCs. By optogenetically stimulating the PV+ neurons in V1 for 1 s in awake mice, they found no changes in the direction- and orientation-selectivity. In a follow-up communication, Lee et al., Atallah et al., and Wilson et al. discussed possible reasons for the discrepancy: when there was a large reduction in the firing rate (in other words using 4-s instead of 1-s optogenetic stimuli), the selectivity was enhanced and the tuning width was reduced based on a linear-threshold model [8]. Our results provide clear evidence that optogenetic activation of the PV+ RGCs significantly reduced the firing rates of V1 neurons in ChR2fl/+; PV-Cre mice. Therefore, in the study by Wilson et al., the baseline firing rates of V1 neurons were significantly lower to begin with, so the unchanged selectivity and tuning width in their study may be attributed to the low baseline firing and the short duration of optogenetic stimulation.
We found that the activation of PV+ RGCs enhanced the direction- and orientation-selectivity of V1 neurons in anesthetized ChR2fl/+; PV-Cre mice, while only direction-selectivity was enhanced in awake mice. This difference is likely due to the higher firing rates of V1 neurons in the awake state [17, 18]. These results are consistent with the linear-threshold model in the follow-up communication [8].
Direction-selective ganglion cells (DSGCs) are a subset of RGCs that detect directional motion in the visual field. DSGCs project to a specialized subdivision of the dLGN, which then connects to the superficial layer of V1 [13, 14]. About 28% of RGCs in the mouse retina express PV, and these are subpopulations of each RGC type including DSGCs [15]. Since DSGCs are linked to neurons in the superficial layer of V1 through dLGN neurons [13], activation of ChR2-expressing PV+ DSGCs may directly affect feature-selectivity in V1 neurons. The activation of PV+ RGCs may modulate activity in the dLGN, which in turn decreases the firing rate of V1 neurons. Optogenetic stimulation of the dLGN provides the possibility of exploring whether the activity of dLGN neurons improves the feature-selectivity of V1 neurons [16]. And we found that direct stimulation of the dLGN by blue light did not change the firing rate of V1 neurons.
In previous studies, an increase in the direction- and orientation-selectivity has been shown to be accompanied by a decrease in the firing rate, based on the equation DSI = (Rpref − Rnull)/(Rpref + Rnull) [8]. We found that the firing rate upon light stimulation was linearly correlated with that without such stimulation (Fig. 3D and E). Therefore, Rpref, light = aRpref + b, Rnull, light = aRnull + b where a is <0.5 and b < 0. The DSI with light stimulation is DSIlight = [a(Rpref − Rnull)]/[a(Rpref + Rnull) + 2b]. The ratio between DSIlight and DSI is: DSIlight/DSI = a(Rpref + Rnull)/[a(Rpref + Rnull) + 2b]. When b < 0, DSIlight/DSI > 1, which is consistent with our results that both the DSI and OSI were larger given the linear relationship. Similar results applied to the change of OSI upon light stimulation. Therefore, the change of DSI or OSI is not simply correlated with an increase or decrease in the firing rate but how the firing rate changes.
Taken together, our study provides the first evidence that activation of PV+ RGCs in the mouse visual pathway enhances feature-selectivity in V1 neurons.
Acknowledgements
This work was supported by the grants of National Natural Science Foundation of China (31271158, 31421091, and 31422025), the Science and Technology Commission of Shanghai Municipality, China (13PJ1401000), the Young 1000 Plan and the Ministry of Science and Technology of China (2015AA020512).
Footnotes
Jinggang Duan and Hang Fu have contributed equally to this work.
References
- 1.Markram H, Toledo-Rodriguez M, Wang Y, Gupta A, Silberberg G, Wu C. Interneurons of the neocortical inhibitory system. Nat Rev Neurosci. 2004;5:793–807. doi: 10.1038/nrn1519. [DOI] [PubMed] [Google Scholar]
- 2.Xu X, Roby KD, Callaway EM. Immunochemical characterization of inhibitory mouse cortical neurons: Three chemically distinct classes of inhibitory cells. J Comp Neurol. 2010;518:389–404. doi: 10.1002/cne.22229. [DOI] [PMC free article] [PubMed] [Google Scholar]
- 3.Niell CM, Stryker MP. Highly selective receptive fields in mouse visual cortex. J Neurosci. 2008;28:7520–7536. doi: 10.1523/JNEUROSCI.0623-08.2008. [DOI] [PMC free article] [PubMed] [Google Scholar]
- 4.Katzner S, Busse L, Carandini M. GABAA inhibition controls response gain in visual cortex. J Neurosci. 2011;31:5931–5941. doi: 10.1523/JNEUROSCI.5753-10.2011. [DOI] [PMC free article] [PubMed] [Google Scholar]
- 5.Lee SH, Kwan AC, Zhang S, Phoumthipphavong V, Flannery JG, Masmanidis SC, et al. Activation of specific interneurons improves V1 feature selectivity and visual perception. Nature. 2012;488:379–383. doi: 10.1038/nature11312. [DOI] [PMC free article] [PubMed] [Google Scholar]
- 6.Atallah BV, Bruns W, Carandini M, Scanziani M. Parvalbumin-expressing interneurons linearly transform cortical responses to visual stimuli. Neuron. 2012;73:159–170. doi: 10.1016/j.neuron.2011.12.013. [DOI] [PMC free article] [PubMed] [Google Scholar]
- 7.Wilson NR, Runyan CA, Wang FL, Sur M. Division and subtraction by distinct cortical inhibitory networks in vivo. Nature. 2012;488:343–348. doi: 10.1038/nature11347. [DOI] [PMC free article] [PubMed] [Google Scholar]
- 8.Lee SH, Kwan AC, Dan Y. Interneuron subtypes and orientation tuning. Nature. 2014;508:E1–E2. doi: 10.1038/nature13128. [DOI] [PubMed] [Google Scholar]
- 9.Li YT, Ibrahim LA, Liu BH, Zhang LI, Tao HW. Linear transformation of thalamocortical input by intracortical excitation. Nat Neurosci. 2013;16:1324–1330. doi: 10.1038/nn.3494. [DOI] [PMC free article] [PubMed] [Google Scholar]
- 10.Haverkamp S, Wässle H. Immunocytochemical analysis of the mouse retina. J Comp Neurol. 2000;424:1–23. doi: 10.1002/1096-9861(20000814)424:1<1::AID-CNE1>3.0.CO;2-V. [DOI] [PubMed] [Google Scholar]
- 11.Madisen L, Zwingman TA, Sunkin SM, Oh SW, Zariwala HA, Gu H, et al. A robust and high-throughput Cre reporting and characterization system for the whole mouse brain. Nat Neurosci. 2010;13:133–140. doi: 10.1038/nn.2467. [DOI] [PMC free article] [PubMed] [Google Scholar]
- 12.Gonzalez D, Satriotomo I, Miki T, Lee KY, Yokoyama T, Touge T, et al. Changes of parvalbumin immunoreactive neurons and GFAP immunoreactive astrocytes in the rat lateral geniculate nucleus following monocular enucleation. Neurosci Lett. 2006;395:149–154. doi: 10.1016/j.neulet.2005.10.067. [DOI] [PubMed] [Google Scholar]
- 13.Cruz-Martín A, El-Danaf RN, Osakada F, Sriram B, Dhande OS, Nguyen PL, et al. A dedicated circuit links direction-selective retinal ganglion cells to the primary visual cortex. Nature. 2014;507:358–361. doi: 10.1038/nature12989. [DOI] [PMC free article] [PubMed] [Google Scholar]
- 14.Kloc M, Maffei A. Target-specific properties of thalamocortical synapses onto layer 4 of mouse primary visual cortex. J Neuroscience. 2014;34:15455–15465. doi: 10.1523/JNEUROSCI.2595-14.2014. [DOI] [PMC free article] [PubMed] [Google Scholar]
- 15.Kim TJ, Jeon CJ. Morphological Classification of Parvalbumin-Containing Retinal Ganglion Cells in Mouse: Single-Cell Injection after Immunocytochemistry. Investig Opthalmol Vis Sci. 2006;47:2757. doi: 10.1167/iovs.05-1442. [DOI] [PubMed] [Google Scholar]
- 16.Castonguay A, Thomas S, Lesage F, Casanova C. Repetitive and retinotopically restricted activation of the dorsal lateral geniculate nucleus with optogenetics. PLoS One. 2014;9:e94633. doi: 10.1371/journal.pone.0094633. [DOI] [PMC free article] [PubMed] [Google Scholar]
- 17.Goltstein PM, Montijn JS, Pennartz CMA. Effects of isoflurane anesthesia on ensemble patterns of Ca2+ activity in mouse v1: reduced direction selectivity independent of increased correlations in cellular activity. PLoS One. 2015;10:e0118277. doi: 10.1371/journal.pone.0118277. [DOI] [PMC free article] [PubMed] [Google Scholar]
- 18.Hudetz AG, Vizuete JA, Pillay S, Ropella KM. Critical changes in cortical neuronal interactions in anesthetized and awake rats. Anesthesiology. 2015;123:171–180. doi: 10.1097/ALN.0000000000000690. [DOI] [PMC free article] [PubMed] [Google Scholar]


