Abstract
The relative contribution of the effector molecules produced by T cells to tumour rejection is unclear, but interferon-γ (IFNγ) is critical in most of the analysed models1. Although IFNγ can impede tumour growth by acting directly on cancer cells2,3, it must also act on the tumour stroma for effective rejection of large, established tumours4,5. However, which stroma cells respond to IFNγ and by which mechanism IFNγ contributes to tumour rejection through stromal targeting have remained unknown. Here we use a model of IFNγ induction and an IFNγ–GFP fusion protein in large, vascularized tumours growing in mice that express the IFNγ receptor exclusively in defined cell types. Responsiveness to IFNγ by myeloid cells and other haematopoietic cells, including T cells or fibroblasts, was not sufficient for IFNγ-induced tumour regression, whereas responsiveness of endothelial cells to IFNγ was necessary and sufficient. Intravital microscopy revealed IFNγ-induced regression of the tumour vasculature, resulting in arrest of blood flow and subsequent collapse of tumours, similar to non-haemorrhagic necrosis in ischaemia and unlike haemorrhagic necrosis induced by tumour necrosis factor. The early events of IFNγ-induced tumour ischaemia resemble non-apoptotic blood vessel regression during development, wound healing or IFNγ-mediated, pregnancy-induced remodelling of uterine arteries6–8. A better mechanistic understanding of how solid tumours are rejected may aid the design of more effective protocols for adoptive T-cell therapy.
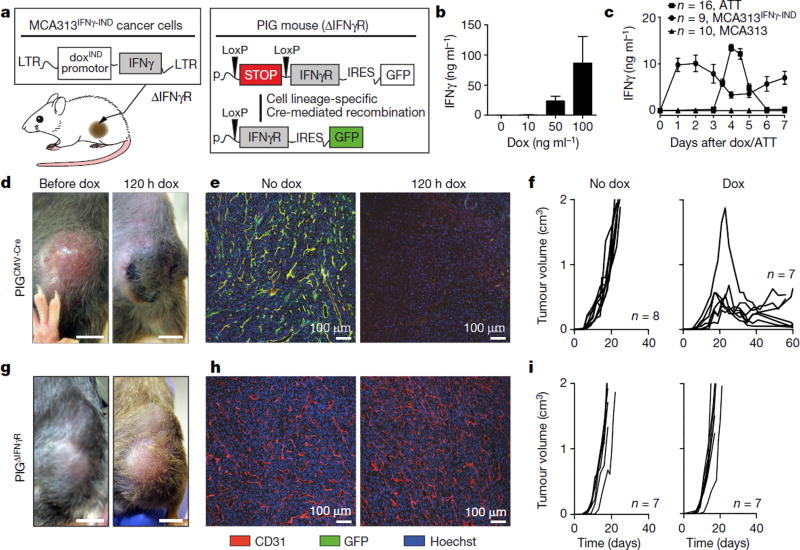
The contribution of T-cell effector molecules to tumour rejection has mainly been studied in models of low tumour burden with little tumour stroma1,9. For IFNγ -mediated effects, various cell types have been suggested as targets, such as the cancer cells themselves, macrophages, fibroblasts, monocytes or endothelial cells10–18. Most cells of the body express the IFNγ receptor (IFNγR). IFNγ inhibits neoangiogenesis and prevents the development of tumours from inoculated cancer cells12,13, but the effects of IFNγ on blood vessels of large established tumours are poorly understood. As human cancers are usually at least 1 cm in diameter when they are first detected, studying the effects of IFNγ on the vasculature of such tumours is clinically relevant. We transduced the fibrosarcoma cell line MCA313, derived from a methylcholanthrene-treated IFNγR-deficient C57BL/6 (IFNγR−) mouse, with a retrovirus allowing doxycycline (dox)-mediated regulation of IFNγ expression (MCA313IFNγ-IND)19,20 (Fig. 1a). MCA313IFNγ-IND cells produced IFNγ upon treatment with dox (around 87 ng ml−1), but not in its absence (Fig. 1b). When IFNγ was induced in large MCA313IFNγ-IND tumours in immunocompromised Rag-deficient (Rag−) mice, serum levels reached a peak of around 10 ng ml−1 48 h after dox administration (Fig. 1c). Induction of IFNγ in two- to three-week-old large MCA313IFNγ-IND tumours in C57BL/6 wild-type mice led to tumour regression, macroscopic and microscopic necrosis, and loss of tumour endothelial (CD31+) cells (Extended Data Fig. 1a–c). Tumour regression was observed in wild-type but not in IFNγR− mice (Extended Data Fig. 1a). MCA313IFNγ-IND tumours grew with similar kinetics and regressed similarly upon IFNγ induction in wild-type and Rag− mice, indicating their low immunogenicity (Extended Data Fig. 1a). To determine whether dox-induced IFNγ levels were comparable to those achieved by antigen-specific T cells that rejected established tumours of a similar size, we treated Rag− mice bearing 16.113 adenocarcinomas with CD8+ T cells, which are specific for SV40 large T antigen expressed by 16.113 cells (TCR-I T cells), and determined IFNγ serum levels 3–7 days after T-cell transfer. On day 4, around 13 ng ml−1 IFNγ was detected (Fig. 1c) and tumours were subsequently rejected (Extended Data Fig. 1d). Thus, IFNγ expression in large MCA313IFNγ-IND tumours was comparable to that of effector T cells during tumour rejection and was sufficient to induce tumour regression, when only tumour stroma, and no cancer cells, could respond to IFNγ. Similarly, IFNγ induction in large IFNγ-insensitive 16.113-999IFNγ-IND adenocarcinomas resulted in tumour regression and a reduction in tumour endothelial cells (Extended Data Fig. 1e–g).
Figure 1. Reductionist model to identify the stromal target for IFNγ-induced tumour regression.
a, Experimental system consisting of IFNγR− cancer cells, MCA313, with dox-inducible IFNγ expression (MCA313IFNγ-IND) and transgenic mice with inducible IFNγR expression in defined cell types (PIG mice: Cre/LoxP-excision of stop-cassette allows CAG-promoter-driven expression of IFNγ R and GFP on an IFNγR− genetic background). b, Dox-dependent IFNγ expression by MCA313IFNγ-IND cells in vitro (ELISA, mean and s.d. of three experiments). c, Similar IFNγ serum peak levels produced by MCA313IFNγ-IND (but not MCA313, triangles) tumours (peak day 2 after dox, tumours 790 ± 260 mm3, filled circles) and CD8+ T cells during rejection of 16.113 tumours (peak day 4 after adoptive T-cell therapy (ATT), tumours 584 ± 153 mm3, filled squares), mean ± s.e.m. d-f, Dox-induced IFNγ expression in MCA313IFNγ-IND tumours of PIGCMV-Cre mice leads to necrosis (d; n = 2). e, f, Blood vessel reduction (n = 2) within 120 h (e) and tumour regression after dox application at a tumour size of 613 ± 467 mm3 (f). Combined data of two experiments. g-i, No effect as in d-f in control PIGΔIFNγR mice. Scale bars, 0.5 cm (d, g). i, Dox at a tumour size of 562 ± 65 mm3. Combined data of two experiments. The number of mice, replications and sample size for each experiment are shown in Supplementary Table 3.
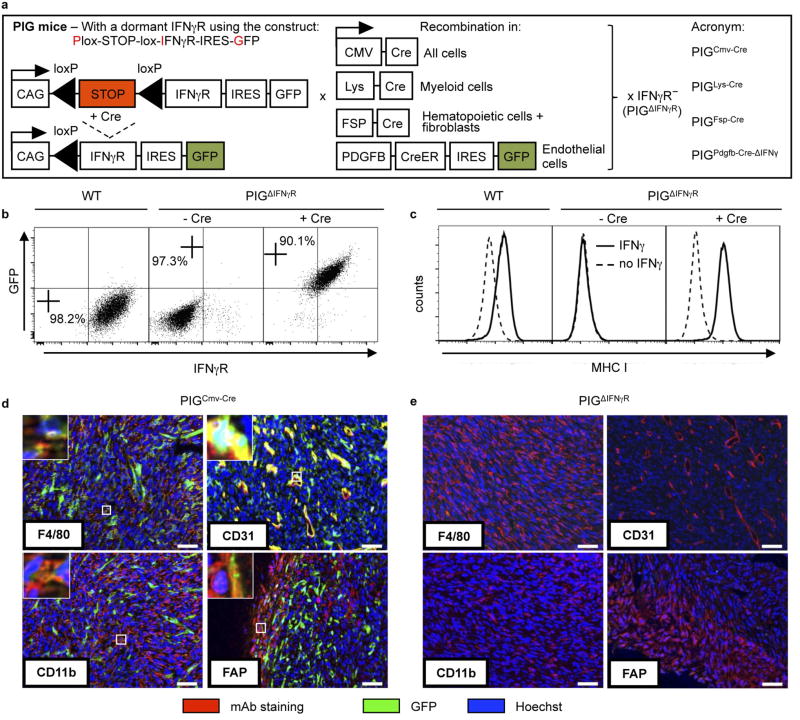
To identify the target stromal cells of IFNγ, we generated mice with exclusive IFNγR expression in defined cell types. In these mice, the Ifngr1 transgene is linked to a GFP reporter gene by an internal ribosome entry site (IRES) and separated from a ubiquitous promoter by a Cre-recombinase-excisable stop cassette (pCAGloxPStoploxP-IFNγ R-IRES-GFP, denoted hereafter as PIG mice; Fig. 1a, Extended Data Fig. 2a). The mice were crossed to IFNγR− mice to inactivate the endogenous Ifngr1 gene (PIGΔIFNγR). Expression of the Cre recombinase in fibroblasts from PIGΔIFNγR mice led to IFNγR (CD119) and GFP expression (Extended Data Fig. 2b). IFNγ exposure caused upregulation of major histocompatibility complex I (MHC-I) comparable to wild-type fibroblasts, demonstrating the function and tight regulation of IFNγR (Extended Data Fig. 2c). We generated PIGΔIFNγR × CMV-Cre mice, in which expression of Cre recombinase is ubiquitously driven by the human CMV promoter (PIGCMV-Cre mice). Most stromal cells of MCA313IFNγ-IND tumours grown in PIGCMV-Cre mice were GFP+, as analysed for CD11b+ (myeloid), F4/80+ (macrophages), CD31+ (endothelial) and FAP+ (mesenchymal) cells (Extended Data Fig. 2d). Most cells in the peripheral blood (T cells, B cells, natural killer cells, CD11b+, CD11c+ and GR1+ cells) were GFP+ (Supplementary Table 1a). No GFP+ cells were detected in MCA313IFNγ-IND tumours of PIGΔIFNγR mice (Supplementary Table 1b, Extended Data Fig. 2e). Dox-induced IFNγ expression in large MCA313IFNγ-IND tumours in PIGCMV-Cre, but not in PIGΔIFNγR mice, induced necrosis, loss of endothelial cells and tumour regression, indicating that the model allowed the identification of the stromal targets of IFNγ (Fig. 1d–i).
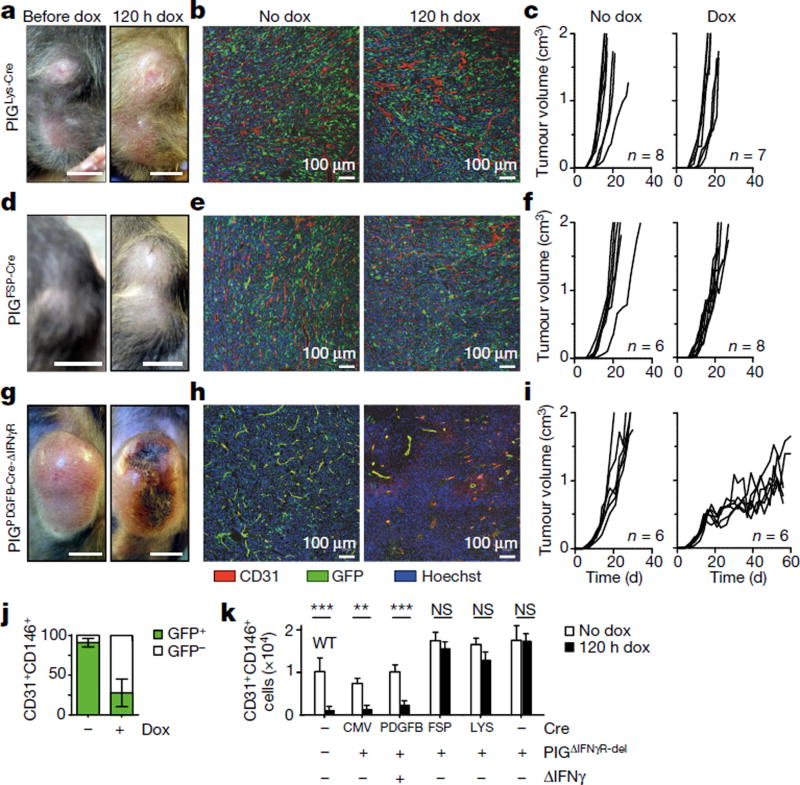
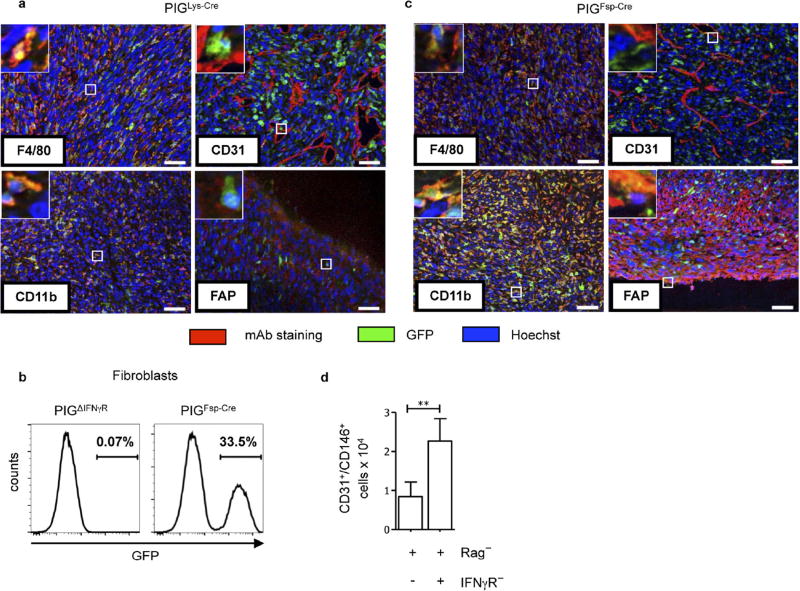
As (Tie2+) macrophages not only support neo-vascularization in tumours21, but also secrete anti-angiogenic cytokines in response to IFNγ14,15, we analysed PIGΔIFNγR mice with Cre expression driven by the lysozyme promoter (PIGLys-Cre mice), with exclusive IFNγR expression in cells of the myeloid lineage (Supplementary Table 1a). In MCA313IFNγ-IND tumours, most CD11b+ and F4/80+ cells, but not CD31+ or FAP+ cells, were GFP+ and therefore responsive to IFNγ (Extended Data Fig. 3a). IFNγ induction in established MCA313IFNγ-IND tumours of PIGLys-Cre mice did not induce necrosis, reduce numbers of endothelial (CD31+) cells or delay tumour growth (Fig. 2a–c). Thus, exposing exclusively myeloid cells in established tumours to IFNγ does not lead to cancer regression.
Figure 2. Response to IFNγ by endothelial cells is necessary and sufficient for necrosis, blood vessel reduction, and tumour regression by IFNγ.
a-f, Following IFNγ induction in MCA313IFNγ-IND tumours of PIGLys-Cre (a-c) and PIGFSP-Cre (d-f) mice, no necrosis, changes in blood vessel density (120 h after dox) or tumour regression was observed. c, f, Dox at a tumour size of 616 ± 183 mm3 and 599 ± 175 mm3, respectively. Combined data of two experiments. g-j, To induce CreER-mediated recombination in endothelial cells, PIGPDGFB-Cre-ΔIFNγ mice received tamoxifen. g, h, Necrosis (g) and reduction (h) in blood vessels 120 h after IFNγ induction. i, Tumour growth is delayed after IFNγ induction (right panel) in MCA313IFNγ-IND tumours (519 ± 30 mm3) grown in PIGPDGFB-Cre-ΔIFNγ mice compared to control mice (left panel). Starting day 21, tumour size differs significantly (**). j, Flow cytometry of tumour endothelial cells (CD31+CD146+) of tumours depicted in i, shows that most endothelial cells in untreated tumours (approximately day 20) are GFP+, while most endothelial cells are GFP− in tumours after 48 ± 5 days IFNγ exposure. k, 107 tumour cells of indicated mice without (open bars) and 120 h after IFNγ induction (black bars), were analysed for CD31+CD146+ cells using flow cytometry. Scale bars, 0.5 cm (a, d, g). Data are mean ± s.d., **P <0.01 and ***P < 0.001. The number of mice, replications and sample size for each experiment are shown in Supplementary Table 3.
We generated PIGΔIFNγR mice expressing FSP-Cre (PIGFSP-Cre mice) in which one fourth of tail fibroblasts and most haematopoietic cells, but not endothelial cells, were GFP+ and therefore expressed IFNγR (Extended Data Fig. 3b, Supplementary Table 1a). In MCA313IFNγ-IND tumours, CD11b+, F4/80+ and FAP+ cells, but not CD31+ cells, had recombined, as indicated by GFP expression (Extended Data Fig. 3c). IFNγ induction in established MCA313IFNγ-IND tumours of PIGFSP-Cre mice did not lead to macroscopic necrosis, microscopic endothelial cell loss or tumour regression (Fig. 2d–f). To confirm that IFNγ signalling in T cells does not contribute to blood vessel reduction, we reconstituted Rag− or Rag−IFNγR− mice with wild-type splenocytes and induced IFNγ in established MCA313IFNγ-IND tumours. In T-cell-reconstituted Rag− recipients, but not Rag−IFNγR− recipients, endothelial cell numbers were reduced after IFNγ induction (Extended Data Fig. 3d). Thus, response to IFNγ by tumour-associated fibroblasts, T cells or haematopoietic cells was not sufficient for IFNγ-induced tumour necrosis or regression.
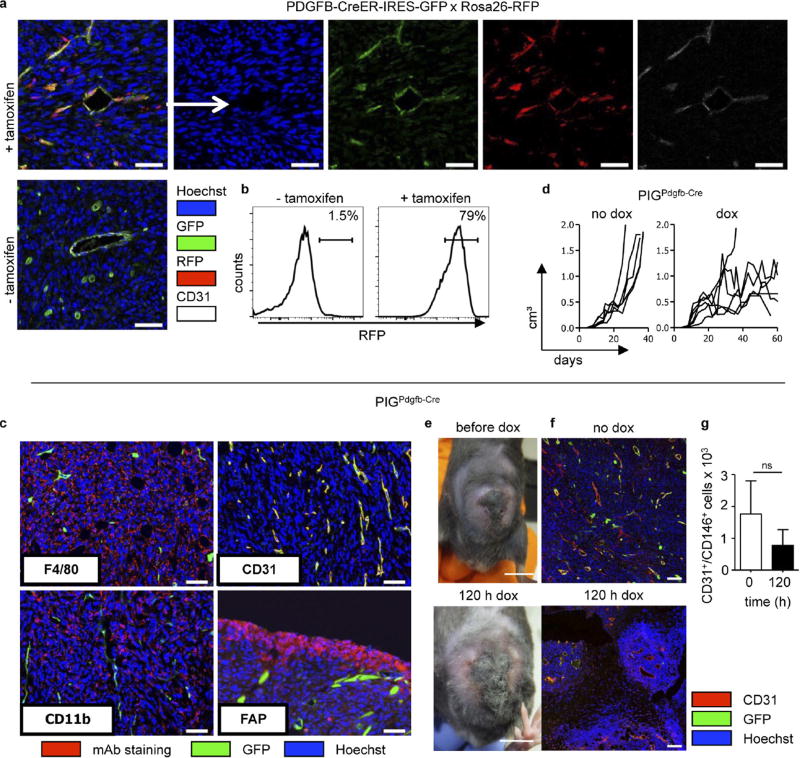
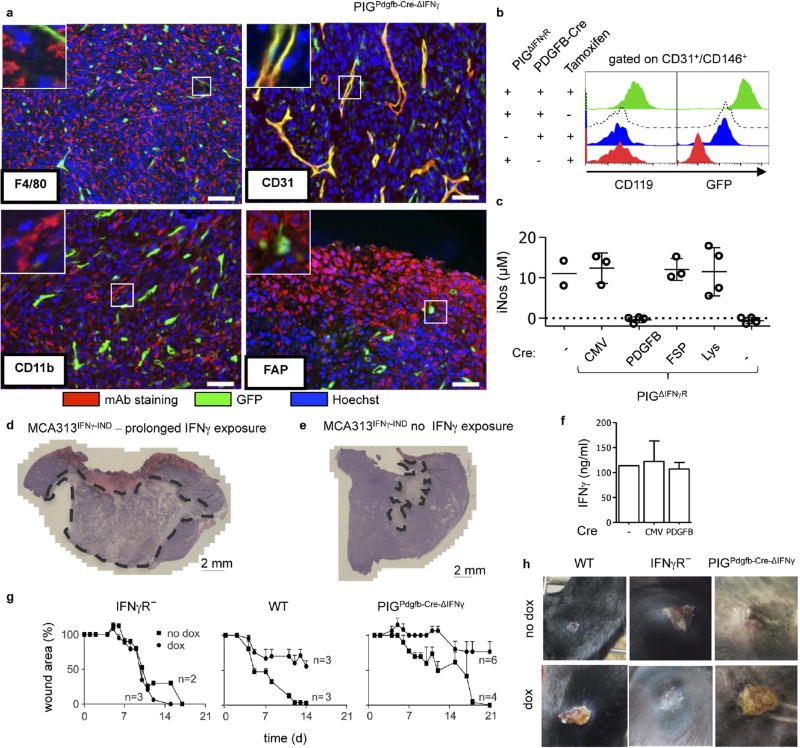
We next analysed mice with selective IFNγR expression in endothelial cells using PDGFB-CreER-IRES-GFP mice. Because these mice, in which recombination is tamoxifen-inducible in PDGFB+ cells, and PIGΔIFNγR mice both carry GFP reporter genes, recombination was analysed in tamoxifen-treated PDGFB-CreER-IRES-GFP × Rosa26-RFP mice bearing large MCA313IFNγ-IND tumours. Around 75.4% of tumour endothelial cells (CD31+CD146+) had recombined, indicated by RFP expression (Extended Data Fig. 4a, b). To avoid confounding effects by endogenous IFNγ (Extended Data Fig. 4c–g), experiments were performed in PIGΔIFNγR × PDGFB-CreER-IRES-GFP × IFNγ− (PIGPDGFB-Cre-ΔIFNγ) transgenic mice, which are deficient in IFNγ and IFNγR expression and allow selective induction of IFNγR expression in endothelial cells. GFP was almost exclusively expressed in tumour endothelial cells and faithfully monitored IFNγR expression (Extended Data Fig. 5a, b). The few GFP+ CD11b+ cells that were present did not respond to IFNγ with inducible nitric oxide synthase induction (Supplementary Table 1b, Extended Data Fig. 5c). IFNγ induction in large MCA313IFNγ-IND tumours in tamoxifen-treated PIGPDGFB-Cre-ΔIFNγ mice induced necrosis, disappearance of endothelial cells and tumour regression (Fig. 2g – i). Following regression, tumours slowly resumed growth (Fig. 2i). However, these tumours contained large central necrotic areas with viable cells at the rim (Extended Data Fig. 5d, e). As opposed to endothelial cells without IFNγ induction, endothelial cells in tumours exposed for around 50 days to IFNγ were mostly GFP−, suggesting a strong selective pressure against IFNγR-expressing endothelial cells (Fig. 2j). In line with this assumption, tumours grown for 50–100 days in PIGPDGFB-Cre or PIGCMV-Cre mice still produced inducible IFNγ in vitro (Extended Data Fig. 5f). After five days of IFNγ exposure, endothelial cells (CD31+CD146+) in MCA313IFNγ-IND tumours of all of the mice investigated in this study were reduced by 80–90% only in tumours from mice containing endothelial cells that could respond to IFNγ (Fig. 2k). To determine whether T-cell-derived IFNγ similarly affects endothelial cells, Rag− mice bearing 16.113 tumours were treated with IFNγ-competent or IFNγ-deficient TCR-I CD8+ T cells. Five days after T-cell transfer, we found a significantly lower number of endothelial cells in tumours treated with wild-type T cells than in those treated with IFNγ-deficient T cells (Extended Data Fig. 1h). IFNγ R responsiveness by tumour endothelial cells was necessary and sufficient for necrosis and tumour regression.
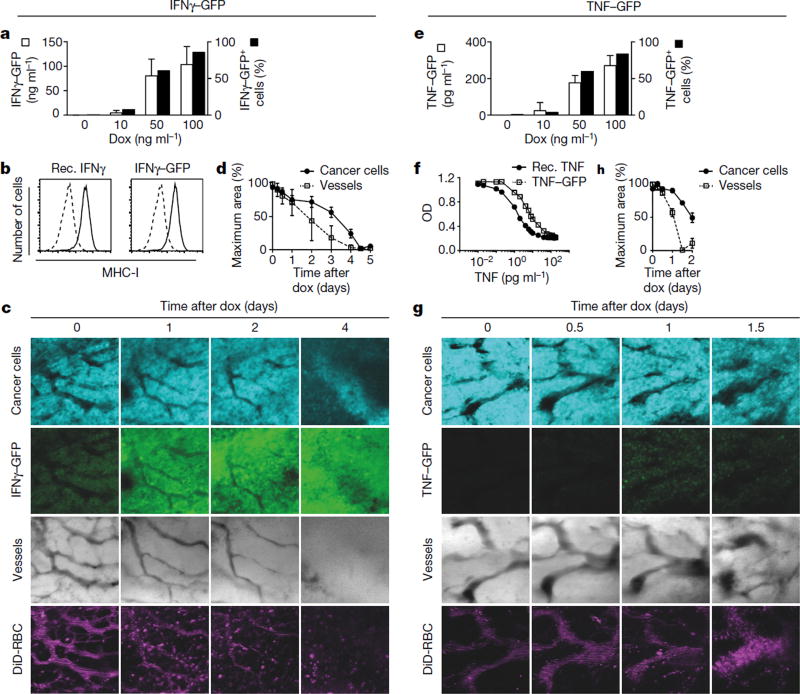
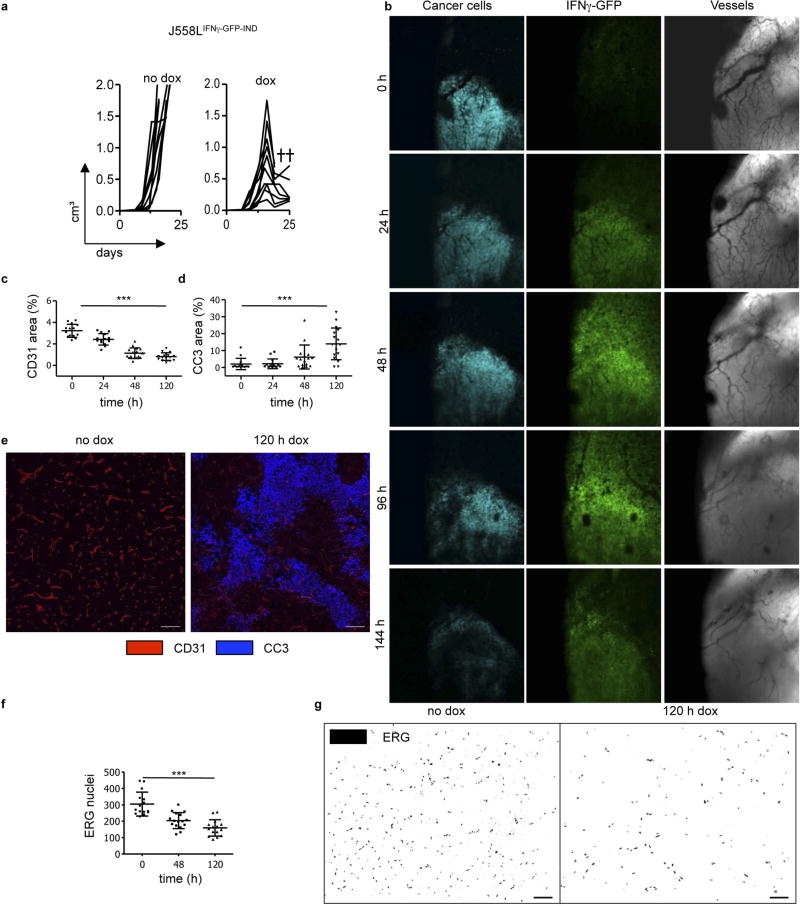
We intravitally imaged the same area of tumours that were growing behind a glass window over several days22. To better assess the kinetics of vascular regression by IFNγ, a dox-inducible Ifng-GFP fusion gene was introduced into plasmacytoma J558L cells (J558LIFNγ–GFP-IND), which are resistant to cytotoxic effects of IFNγ and TNF (see below)23. To monitor cancer cells, J558LIFNγ-GFP-INDcells additionally expressed the fluorescent (cerulean) protein. J558LIFNγ–GFP-IND cells produced around 104 ng ml−1 biologically active IFNγ–GFP (Fig. 3a, b) and could be visualized by intravital microscopy (Supplementary Videos 1, 2). Its induction in established J558LIFNγ–GFP-IND tumours growing in Rag− mice led to tumour regression (Extended Data Fig. 6a). Large vascularized J558LIFNγ–GFP-IND tumours growing behind a window were imaged for 6 days following dox application. A GFP signal was observed 24 h after IFNγ–GFP induction, and vascular density decreased with a loss of smaller blood vessels and thinning of larger vessels (Fig. 3c). At 48 h, blood vessels further decreased and were undetectable by 96 h of dox treatment. As shown by loss of cerulean signal, cancer cells were destroyed subsequent to blood vessel regression (Fig. 3d, Extended Data Fig. 6b). DiD-labelled erythrocytes, injected before imaging, did not leak from the tumour vessels during the entire longitudinal imaging. Instead, the blood flow ceased with progressing vessel regression (Supplementary Video 3), showing that IFNγ induces tumour ischaemia.
Figure 3. Tumour ischaemia versus tumour necrosis induced by intratumoural IFNγ-GFP or TNF-GFP fusion proteins, respectively.
a, IFNγ–GFP induction in cerulean+ J558LIFNγ–GFP-IND cells 48 h after dox, analysed for IFNγ (ELISA, left y axis and open bars) and GFP (flow cytometry, right y axis and black bars). Mean ± s.d. of three experiments. b, Upregulation of MHC-I on B16-F10 cells by IFNγ–GFP is comparable to recombinant IFNγ. Cells cultured with (black line) or without (dotted line) 1 ng ml−1 IFNγ (left panel) or IFNγ–GFP (right panel), were analysed for H-2Kb/H-2Db expression (representative of two experiments). c, The same area of J558LIFNγ–GFP-IND tumours established for 12–14 days behind a glass window in Rag− mice was repeatedly imaged over several days following dox. Shown: cancer cell viability (cerulean+, 1st row), IFNγ–GFP expression (2nd row), vascular density (bright field, 3rd row) and blood flow (DiD-stained erythrocytes, 4th row) (see also Extended Data Fig. 6, Supplementary Video 3). d, Quantification of changes in J558LIFNγ–GFP-IND tumour signal and blood vessel area over time. e, TNF-GFP induction in cerulean+ J558LTNF-GFP-IND cells 48 h after dox, analysed as in a except for TNF ELISA (mean ± s.d.). f, Cytotoxicity of TNF-GFP towards L929 cells is comparable to recombinant TNF. L929 cells were exposed to titrated amounts of TNF-GFP or TNF, and viability was determined (XTT assay, optical density (OD) at 450 nm). f, Mean of two experiments. g, J558LTNF-GFP-IND tumours imaged as in c (see also Extended Data Fig. 7, Supplementary Video 4). h, Quantification of changes in J558LTNF-GFP-IND tumour signal and blood vessel area over time. d, h, Combined data (mean ± s.e.m.) of 2–5 areas per animal and time point of three mice with J558LIFNγ–GFP-IND and four mice with J558LTNF-GFP-IND tumours. The number of mice, replications and sample size for each experiment are shown in Supplementary Table 3.
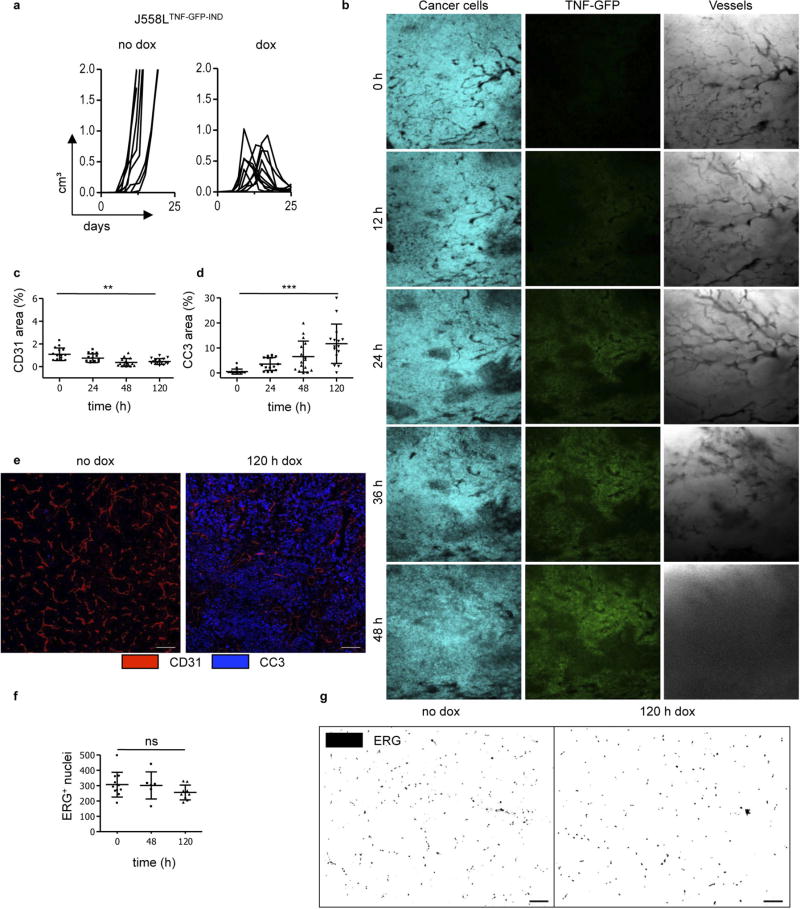
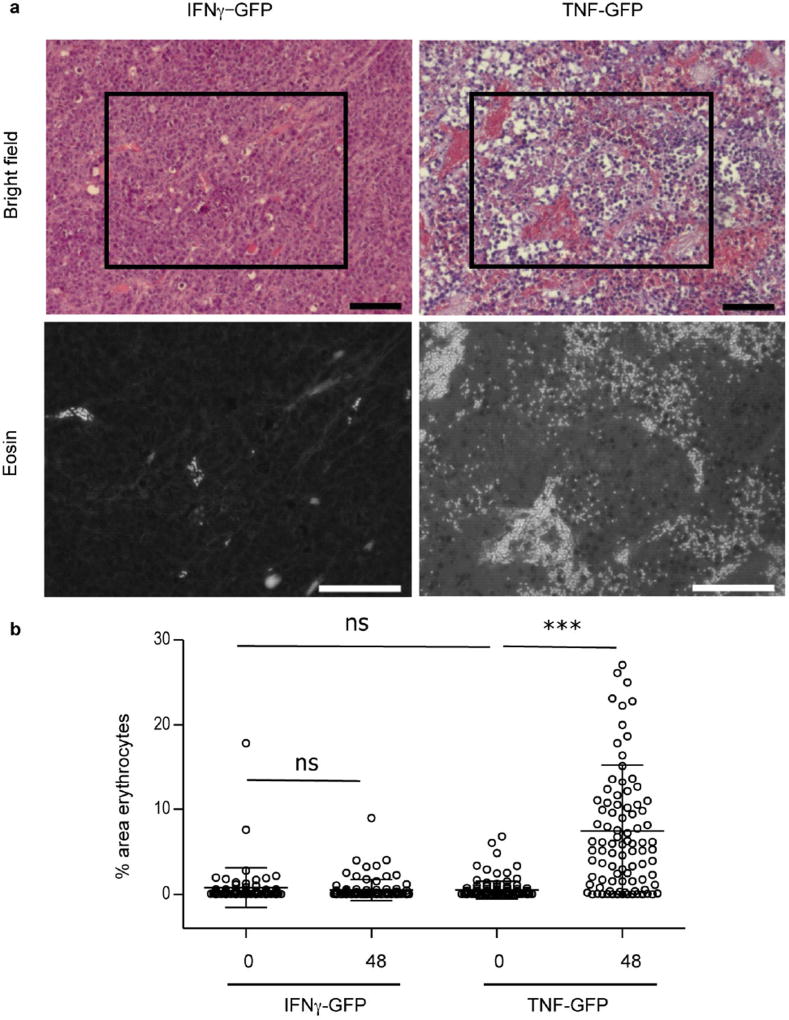
We performed similar experiments with TNF, which is usually produced simultaneously with IFNγ by activated T cells. We generated cerulean+ J558LTNF-GFP-IND cells with an inducible TNF-GFP fusion protein. J558LTNF-GFP-IND cells produced 368 pg ml−1 biologically active TNF–GFP upon dox application (Fig. 3e, f). Induction of TNF–GFP in established J558LTNF-GFP-IND tumours growing in Rag− mice led to tumour regression (Extended Data Fig. 7a). Imaging revealed notably different changes caused by TNF–GFP compared to IFNγ-GFP. The TNF–GFP signal was observed after 24 h and blood vessels did not become thinner but, if anything, wider (Fig. 3g, Extended Data Fig. 7b). By around 36 h after TNF–GFP induction, the blood vessels burst and DiD-labelled erythrocytes leaked into the tumour tissue (Supplementary Video 4); cancer cells decayed following vessel burst (Fig. 3h). In J558LTNF-GFP-IND tumours, erythrocytes were dispersed throughout the tissue 48 h after TNF–GFP induction, whereas in J558LIFNγ-GFP-IND tumours they remained within blood vessels (Extended Data Fig. 8a, b). Necrosis caused by IFNγ was induced by ischaemic shutdown of perfusion rather than by bursting of the blood vessels as was observed for TNF.
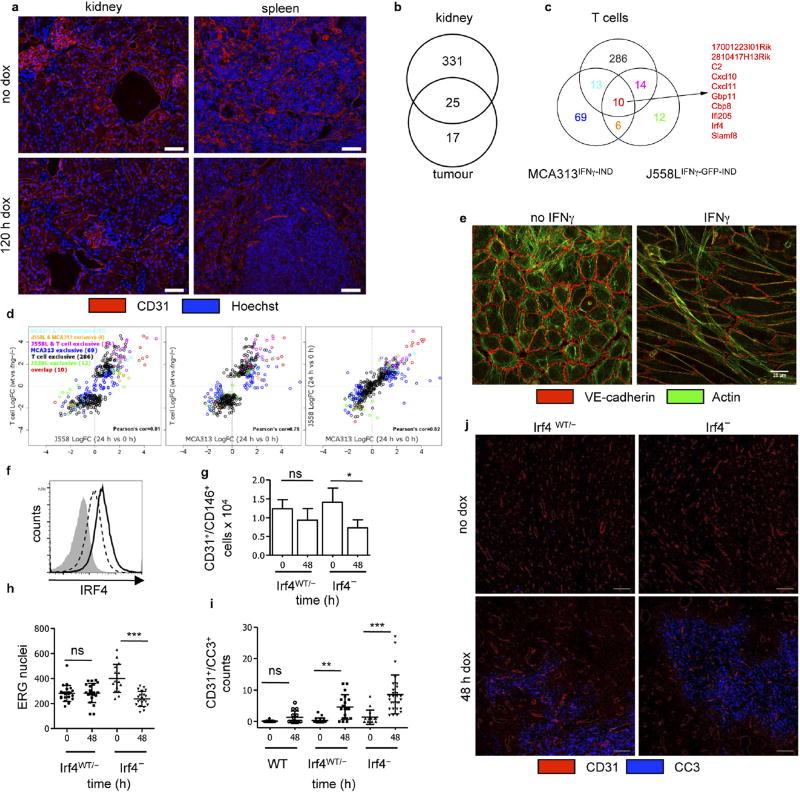
Endothelial cells in kidney and spleen of wild-type mice 5 days after dox treatment were unaltered (Extended Data Fig. 9a), indicating a relative selective effect on the (activated) tumour vasculature. Gene expression profiling of normal kidney and tumour endothelial cells revealed 1,500 differentially expressed genes. After IFNγ induction, the expression of 356 genes changed in kidney and 42 in tumour endothelial cells. Only 17 genes were exclusively regulated in tumour endothelial cells (Extended Data Fig. 9b). Activated endothelium occurs physiologically, for example, during development, pregnancy-induced vascular remodelling and wound healing. In PIGPDGFB-Cre-ΔIFNγ mice and wild-type mice with elevated IFNγ levels from small MCA313IFNγ-IND tumours, wounds did not heal in contrast to IFNγ R− mice, suggesting a selective effect of IFNγ on activated endothelium (Extended Data Fig. 5g, h). To further elaborate on this hypothesis, we determined the gene expression profile of IFNγ -exposed endothelial cells of MCA313IFNγ-IND and J558LIFNγ-GFP-IND tumours as well as 16.113 tumours treated by adoptive T-cell therapy (Extended Data Fig. 9c, Supplementary Table 2). Endothelial cells from all three tumours showed strong similarity in regulated genes. Genes associated with immune regulation and migration, for example, CXCL10 and CXCL11 (Extended Data Fig. 9c, Supplementary Table 2), were highly regulated. It is well-established that CXCL10 has anti-angiogenic effects on tumour blood vessels and is involved in physiological vessel regression, but it was unexpected that the tumour endothelial cells produce CXCL107,14–16.
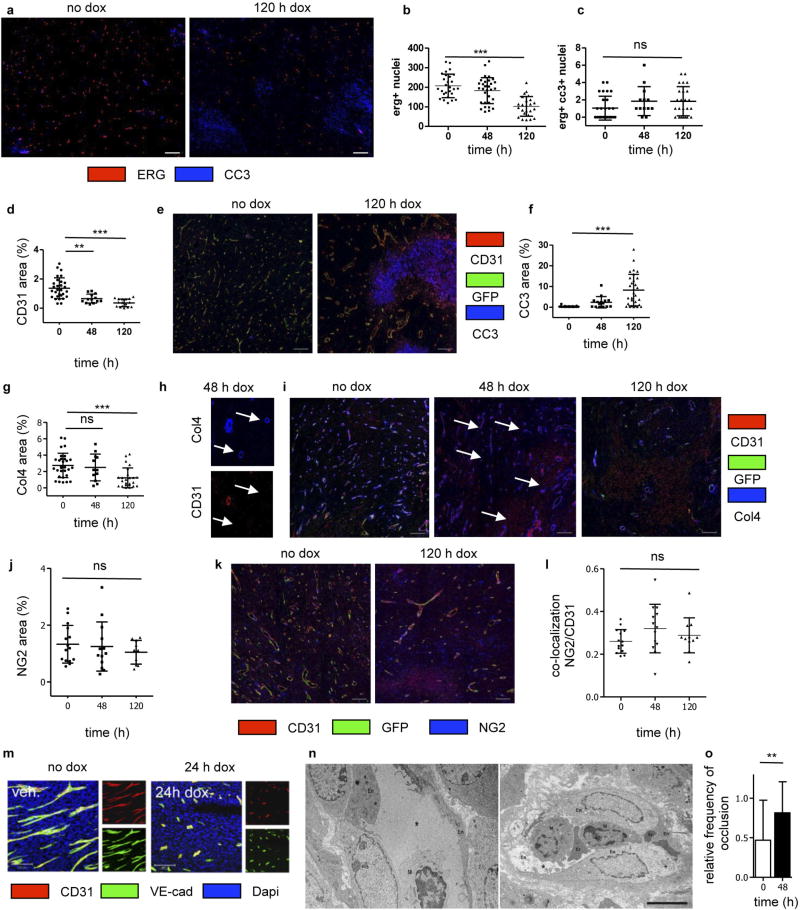
We did not observe apoptosis-associated genes to be highly regulated in IFNγ-exposed endothelial cells (Supplementary Table 2). Rather, IFNγ-exposed endothelial (ERG+ or CD31+) cells in MCA313IFNγ-IND tumours gradually decreased over a period of 5 days (Extended Data Fig. 10a – e). Although the total cleaved caspase 3+ (CC3+) area increased (Extended Data Fig. 10f), the number of CC3+ endothelial cells did not (Extended Data Fig. 10c). Endothelial cells significantly decreased not only in necrotic but also in vital tumour tissue (Extended Data Fig. 10b). Reduction in endothelial cells preceded decrease in collagen IV (Extended Data Fig. 10g – i). NG2+ pericytes did not decrease (Extended Data Fig. 10j, k), and we did not observe reduced co-localization with endothelial cells (Extended Data Fig. 10l). Therefore, we assume that primarily pericyte-uncovered endothelial cells disappeared during the first 5 days of IFNγ exposure. IFNγ exposure led to rapid rounding and condensation of CD31+ and VE-cadherin+ endothelial cells in MCA313IFNγ-IND tumours, similar to that observed for regressing blood vessels during the ovarian cycle24,25 (Extended Data Fig. 10m). In line with earlier studies on physiological blood vessel regression25, electron microscopy showed that the vessels were more frequently occluded upon IFNγ exposure (Extended Data Fig. 10n, o). IFNγ also induced profound morphological changes of human umbilical vein endothelial cells in vitro without indication of apoptosis (Extended Data Fig. 9e, Supplementary Video 5). In the J558L model, we confirmed reduction of endothelial (ERG+ or CD31+) cells by IFNγ –GFP fusion protein (Extended Data Fig. 6c – g) and found that TNF–GFP did not significantly change endothelial cell numbers during the first five days of cytokine exposure (Extended Data Fig. 7f, g). Collectively, we observed a process, which involves lumen collapse/ vessel occlusion and progressive disappearance of first small and then large calibre vessels. These characteristics of controlled blood vessel regression suggest that IFNγ induces changes in the tumour vasculature similar to those observed during physiological blood vessel regression. Irf4, upregulated by IFNγ in tumour but not normal endothelial cells (Extended Data Fig. 9b, c, Supplementary Table 2), has not been reported to be induced by IFNγ in (tumour) endothelial cells and was induced in vitro by IFNγ in mouse endothelial cells (Extended Data Fig. 9f). Endothelial cells in large MCA313IFNγ-IND tumours two days after IFNγ induction in Irf4-deficient mice revealed a more pronounced vessel reduction (Extended Data Fig. 9g, h) and an increased number of apoptotic endothelial cells compared to those in wild-type mice (Extended Data Fig. 9i, j), reminiscent of the protective role of IRF4 for neurons in ischaemia26.
We showed that ischaemia, a pathological reaction, is beneficial in anti-tumour responses. Both, IFNγ and TNF destroy tumour blood vessels, yet by different mechanisms and with different consequences. IFNγ released by tumours did not lead to systemic toxicity in mice with selective IFNγ R expression on endothelial cells, as observed in wild-type mice, which is compatible with the observation that IFNγ, unlike TNF, does not induce necrosis in combination with bacterial products in the normal skin27. The early events induced by IFNγ in tumours resemble blood vessel regression in development, wound healing, ovary cycle and pregnancy-induced uterine vascular remodelling, the latter being regulated by IFNγ6–8,24,25. In conclusion, IFNγ and TNF, simultaneously produced by effector T cells, together have a strong effect on tumour blood vessels: (1) TNF bursts the tumour vessels and allows extravasation of infiltrating cells, and (2) IFNγ helps to prevent relapse by keeping the tumour in an ischaemic state, similar to that observed when these cytokines are targeted selectively to the vasculature28.
METHODS
Expression vectors
To construct the PIG (pCAGloxPSTOPloxP-IFNγR-IRES-GFP) plasmid, the IRES-GFP sequence from pMIG29 was excised with HincII. The resulting fragment was ligated into the blunt-ended KpnI site of pHMGmGIFR30 resulting in pHMG-mIFNγR-IRES-GFP. To replace the lacZ gene of pCAGloxPSTOPloxPZ31 with the IFNγR-IRES-GFP fragment, pCAGloxPSTOPloxP-Z was digested with BamHI, treated with Klenow fragment and thereafter the lacZ gene was excised by digestion with NotI. Next, the IFNγR-IRES-GFP fragment was excised from pHMG-mIFNγR-IRES-GFP using SmaI and NotI and was ligated into pCAGloxPSTOPloxP to generate pCAGloxPSTOPloxPIFNγ(R-IRES-GFP.
The retroviral vector plasmid for inducible IFNγ expression, pMOV-IFNγ, has been previously described19. To obtain pMOV-IFNγ-GFP and pMOV-TNF-GFP, cDNA sequences encoding for GFP-tagged mIFNγ or mTNF, including a glycine-serine-linker (G4S)3 that is located between the cytokine and the GFP gene (replacing the cytokine 3′ untranslated region), were de novo synthesized by GeneArt (Regensburg, Germany). The de novo synthesized sequences (IFNγ–GFP: 1,230 bp, TNF–GFP: 1,470 bp) contained NotI and SalI sites for ligation into NotI and SalI sites of pMOV.1-T2.
Mice
PIG mice were generated by excising the pCAGloxPSTOPloxPIFNγR-IRES-GFP expression cassette using KpnI and NotI. The 8,891 bp fragment was gel purified and injected into the pronucleus of fertilized C57BL/6 oocytes. C57BL/6, IFNγR− (strain number 003288), IFNγ− (strain number 002287), Rag1− (strain number 002216), Rag2− (strain number 008449) (referred to as Rag−) and CMV-Cre mice (strain number 006054) were obtained from the Jackson laboratories. TCR-I mice32 are transgenic for a T-cell receptor specific for SV40 large T, epitope I, and were obtained from Jackson laboratories (strain number 005236) and crossed to a Rag− genetic background. FSP-Cre mice33 were provided by E. G. Neilson (Northwestern University, Feinberg School of Medicine, Chicago) and were backcrossed for 10 generations to the C57BL/6 genetic background. Lys-Cre mice34 backcrossed to C57BL/6 genetic background (N10) were obtained from S. Fillatreau (German Centre for Rheumatology Research, Berlin). PDGFB-CreER-IRES-GFP mice35 were backcrossed for 10 generations to the C57BL/6 genetic background. To obtain mice with cell-type-specific expression of the IFNγR, PIG mice were crossed to the respective Cre strain (CMV-Cre, Lys-Cre, FSP-Cre, PDGFB-CreER-IRES-GFP) and to IFNγR− mice. PIGΔIFNγR × PDGFB-CreER-IRES-GFP were further crossed to IFNγ− mice. Mice used in experiments were heterozygous for the PIG and Cre alleles and homozygous for the IFNγR− (and IFNγ−) allele. Rosa26-tdRFP mice were generated on the C57BL/6 genetic background36 and were crossed to PDGFB-CreER-IRES-GFP mice. Irf4− mice37 were backcrossed for 10 generations to the C57BL/6 genetic background. Irf4WT/− and Irf4− were obtained by breeding Irf4− male and Irf4 WT/− female mice. Male and female mice aged between 6–24 weeks were used and matched in experiments. All animal experiments were conducted in accordance with institutional, state, and federal guidelines and with permission of the local animal ethics committee of the LAGeSo, Berlin. Effect and sample size estimates were done and included in animal experiment applications. At any signs of illness (lethargy, hunched posture, scruffy coat, social isolation, inactivity or weight loss) mice were taken out of the experiment. All animals used for experiments are reported. No randomization was performed and the investigators were not blinded to allocation during experiments and outcome assessment.
Genotyping
The PIG transgene was identified by PCR with primers specific for the stop cassette (chloramphenicol acetyltransferase gene) 5′-CAGTCAGTTG CTCAATGTACC-3′ and 5′-ACTGGTGAAACTCACCCA-3′ and the GFP gene 5′-AAGTTCATCTGCACCACCG-3′ and 5′-TCCTTGAAGAAGATGGTGCG-3′. The endogenous IFNgr1 gene was detected with a forward primer specific for exon 4: 5′-ATGCAACGGTTTCCACCCCC-3′, and a reverse primer in intron 4: 5′-CCAGT CATAGCCGAATAGCC-3′. IFNgr1− gene was detected with a forward primer specific for exon 4 (as above) and a reverse primer specific for the neomycin resistance gene 5′-CCACCTCAGCACTGTCTTCA-3′. IFNγ− mice were genotyped using the primers: oIMR6218 5′-CCTTCTATCGCCTTCTTGACG-3′, oIMR8284 5′-AGAAGTAAGTGGAAGGGCCCAGAAG-3′ and oIMR8285 5′-AGGGAAACTGGGAGAGGAGAAATAT-3′. Rosa26-RFP mice were genotyped by PCR using primers 5′-AAGACCGCGAAGAGTTTGTCC-3′, 5′-TAAGCCTGCCCAGAAGACTCC-3′ and 5′-AAGGGAGCTGCA GTGGAGTA-3′. The PDGFB-CreER-IRES-GFP transgene was detected using primers 5′-GCCGCCGGGATCACTCTCG-3′ and 5′-CCAGCCGCCGTCGC AACTC-3′. All other Cre-transgenic mice (Lys-Cre, FSP-Cre and CMV-Cre) were genotyped by using the generic Cre-PCR from the Jackson labs with the primers: oIMR1084 5′-GCGGTCTGGCAGTAAAAACTATC-3′ and oIMR1085 5′-GTGAAACAGCATTGCTGTCAC TT-3′. The genotypes of Rag− and TCR-I mice were confirmed by flow cytometry of peripheral blood mononuclear cells staining for T cells and B cells. The genotype for PIG × CMV-Cre, Lys-Cre, FSP-Cre, PDGFB-CreER-IRES-GFP was confirmed by flow cytometry assessing GFP. Irf4− mice are unable to generate IgM, therefore lack of serum IgM (determined by ELISA) classified Irf4− animals.
Cells
MCA313 is a fibrosarcoma that was induced by subcutaneous injection of 25 µg methylcholanthrene (MCA) dissolved in sesame oil in an IFNγR− mouse. MCA313IFNγ-IND and 16.113-999IFNγ-IND cells were generated by retroviral transduction with pMOV-IFNγ by standard procedures19. Cells were cloned by limiting dilution and selected for optimal IFNγ induction and no expression in the absence of dox. J558L is a BALB/c-derived plasmacytoma cell line. J558LTNF-GFP-IND and J558LIFNγ-GFP-IND cells were generated by retroviral transduction of J558L cells with pMOV-IFNγ-GFP or pMOV-TNF-GFP, cloned and selected as described above. J558LTNF-GFP-IND and J558LIFNγ-GFP-INDcells were additionally transduced with the retroviral vector pMFG-cerulean22. B16-F10 is a mouse melanoma cell line isolated from C57BL/6 mice and L929 is a fibrosacroma cell line derived from a C3H/An mouse. 16.113 is a carcinoma cell line derived from the colon of LoxP-Tag mice38. 16.113-999 is an IFNγ-insensitive variant of 16.113 cell line39. All cell lines mentioned above were cultured in RPMI 1640 medium with 10% FCS. Send.1 cells are polyoma middle T antigen immortalized endothelial cells from blood vessels of the skin. Send.1 cells were cultured in Dulbecco’s modified Eagle’s medium (DMEM) with 20% FCS. Fibroblasts were generated by cutting tail skin into small pieces and digesting them overnight in DMEM, 20% FCS containing collagenase II (1 mg ml−1) and dispase (1 mg ml−1) at 37 °C. Digestion was stopped by changing the medium (DMEM, 10% FCS). To generate immortalized fibroblasts from PIG mice, primary fibroblast cultures were transfected with the plasmid pCMV-Tagori40 and with the plasmid pBabe-puro using Lipofectamine 2000 (Life Technologies), according to the manufacturer’s instructions. Transfected fibroblasts were selected using 1 (µg ml−1 puromycin. To rule out bacterial products synergizing with TNF, J558L cells were tested for the presence of mycoplasma by PCR using the primers: 5′-TGCACCATGTGTCACTCTGTTAACCTC-3′ and 5′-GGGAGCAAACAGGATTAGATACCCT-3′. No commonly misidentified cell line was used in the study. MCA313 are fibrosarcoma, J558L plasmocytoma and 16.113 are carcinoma cells that were distinguished by morphology in cell culture. No other authentication was used.
Culture and imaging of HUVECs
Donor-pooled human umbilical vein endothelial cells (HUVECs; PromoCell, GmbH) were cultured in Endothelial Growth Medium 2 (Lonza, Ltd) according to the manufacturer’s instructions for a maximum of five passages. For immunofluorescence and time lapse experiments, cells were plated on 18-mm coverslips or in Nunc Laboratory-Tek chambered coverglass 1.5 (ThermoFisher Scientific, Inc.) coated with 10µg ml−1 bovine plasma fibronectin (Sigma-Aldrich, Co. Llc., F1141). Cells were treated with recombinant human IFNγ (PeproTech) every 24 h for a total of 4 days. To stain actin filaments for live cell experiments, 250 nM SiR-Actin was added to the cells 1 h before the start of the imaging. For immunofluorescence analysis of HUVECs, cells were fixed and permeabilized for 1 min with 0.3% glutaraldehyde (EM Grade, Electron Microscopy Sciences), 0.25% Triton X-100 in cytoskeleton buffer (CB: 10 mM MES, pH 6.1, 150 mM NaCl, 5 mM EGTA, 5 mM glucose, 5 mM MgCl2) followed by a second fixation step with 2% paraformaldehyde (Electron Microscopy Sciences) in CB for 10 min. The sample was quenched with 0.1% NaBrH4 for 7 min and washed three times with PBS for 10 min. The sample was incubated in blocking buffer (3% BSA in PBS) for 1 h and stained overnight with rabbit polyclonal anti-human VE-cadherin antibody (Abcam, ab33168) in blocking buffer. The sample was then incubated for 1 h with donkey anti-rabbit IgG conjugated to Alexa Fluor 647 and 250 nM phalloidin conjugated to Alexa Fluor 488 (ThermoFisher Scientific, Inc.). Samples were mounted in Abberior Mount Solid mounting media (Abberior, GmbH). Imaging of HUVECs was performed on LSM 780 confocal microscope with Plan Apochromat 63 × NA 1.4 Oil objective (Carl Zeiss). Time-lapse series with reflection-based autofocus were acquired using a custom-written Visual Basic macro (A. Politi and J. Ellenberg, EMBL Heidelberg), acquiring at least three positions per experiment per condition. z-stacks covering the entire cell volume were acquired and maximum intensity projected. Live imaging was performed at 37 °C under 5% CO2.
Cytokine analysis
2 × 10⁵ MCA313IFNγ-IND, J558LTNF-GFP-IND, J558LIFNγ–GFP-IND or 16.133–999IFNγ-IND cells per ml were cultured for 48 h without or in the presence of 10, 50, or 100 ng ml−1 dox (Sigma Aldrich). Culture supernatants were analysed by IFNγ- or TNF-specific ELISA according to the manufacturer’s (OptEIA; BD Biosciences) recommendation. TNF biological activity of the TNF–GFP fusion protein was analysed by an L929 cytotoxicity assay. L929 cells were seeded at 3.5 × 10⁴ cells in 96 wells in RPMI, 2% FCS and cultured overnight. Then, 2 µg ml−1 actinomycin D (Sigma Aldrich) and recombinant TNF (Peprotech) or TNF-GFP in concentrations as indicated were added in fresh medium (RPMI, 2% FCS) and incubated for 24 h. Thereafter, fresh XTT (sodium,2,3,-bis(2-methoxy-4-nitro-5-sulfophenyl)-5-[(phenylamino)-carbonyl]-2H-tetrazolium) solution was added, incubated for 4 h, and absorbance was measured at 450 nm. For each concentration, three replicates were tested per plate. To evaluate the bioactivity of the IFNγ–GFP fusion protein, 106 B16-F10 cells were cultured in 5 ml RPMI 1640 medium 10% FCS containing either recombinant IFNγ or IFNγ–GFP at a concentration of 1 ng ml−1. After 48 h, MHC-I upregulation was analysed by flow cytometry. Blood samples were collected from the facial vein using a sterile lancet. Blood was allowed to agglutinate and then centrifuged for 20 min at 4°C. Serum samples were aliquoted and stored at −80 °C. To determine serum IFNγ levels, 20 µl of 1:5 diluted serum was analysed using the cytometric bead array from eBioscience (Procartaplex) according to the manufacturer’s instructions.
Tumour experiments
106 MCA313IFNγ-IND cells, 16.113–999IFNγ-IND, J558LTNF-GFP-IND or J558LIFNγ–GFP-IND cells were injected subcutaneously into the right flank of the mice. Tumours were measured 2–3 times weekly in three perpendicular diameters using a calliper, and tumour volume was calculated using the ellipsoid volume formula (π /6 × a × b × c). According to the animal application approved by the local ethics committee (LAGeSo Berlin), animals were taken out of the experiment, if tumours reached an average diameter of 1.5–2 cm. In none of the experiments, a tumour reached a larger size. Mice with tumour necrosis were observed daily and monitored for humane endpoint criteria (lethargy, hunched posture, scruffy coat, social isolation, inactivity or weight loss), and these exclusion criteria were not detected in any case. Dox was continuously administered by adding 1 mg ml−1 dox to light-protected drinking water (supplemented with 20 mg ml−1 glucose). Tamoxifen was administered in chow at 400 mg kg−1 (TAM400, LASvendi) three days before tumour cell transplantation as indicated. Before mice were exposed to tamoxifen chow, they were administered for 10 days soy-free chow from LASvendi to exclude effects from phytoestrogens.
In experiments described in Fig. 1f and Extended Data Fig. 1a (left panel), dox was administered in 48 h intervals (48 h on dox, 48 h on water). In intravital imaging experiments, dox was administered by daily bolus injection of 10µg i.p. For adoptive T-cell therapy, 106 16.113 cells were subcutaneously injected into Rag− mice. When tumours were established (approximately 500 mm3), mice received 107 TCR-I T cells from Rag− × TCR-I mice i.v. per animal at the indicated time point. In the experiment described in the Extended Data Fig. 1h, T cells from C57Bl/6 or IFNγ− mice were transduced with a retroviral vector to express the TCR-I T cell receptor. Five days after ATT with 106 TCR-I-transduced T cells, tumours were isolated and after tissue digestion the number of endothelial cells was analysed by flow cytometry.
For experiments in Extended Data Fig. 3d, Rag− mice or Rag−IFNγR− mice were reconstituted with 2 × 10⁷ splenocytes from wild-type mice. Two weeks after T-cell transfer, 106 MCA313IFNγ-IND cells were injected and when tumours were established (846 ± 263 mm3), IFNγ was induced. Five days after IFNγ induction, tumours were isolated and, after tissue digestion, endothelial cells (CD31 and CD146 double positive cells) from 107 tumour cells were analysed by flow cytometry.
Potential immunogenicity of transgenes used in this study was excluded by experiments showing that MCA313IFNγ-IND tumours grew and regressed after IFNγ induction with the same kinetics in wild-type and Rag− mice (Extended Data Fig. 1a) and, furthermore, cells expressing the rtTA protein were not eliminated even after 100 days in fully immunocompetent mice (Extended Data Fig. 5f). Scale bars for tumour pictures were inserted based on the calliper measurements of the day the picture was taken.
Wound healing experiments
106 MCA313IFNγ-IND cells were injected subcutaneously into the right flank of indicated mice. After one week (tumour size approximately 50 mm3), mice were anaesthetized, and a wound of 5 mm in diameter was made on the back of the mice using a biopsy punch. For the first 48 h, analgesia was administered. Mice were inspected every day. The wound healing process was recorded by taking photos and by measuring the diameter of the wound in two perpendicular axes using a calliper.
Gene expression analysis
Tumour endothelial cells (CD31+CD146+) were isolated by fluorescence-activated cell sorting into RNAzol. cDNA was synthesized from ~ 500 pg total RNA according to the standard Affymetrix protocol GeneChip WT Pico Kit (P/N 902623) by using the Affymetrix T7 RNA polymerase promoter which is attached to random primers. Pre-IVT was performed with 12 amplification cycles. Then, ss-cDNA was fragmented and biotin-labelled according to Affymetrix recommendations. Fragmented cDNA (3.8 µg) was hybridized to MOGENE 2.0 ST arrays. Arrays were washed and stained in the Affymetrix Fluidics Station 450 and further scanned using the Affymetrix GeneChip Scanner 3000 7G. Software: Affymetrix GeneChip Command Console Version 4.0. The image data were normalized and quality controlled with the Affymetrix Expression Console Software Version 1.4. The microarray data were deposited in the GEO data repository under the accession number GSE94504.
The bioinformatics analysis of the gene expression data was carried out with R BioConductor, to quantify the gene expression changes and normalize array intensity values for the comparison between the samples we used ‘rma’ function from ‘oligo’ package (target = ‘probeset’ parameter was used). Manufacture’s probe identifiers were converted to mouse gene names with ‘mogene20stprobeset.db annotation. After background subtraction and quantile normalization each gene intensity is determined as median of probe set intensities. log fold changes are computed from the average across replicates. For MCA313IFNγ-IND data from 24 h and 48 h after induction were so consistent that they could be regarded as replicates (data not shown). Differential expression analysis was carried out with limma’ package by computing moderated t-statistics and Benjamini–Hochberg adjusted P values. Number of replicates analysed were: MCA313IFNγ-IND, 0 h, n = 3; MCA313IFNγ-IND, 24 h, n = 2; MCA313IFNγ-IND, 48 h, n = 2; J558LIFNγ–GFP-IND, 0 h, n = 3; J558LIFNγ–GFP-IND, 24 h, n = 2; normal kidney, 0 h, n = 3; normal kidney, 24 h, n = 3; wild-type T cells, 5 days, n = 3; IFNγ− T cells, 5 days, n = 5.
Longitudinal imaging using window chambers
The procedures for surgical implantation of window chambers and longitudinal imaging are detailed elsewhere22. In brief, window chambers were implanted into mice, and mice were injected with 106 cancer cells. 13–18 days later, dox administration was started and continued throughout the experiment. For microscopic analysis, mice with window chambers were anaesthetized using isofluorane. The window was fastened to the main stage of the microscope using a custom-made holder. The microscope (Leica SP5 II TCS Tandem scanner 2-photon spectral confocal with 4 × and 20 × 0.45 LWD IR objectives from Olympus) has a heated chamber for maintaining body temperature. The software and x–y motorized stage allow returning to memorized positions within the window at later times. For visualization of the tumour vasculature and blood flow, mice were injected with 1,1-dioctadecyl-3,3,3, 3-tetramethylindodicarbocyanine perchlorate (DiD)-labelled red blood cells. In brief, red blood cells were obtained from the peripheral blood of Rag− mice and labelled with DiD (Invitrogen) for 30 min at 37°C. After three washes with PBS, DiD-labelled red blood cells were injected intravenously. Absorption and fluorescence emission maxima of DiD are 644 nm and 665 nm, respectively. The optical penetration of tissue typically ranged between 100–150 µm. The acquired images were analysed using Fiji41.
Intravital two-photon microscopy
24 h before imaging procedure, 10 µg dox was injected i.p. in 100 µl PBS. In vivo multiphoton microscopy (IVMPM) of J558LIFNγ-GFP-IND tumours engrafted in Rag− mice was performed while mice were anaesthetized with isoflurane. For IVMPM, an Ultima Multiphoton Microscopy System was used (Prairie Technologies). For imaging GFP, the excitation wavelength was set to l = 890 nm. Band-pass filters optimized for GFP (BP l = 525/50 nm) were used for detection. Collected single plane images were assembled to a 3D stack for each tumour in silico using Amira 3D software.
Transmission electron microscopy
Tumour tissue was fixed by immersion in phosphate buffered 4% (w/v) paraformaldehyde and 1.25% (v/v) glutaraldehyde. Samples were post-fixed with 1% (v/v) osmium tetroxide, dehydrated in a graded series of ethanol, and embedded in the PolyBed 812 resin (Polysciences, Inc., Germany).
Ultrathin sections (60–80 nm) were stained with uranyl acetate and lead citrate, and examined at 80 kV with a Zeiss EM 910 electron microscope (Zeiss, Oberkochen, Germany). Acquisition was done with a Quemesa CDD camera and the iTEM software (Emsis GmbH, Germany) and pictures were processed using Adobe Illustrator.
Antibodies and staining reagents
The following anti-mouse antibodies were used for flow cytometry: NK1.1 (clone PK136, Miltenyi Biotec 130-102-400, isotype control mouse IgG2a 130-091-835), CD8 (clone 53-6.7, Biolegend 100712, 100708, isotype control rat IgG2a 400508, 400512), CD4 (clone RM4-4, Biolegend 116014, 116006, isotype control rat IgG2b 400612, 400608), CD3 (clone 145-2C11, Biolegend 100336, isotype control Armenian hamster IgG 400935), CD19 (clone 6D5, Biolegend 115512, 115508, isotype control rat IgG2a 400512, 400508), CD11b (clone M1/70, Biolegend 101216, isotype control rat IgG2b 400618), GR-1 (Clone RB6-8C5, Biolegend 108424, isotype control rat IgG2b 400624), CD11c (clone N418, Biolegend 117329, 117308, isotype control Armenian hamster IgG 400935, 400908), F4/80 (clone BM8, Biolegend 123110, isotype control rat IgG2a 400508), CD119 (clone 2E2, Biolegend 112804, isotype control Armenian hamster IgG 400903), CD119 (clone 2E2, BD 550482, isotype control Armenian hamster IgG1 553970), CD31 (clone 390, eBioscience 25-0311-82, Biolegend 102418, isotype control rat IgG2a, k 400522), CD146 (clone ME-9F1, Biolegend 134704, isotype control rat IgG2a 400508), CD146 (clone ME-9F1, Miltenyi Biotec 130-102-739, isotype control rat IgG2a 130-102-652), CD45.2 (clone 104-2, Miltenyi Biotec 130-102-980, 130-102-355, isotype control mouse IgG2a 130-098-898). Further reagents used for flow cytometry: viability dye eFluor 450 or eFluor 660 (eBioscience 65-0863-18, 65-0864-18), Faser-kit APC (Miltenyi Biotec 130-091-762), streptavidin-APC (Biolegend 405207), 7-aminoactinomycin (7AAD) (Biolegend 420404). The following anti-mouse antibodies were used for confocal and fluorescence microscopy: GFP (Invitrogen A-11122), CD11b (clone M1/70, abcam 8788, isotype control rat IgG2b ab18450), FAP (rabbit polyclonal IgG, abcam 53066), CD31 (clone MEC13.3, BD 550274, isotype control rat IgG2a 553894), CD146 (clone ME9-F1, Biolegend 134702, isotype control rat IgG2a 400501) and F480 (BM8, Biolegend 123102, isotype control rat IgG2a 400501), ERG (abcam 196149, isotype 199093), cleaved caspase 3 (cell signalling 9604S), collagen IV (AbD Serotec 2150-1470). As secondary antibodies Alexa 488 (A21206), Alexa 594 (A21207 and A21209), Alexa 568 (A11077) and Alexa 647 (A31573 and A21472) labelled: anti-rat IgG and anti-rabbit IgG (Life Technologies) were used. Hoechst 33342 was used for staining nuclei.
Flow cytometry
To analyse peripheral blood mononuclear cells, blood was taken from the facial vein using a sterile lancet. Erythrocytes were lysed using ACK lysis buffer (BD Biosciences). To exclude dead cells from analysis, 7-AAD or the fixable viability dye eFluor 450 were used. For staining of tumour stroma cells, tumours were isolated, cut into small pieces and digested for 1 h in RPMI 1640 medium containing 10 mg ml−1 collagenase II, 10 mg ml−1 dispase and 10 µg ml−1 DNase I. Cells were washed in PBS and filtered over a 40 µm nylon mesh. Fc-receptors were blocked with anti-CD16/32 blocking antibodies. To analyse tumour endothelial cells, we used an integrated magnetic enrichment, using anti-PE magnetic microbeads that were added to the sample of PE-positive cells (stained with CD31-PE-Cy7/CD146-PE) and were directly enriched before FACS analysis, as suggested for analysis of rare cells when using the MACSQuant analyser. 107 total cells from digested tumour material were stained with CD45.2, CD31, CD146 and live/dead cell exclusion. For IFNγR (CD119) staining, a biotin-labelled anti-CD119 (2E2) antibody in combination with streptavidin-APC was used, the signal was subsequently enhanced by amplification using the FASER Kit-APC (Miltenyi Biotec) using streptavidin-anti-APC antibodies. Control staining was done without the primary antibody. For intracellular staining of IRF4, anti-IRF4 monoclonal antibody (Biolegend 646408) and the transcription factor staining kit (eBioscience 00–5523) was used.
Nitric oxide synthase assay
For isolating macrophages, tumours were cut into small pieces and digested as described above. Cells were washed in PBS and filtered over a 40 µm nylon mesh and labelled with anti-mouse CD11b MACS beads (Miltenyi Biotec). CD11b cells were purified by magnetic cell sorting (purity was > 90%). 4 × 10⁵ CD11b cells were seeded in 12-well tissue culture plates. Cells were stimulated with 250 U ml−1 IFNγ for 24 h. The nitrite ion was measured in a Griess diazotization reaction using Griess reagent system (Promega) according to the manufacturer’s instructions. In brief, 50 µl of medium was mixed with 50 µl of sulfanilamid solution and incubated for 10 min protected from light. Next, Griess reagent (N-(1-naphthyl)ethylenediamine) was added and incubated for another 10 min protected from light. Thereafter, absorbance was measured at 540 nm. Nitric oxide concentration was determined using the optical density value from the Nitric oxide standard curve and medium without standard (blank) was set as detection limit.
Immunohistochemistry
Tumour tissues were fixed in 4% paraformaldehyde (Sigma Aldrich) containing 10% m/w sucrose overnight, incubated overnight in PBS-sucrose solution (25% m/w) and embedded in OCT-tissue tech (Sakura). 5 µm sections were mounted on slides. Slides were treated with 0.2% galantine (Sigma Aldrich) and 0.2% Triton X-100 in PBS and additionally blocked with antibody diluent (Dako) for 1 h at room temperature. All antibody staining were performed in Dako antibody diluent solution. Primary antibodies were incubated overnight at 4 °C. After three washes with PBS, secondary antibodies were added for 1 h together with Hoechst 33342 (Sigma Aldrich) at room temperature. Negative controls were generated by staining with the secondary antibodies and Hoechst 33342 only. After staining, the slides were covered with slowfade (Life Technologies) and analysed with ObserverD.1 or LSM710 confocal microscopes (Zeiss). Haematoxylin and eosin (H&E) staining was performed on 5-µm paraffin-embedded tissue sections. After deparaffinization and rehydration, sections were stained with haematoxylin (Gill no. 2) and eosin, covered with histomout and examined under an OberserverD.1 microscope with Zen software. For evaluation of erythrocytes, eosin fluorescence signals were captured and at least 60 high magnification fields from 3–4 tumours were analysed for each experimental group. Analysis was performed using ZEN software (Zeiss), ImageJ (version 1.49) or Imaris.
For VE-cadherin staining of tumour vasculature, tissue sections were fixed using 2% paraformaldehyde in PBS for 15 min at room temperature followed by three washes for 5 min with PBS and 10 min incubation in ice-cold methanol and another three washes for 5 min with PBS. Image IT enhancer was employed for 30 min at room temperature followed rinsing in PBS and one wash for 5 min with PBS. Blocking solution (PBS containing 10% goat serum and 2.5% mouse serum; Sigma) was used for 1 h at room temperature before staining procedure was started using anti-CD31 and anti-VE-cadherin (eBioscience 14-1441-82) diluted 1:50 in blocking solution incubated on tissue sections over night at 4 °C in a wet chamber. Secondary antibodies diluted 1:100 in blocking solution containing Hoechst 33342 were incubated for 2–3 h at room temperature. Mowiol was used as mounting medium after three finalizing washing steps with PBS for 5 min at room temperature.
Statistics
No statistical methods were used to predetermine sample size. To estimate the effect size for those experiments not involving animals and presented in the paper, one pilot experiment was performed. Then, usually a second experiment powered on what was observed in the pilot experiment was performed to attain significance and to test reproducibility. Data generally met the assumptions of the tests performed. The variance was in general similar between the groups that were being statistically compared and data met the assumptions of the tests. Statistical analysis was performed with GraphPad Prism 5.0. When comparing two groups, if not indicated otherwise, we used the two-tailed Mann-Whitney U-test. When comparing more than two groups, we used the one-way ANOVA. P values less than 0.05 were considered as significant, *P < 0.05, ** P < 0.01 and ***P < 0.001.
Data availability
The datasets generated during the current study are available from the corresponding author on reasonable request. The custom-written AFS Visual Basic macro for the time-lapse microscopy series with reflection-based autofocus was developed by A. Politi and J. Ellenberg (EMBL Heidelberg) and is available at http://www.ellenberg.embl.de/. The microarray data are available from the GEO data repository under the accession number GSE94504.
Extended Data
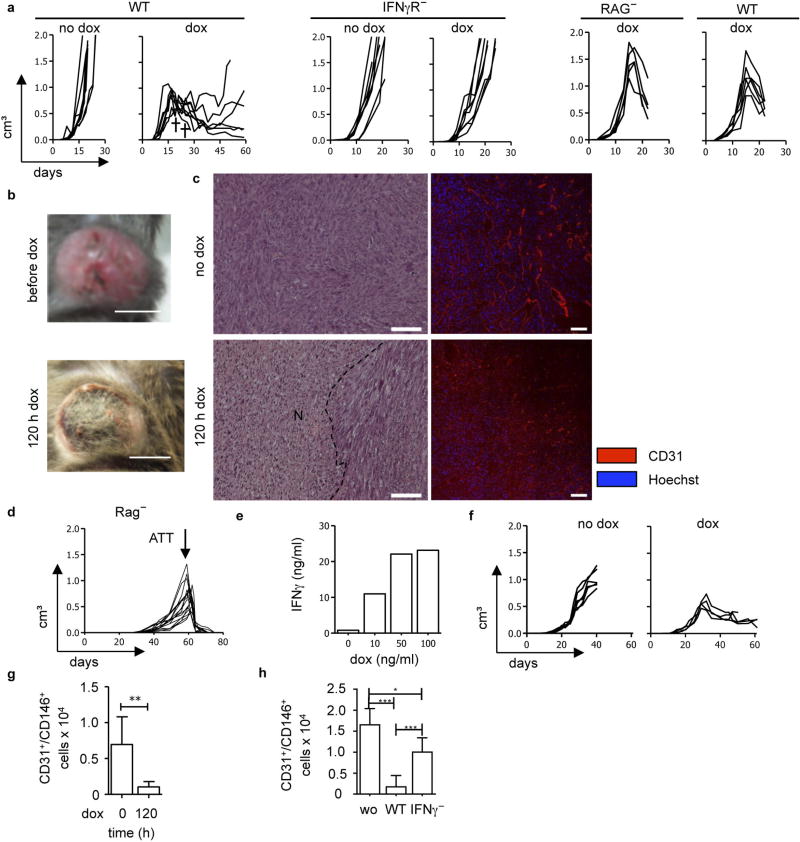
Extended Data Figure 1. Release of IFNγ in established tumours leads to necrosis, blood vessel reduction and tumour regression.
a-h, MCA313IFNγ-IND tumours (a–c), 16.113 tumours (d, h) and 16.113-999IFNγ-IND tumours (e–g). a , Without IFNγ induction, MCA313IFNγ-IND tumours grow progressively (1st panel). Dox-induced IFNγ expression in established MCA313IFNγ-IND tumours (2nd panel) leads to tumour regression in wild-type but not IFNγR− mice (3rd, 4th panel). Differences in tumour growth between ‘no dox’ and ‘dox’ groups in wild-type mice are statistically significant on days 19 (*), 23 (**) and 25 (***). IFNγ induction in wild-type mice at 642 ± 236 mm3 (the two crosses indicate mice that reached a humane endpoint and were taken out of the experiment) and in IFNγR− mice at 608 ± 130 mm3. No difference in tumour growth and IFNγ-induced tumour regression of MCA313IFNγIND tumours between Rag− and Rag-competent hosts (5th panel Rag−, n = 5; 6th panel wild type, n = 6). Dox administration at 1,304 ± 290 mm3 on day 15. b, c, MCA313IFNγ-IND tumours without and 120 h after dox. b, c, Macroscopic image (b; scale bars, 0.5 cm) and H&E staining (c) (1st row), N and dotted line indicate necrotic area (2nd row), immunohistology using anti-CD31 monoclonal antibody (scale bars, 100 µm). For H&E staining, three animals per group with 4 to 5 areas were compared and differences are statistically significant (***). d, T-cell-mediated rejection of 16.113 tumours. Mice (same as depicted in Fig. 1c) were subcutaneously injected with 106 16.113 cells. On day 57, 107 TCR transgenic T cells specific for SV40 large T antigen, epitope I (TCR-I), expressed by 16.113 tumour cells, were transferred when tumour size was 489 ± 253 mm3. Combined data from two experiments is shown (n = 16). e–g, Induction of IFNγ in established carcinomas leads to tumour regression and blood vessel reduction. e, Dox-dependent IFNγ expression by 16.113-999IFNγ-IND cells in vitro, analysed by ELISA (mean values from two experiments are shown). f, g, Dox-induced IFNγ expression in established 16.113-999IFNγ-IND tumours grown in Rag− mice leads to tumour regression (f) and blood vessel reduction (g). The relative number of tumour endothelial cells (CD31+CD146+) without and 120 h after IFNγ induction in tumours was determined from 107 tumour cells by flow cytometry. h, IFNγ released during T-cell-mediated rejection of 16.113 tumours contributes to blood vessel reduction. Tumours were established as in d, and either not treated, treated with 106 TCR-I-transduced T cells from either wild-type or IFNγ− mice. On day 5 after ATT, the relative number of tumour endothelial cells (CD31+CD146+) was determined as in g *P < 0.05, **P < 0.01 and ***P < 0.001. The number of mice, replications and sample size for each experiment are shown in Supplementary Table 3.
Extended Data Figure 2. Mice with conditional IFNγR expression.
a, Schematic representation of transgenes combined to generate mice with conditional IFNγR expression. b, c, Functional IFNγR expression in PIGΔIFNγR fibroblasts upon Cre-mediated excision of the stop cassette. b, Immortalized tail fibroblasts from PIGΔIFNγR mice were transfected with pBabe-puro-Cre plasmid, selected for puromycin resistance and analysed for GFP and IFNγR (CD119) expression by flow cytometry. Wild-type fibroblasts served as control. One representative out of two experiments is shown. c, IFNγ induces MHC-I upregulation in Cre-transfected fibroblasts from PIGΔIFNγR mice. Flow cytometry of MHC-I expression by fibroblasts from PIGΔIFNγR mice with (right panel) or without Cre-transfection (middle panel) (same fibroblasts as shown in b) that were cultured without (dotted line) or with 1 ng ml−1 IFNγ for 48 h (black line). Fibroblasts from wild-type mice served as control (left panel). One representative out of two experiments is shown. d, e, Cre-mediated recombination induces GFP expression in tumour stroma cells of PIGCMV-Cre, shown by immunohistology. MCA313IFNγ-IND tumours from PIGCMV-Cre (d) and PIGΔIFN-γR (e) mice GFP signals were amplified by anti-GFP antibody and are shown in green, staining with antibodies as indicated in red, overlay in yellow and Hoechst staining in blue. Scale bars, 50 µm. The number of mice, replications and sample size for each experiment are shown in Supplementary Table 3.
Extended Data Figure 3. GFP (IFNγR) expression in myeloid cells or fibroblasts of MCA313IFNγ-IND tumours in indicated mice and IFNγ signalling in T cells fails to contribute to tumour endothelial cell reduction.
a, PIGLys-Cre mice; b, c, PIGFSP-Cre. a, c, Immunohistology. GFP signals were amplified by anti-GFP antibody and are shown in green, staining with antibodies as indicated in red, overlay in yellow and Hoechst staining in blue. Scale bars, 50 µm. b, Flow cytometry for GFP expression of primary tail fibroblasts from PIGΔIFNγR (n = 6) and PIGFSP-Cre (n = 5) mice after 7 days of culture (mean 25.5% ±s.d. 12.8%). d, Rag− (n = 6) or Rag−IFNγR− mice (n = 5) were reconstituted with 2 × 10⁷ splenocytes from wild-type mice. Two weeks after T cell transfer, MCA313IFNγ-IND cells were injected and IFNγ was induced when tumours were established (846 ± 263 mm3). 5 days after IFNγ induction, endothelial cells from 107 tumour cells were analysed by flow cytometry. **P < 0.01. The number of mice, replications and sample size for each experiment are shown in Supplementary Table 3.
Extended Data Figure 4. Cre-mediated recombination in MCA313IFNγ-IND tumour endothelial cells of PDGFB-CreER-IRES-GFP × Rosa26-RFP mice and confounding effects of endogenous IFNγ.
a, Tumour sections of mice, treated with tamoxifen (upper left) or not (lower left), were stained with anti-CD31 antibodies (white). RFP expression (red) indicates tamoxifen-dependent recombination, GFP signals were amplified by anti-GFP antibody and are shown in green, indicating PDGFB promoter activity, overlay in yellow, Hoechst in blue. Panels to the right show single colours of the upper left panel. Scale bars, 50 µm. b, Flow cytometry of tumour-derived endothelial cells, gated on CD31+CD146+ cells, of tamoxifen-treated (right panel) or non-treated mice (left panel) reveals recombination (RFP+ cells). For the tamoxifen-treated group, one representative out of four experiments is shown (mean 75.4 ± s.d. 8.8% RFP+ cells). c, In PIGPDGFB-Cre mice treated with tamoxifen, GFP expression (reflecting both PDGFB-promoter-dependent Cre expression and excision of the stop cassette in PIGΔIFNγR mice) was detected in endothelial cells in MCA313IFNγ-IND tumours. c, GFP expression in endothelial cells of MCA313IFNγ-IND tumours of PIGPDGFB-Cre mice. Mice received tamoxifen starting 3 days before cancer cell injection. Scale bars, 50 µm. d, Tumour regression following dox application (dox was given at a size of 509 ± 119 mm3; n = 5 no dox, and n = 6 with dox). e, Necrosis is visible in tumours before and is increased 120 h after dox-mediated IFNγ induction. d, e, MCA313IFNγ-IND tumours grew slower than in wild-type mice even without IFNγ induction (d) and became necrotic (e), presumably because of low-level constitutive IFNγ present in the mice and primarily IFNγ R-expressing endothelial cells being able to consume it. Scale bars, 0.5 cm. d, IFNγ induction in established MCA313IFNγ-IND tumours in PIGPDGFB-Cre mice induced tumour regression, and reduction of endothelial cells (f, g). f, Reduced blood vessel density in MCA313IFNγ-IND tumours of PIGPDGFB-Cre mice 120 h after dox-mediated IFNγ induction. Tamoxifen treatment and immunohistology as in c. Scale bars, 100 µm. g, Reduced numbers of CD31+CD146+ cells in MCA313IFNγ-IND tumours 120 h after dox application. Endothelial cells from 107 tumour cells were analysed by flow cytometry (n = 3 no dox, n = 4 with dox). The number of mice, replications and sample size for each experiment are shown in Supplementary Table 3.
Extended Data Figure 5. In PIGPDGFB-Cre-ΔIFNγ mice, IFNγR is expressed in MCA313IFNγ-IND tumour endothelial cells and wound healing is impaired.
a, GFP is expressed in MCA313IFNγ-IND tumour endothelial cells. Scale bars, 50 µm. b, CD119 (1st column) and GFP (2nd column) expression in tumour endothelial cells from PIGPDGFB-Cre-ΔIFNγ mice treated (1st row, green histograms) or not treated with tamoxifen (2nd row, dotted line), PDGFB-CreER-IRES-GFPΔIFNγR treated with tamoxifen (3rd row, blue histograms) and PIGΔIFNγR treated with tamoxifen (4th row, red histogram) confirms that only after tamoxifen application in PIGPDGFB-Cre-ΔIFNγ mice both GFP and CD119 are induced. c, As very few CD11b+ (7.5%) and NK1.1+ (4.2%) cells in the tumour stroma of PIGPDGFB-Cre-ΔIFNγ were GFP+ (Supplementary Table 1b), nitric oxide production by tumour-derived CD11b+ cells as read-out for IFNγ responsiveness was analysed. 4 × 10⁵ purified CD11b+ cells of MCA313IFNγ-IND tumours from mice as indicated were exposed to 250 U ml−1 IFNγ for 24 h, supernatants were mixed with Griess reagent and absorbance measured at 540 nm (dotted line shows detection limit) mean ± s.d. d–f, Tumours progressing after prolonged IFNγ exposure are largely necrotic but still produce IFNγ . d, H&E staining of a tumour section (from mice depicted in Fig. 2i) after around 50 days of IFNγ exposure. One representative of four mice is shown. e, Tumour of a mouse without dox (small central necrosis, one representative of two mice). Necrotic areas are encircled (dotted line). Scale bars, 2 mm. f, Progressing tumours still produce IFNγ . Tumours were re-isolated after IFNγ induction from wild type (n = 1, day 116), PIGCMV-Cre(n = 3, day 92-116) and PIGPDGFB-Cre(n = 3, day 65–66). Re-isolated tumour cells were cultured in 500 ng ml−1 dox for 48 h. Supernatants were analysed by IFNγ ELISA, mean ± s.d. g, h, Impaired wound healing in PIGPDGFB-Cre-ΔIFNγ mice In the indicated mice bearing MCA313IFNγ-IND tumours (approximately 50 mm3), a wound of 5 mm diameter was instilled. g, Wild type (n = 3), IFNγR− (n = 3) and mice with endothelial-specific IFNγR expression (n = 6) were dox-treated (circles) or left untreated (squares); wild-type (n = 3) and IFNγR− (n = 2) and mice with endothelial-specific IFNγR expression (n = 4). Wound healing was recorded. Differences in mice with endothelial-specific IFNγR became significant at day 6 (*) and were highly significant at day 18 (***). h, Representative pictures (wild type, day 14; IFNγR−, day 14; PIGPDGFB-Cre-ΔIFNγ , day 21). *P < 0.05, **P < 0.01 and ***P < 0.001. The number of mice, replications and sample size for each experiment are shown in Supplementary Table 3.
Extended Data Figure 6. Induction of IFNγ–GFP fusion protein induces regression of established J558LIFNγ-GFP-IND tumours and blood vessels.
a, 106 J558LIFNγ–GFP-IND cells were injected into Rag mice that were untreated (left panel) or treated with dox (right panel) when tumours reached a size of 461 ± 230 mm3. The crosses indicate mice that reached a humane endpoint and were taken out of the experiment (n = 10). b, Window chamber imaging of a J558LIFNγ–GFP-IND tumour at low magnification. The same procedure as described in Fig. 3c. Two weeks established J558LIFNγ-GEP-IND tumour was imaged for 6 days. Blue, cancer cells; green, IFNγ–GFP fusion protein and right vascular network. One representative of three experiments is shown. c, d, Quantification of histological analysis for CD31 and cleaved caspase 3 (CC3) staining, respectively. Each dot represents one field of view analysed by ImageJ. e, Representative CD31 and CC3 staining before and 120 h after dox. f, Quantification of ERG+ nuclei from immunohistology. g, Representative ERG staining before and 120 h after dox. Scale bars, 100 µm. Three tumours with 4–6 fields of view were analysed. ***P < 0.001. The number of mice, replications and sample size for each experiment are shown in Supplementary Table 3.
Extended Data Figure 7. Induction of TNF–GFP fusion protein induces regression of established J558LTNF-GFP-IND tumours and bursting of blood vessels.
a, 106 J558LTNF-GFP-IND cells were injected into Rag− mice that were left untreated (left panel) or treated with dox (right panel) when tumours had a size of 611 ± 201 mm3. Tumours eventually relapsed owing to selection of TNF–GFP loss variants (data not shown) (n = 9 no dox; n = 10 with dox). b, Window chamber imaging of a J558LTNF-GFP-IND tumour at lower magnification. The same procedure as described in Fig. 3c. Two-week-established J558LTNF-GFP-IND tumour was imaged for 2 days. Blue, cancer cells; green, TNF–GFP fusion protein and right vascular network. One representative out of four experiments is shown. c, d, Quantification of histological analysis for CD31 and cleaved caspase 3 (CC3) staining, respectively. Each dot represents one field of view analysed by ImageJ. e, Representative CD31 and CC3 staining before and 120 h after dox. f, Quantification of ERG+ nuclei from immunohistology. g, Representative ERG staining without and 120 h after dox. Scale bars, 100 µm. Three tumours with 4–6 fields of view were analysed. **P < 0.01 and ***P < 0.001. The number of mice, replications and sample size for each experiment are shown in Supplementary Table 3.
Extended Data Figure 8. Erythrocyte extravasation after induction of TNF–GFP but not IFNγ-GFP.
a, J558LIFNγ-GFP-IND or J558LTNF-GFP-IND tumours were established for two weeks and mice were dox-treated for 48 h or left untreated. Then, tumour sections were stained with H&E. In the upper row light microscopy and in the lower row eosin fluorescence signals were captured. Shown are representative sections from tumours treated with dox for 48 h. Scale bars, 100 µm. b, Quantification of erythrocytes in high magnification fields (HMF) using the ImageJ program. Number of analysed HMF: no dox IFNγ–GFP, 69 HMF, three tumours; 48 h IFNγ–GFP, 97 HMF, four tumours; no dox TNF–GFP, 130 HMF, three tumours; 48 h TNF–GFP: 92 HMF, four tumours. Groups were compared by unpaired t-test. ***P < 0.001; ns, not significant. The number of mice, replications and sample size for each experiment are shown in Supplementary Table 3.
Extended Data Figure 9. Activated but not normal vessels regress upon IFNγ exposure and regression is accelerated in Irf4− mice; IFNγ derived from T cells induces similar changes in gene expression as IFNγ from tumours.
a, No changes in blood vessel density in spleen and kidney after IFNγ induction. Anti-CD31 staining of kidney and spleen sections after IFNγ induction in MCA313IFNγ-IND tumours grown in wild-type mice (n = 2). Scale bars, 50 µm. b, Results of gene expression analysis as number of IFNγ-induced genes (log2 fold change) in tumour endothelial cells of J558LIFNγ-GFP-IND tumours (n = 3) and kidney endothelial cells (n = 3). After IFNγ induction, there are more genes differentially regulated in kidney than in tumour endothelial cells. c, Venn diagram showing the overlap between significantly differentially expressed genes (adjusted P value < 0.05) in endothelial cells of J558LIFNγ–GFP-IND, MCA313IFNγ-IND tumours (dox-treated versus untreated) and 16.113 tumours after treatment with IFNγ− versus wild-type TCR-I T cells. d, Scatter plots of data from Venn diagram displaying changes of all genes presented (that is, genes significantly differentially expressed in any of three comparisons). Endothelial cells from all three tumour types revealed strong similarity in regulated genes (Pearson correlation coefficients are calculated using all 410 genes). The union of 410 genes that were significantly differentially regulated in any of the three comparisons showed a correlation of approximately 0.8 across all 3 groups. Colours of dots match the colours of the numbers in the Venn diagram. The overlapping 10 genes (red dots) are highly deregulated in all three comparisons. e, Representative images of untreated or IFNγ-treated (10 ng ml−1 for 96 h) HUVECs, stained with phalloidin (green) and antibody against VE-cadherin (red). f, IRF4 is induced in mouse endothelial (SEND.1) cells 48 h after IFNγ (5 U ml−1) treatment. Cells were stained with anti-IRF4 monoclonal antibody, using transcription factor staining kit, and analysed by flow cytometry (grey, isotype control; dotted line, without IFNγ; black line, IFNγ). g, Endothelial cells from 107 MCA313IFNγ-IND cells grown in heterozygous Irf4WT/− or Irf4−/− mice that were treated with dox or left untreated. CD31+CD146+ cells were analysed by flow cytometry. h–j, Immunohistology of MCA313IFNγ-IND tumours grown in heterozygous Irf4WT/− or Irf4− mice, either treated or not with dox and stained for ERG (h), CD31 and CC3 (i, j). *P < 0.05, **P < 0.01 and ***P < 0.001. The number of mice, replications and sample size for each experiment are shown in Supplementary Table 3.
Extended Data Figure 10. IFNγ-mediated blood vessel regression in MCA313IFNγ-IND tumours of PIGPDGFB-Cre-ΔIFNγ mice.
a-c, Non-apoptotic vessel regression in MCA313IFNγ-IND tumours. a, Representative staining for ERG and CC3. Scale bar, 100 µm. b, c, ERG+ nuclei (b) and ERG+CC3+ cells (c). d, f, Quantification of histological analysis for CD31 (d) and CC3 (f). e, Representative staining of CD31 and CC3. g, Quantification of histological analysis for collagen IV (Col4). h, Representative staining of CD31 and collagen IV staining at 48 h at higher magnification. i, Representative staining of CD31 and collagen IV. White arrows indicate collagen IV staining not associated with CD31 staining (h, i). Scale bars, 100 µm. j, Quantification of histological analysis for NG2. k, Representative staining of CD31 and NG2. Each dot shows one field of view analysed by ImageJ (d, f, g, j). l, Ratio of co-localization of NG2 and CD31. m, VE-cadherin, CD31 and DAPI staining without and 24 h after IFNγ induction. n, Electron microscopy analysis of blood vessels from MCA313IFNγ-IND tumours grown in PIGPDGFB-Cre-ΔIFNγ mice. Electron micrographs show non-occluded vessel (left) and occluded vessel (right). Lumen of capillaries (asterisks), erythrocytes (Er), endothelial cells (En) and macrophages (M) are labelled. Scale bar, 5 µm. o, Three tumours (for each two specimens) and in total 32 vessels without dox and 38 vessels after 48 h after dox were analysed by electron microscopy for vessel occlusion (bar diagram). ** P <0.01 and *** P < 0.001. The number of mice, replications and sample size for each experiment are shown in Supplementary Table 3.
Supplementary Material
Acknowledgments
We thank R. Naumann, S. Jähne, T. Schüler, A. Sporbert, M. Richter, M. Schreiber, I. Gavvovidis, B. Purfürst and S. Fillatreau for support. This work was supported by the DFG through SFB-TR36 (to T.K., W.U. and T.B.), the Einstein Stiftung Berlin (to H.S. and T.B.) and the NIH (RO1-CA37156 and RO1-CA22677 to H.S.). M.Lo. was supported by Rhön-Klinikum-AG.
Reviewer Information Nature thanks T. Curiel, M. De Palma and S. Turley for their contribution to the peer review of this work.
Footnotes
Online Content Methods, along with any additional Extended Data display items and Source Data, are available in the online version of the paper; references unique to these sections appear only in the online paper.
Supplementary Information is available in the online version of the paper.
Author Contributions T.K. and C.F. planned and performed most experiments. A.A., C.I., R.W. and H.S. generated and analysed imaging experiments. D.Br. established MCA313 cells. M.R. contributed ATT experiments. M.Le. contributed T cell experiments and performed retroviral gene transfer. S.K. generated and analysed transmission electron microscopy data. A.T. established 16.113-999 cells. G.P. and N.H. performed gene expression analysis. A.I. and D.Be. performed bioinformatics analysis. A.S. and H.G. advised and contributed HUVEC-experiments. D.S., B.E. and W.U. generated constructs. A.H. and H.Y. performed two-photon and VE-cadherin microscopy. H.J.F., M.F. and M.Lo. provided mice. T.B. and T.K. conceived the project, analysed data and wrote the manuscript. All authors revised the manuscript.
The authors declare no competing financial interests. Readers are welcome to comment on the online version of the paper. Publisher’s note: Springer Nature remains neutral with regard to jurisdictional claims in published maps and institutional affiliations.
References
- 1.Blankenstein T. The role of tumor stroma in the interaction between tumor and immune system. Curr. Opin. Immunol. 2005;17:180–186. doi: 10.1016/j.coi.2005.01.008. [DOI] [PubMed] [Google Scholar]
- 2.Dighe AS, Richards E, Old LJ, Schreiber RD. Enhanced in vivo growth and resistance to rejection of tumor cells expressing dominant negative IFNγ receptors. Immunity. 1994;1:447–456. doi: 10.1016/1074-7613(94)90087-6. [DOI] [PubMed] [Google Scholar]
- 3.Braumüller H, et al. T-helper-1-cell cytokines drive cancer into senescence. Nature. 2013;494:361–365. doi: 10.1038/nature11824. [DOI] [PubMed] [Google Scholar]
- 4.Zhang B, Karrison T, Rowley DA, Schreiber H. IFN-γ - and TNF-dependent bystander eradication of antigen-loss variants in established mouse cancers. J. Clin. Invest. 2008;118:1398–1404. doi: 10.1172/JCI33522. [DOI] [PMC free article] [PubMed] [Google Scholar]
- 5.Listopad JJ, et al. Fas expression by tumor stroma is required for cancer eradication. Proc. Natl Acad. Sci. USA. 2013;110:2276–2281. doi: 10.1073/pnas.1218295110. [DOI] [PMC free article] [PubMed] [Google Scholar]
- 6.Franco CA, et al. Dynamic endothelial cell rearrangements drive developmental vessel regression. PLoS Biol. 2015;13:e1002125. doi: 10.1371/journal.pbio.1002125. [DOI] [PMC free article] [PubMed] [Google Scholar]
- 7.Bodnar RJ, Yates CC, Rodgers ME, Du X, Wells A. IP-10 induces dissociation of newly formed blood vessels. J. Cell Sci. 2009;122:2064–2077. doi: 10.1242/jcs.048793. [DOI] [PMC free article] [PubMed] [Google Scholar]
- 8.Ashkar AA, Di Santo JP, Croy BA. Interferon γ contributes to initiation of uterine vascular modification, decidual integrity, and uterine natural killer cell maturation during normal murine pregnancy. J. Exp. Med. 2000;192:259–270. doi: 10.1084/jem.192.2.259. [DOI] [PMC free article] [PubMed] [Google Scholar]
- 9.Schreiber K, Rowley DA, Riethmüller G, Schreiber H. Cancer immunotherapy and preclinical studies: why we are not wasting our time with animal experiments. Hematol. Oncol. Clin. North Am. 2006;20:567–584. doi: 10.1016/j.hoc.2006.03.001. [DOI] [PubMed] [Google Scholar]
- 10.Corthay A, et al. Primary antitumor immune response mediated by CD4+ T cells. Immunity. 2005;22:371–383. doi: 10.1016/j.immuni.2005.02.003. [DOI] [PubMed] [Google Scholar]
- 11.Lu Y, et al. Responsiveness of stromal fibroblasts to IFN-γ blocks tumor growth via angiostasis. J. Immunol. 2009;183:6413–6421. doi: 10.4049/jimmunol.0901073. [DOI] [PubMed] [Google Scholar]
- 12.Qin Z, Blankenstein T. CD4+ T cell-mediated tumor rejection involves inhibition of angiogenesis that is dependent on IFNγ receptor expression by nonhematopoietic cells. Immunity. 2000;12:677–686. doi: 10.1016/s1074-7613(00)80218-6. [DOI] [PubMed] [Google Scholar]
- 13.Qin Z, et al. A critical requirement of interferon γ -mediated angiostasis for tumor rejection by CD8+ T cells. Cancer Res. 2003;63:4095–4100. [PubMed] [Google Scholar]
- 14.Coughlin CM, et al. Tumor cell responses to IFNγ affect tumorigenicity and response to IL-12 therapy and antiangiogenesis. Immunity. 1998;9:25–34. doi: 10.1016/s1074-7613(00)80585-3. [DOI] [PubMed] [Google Scholar]
- 15.Luster AD, Unkeless JC, Ravetch JV. γ -interferon transcriptionally regulates an early-response gene containing homology to platelet proteins. Nature. 1985;315:672–676. doi: 10.1038/315672a0. [DOI] [PubMed] [Google Scholar]
- 16.Sgadari C, et al. Mig, the monokine induced by interferon-γ, promotes tumor necrosis in vivo. Blood. 1997;89:2635–2643. [PubMed] [Google Scholar]
- 17.Deng J, et al. IFNγ -responsiveness of endothelial cells leads to efficient angiostasis in tumours involving down-regulation of Dll4. J. Pathol. 2014;233:170–182. doi: 10.1002/path.4340. [DOI] [PubMed] [Google Scholar]
- 18.Tellides G, et al. Interferon-γ elicits arteriosclerosis in the absence of leukocytes. Nature. 2000;403:207–211. doi: 10.1038/35003221. [DOI] [PubMed] [Google Scholar]
- 19.Briesemeister D, et al. Tumor rejection by local interferon gamma induction in established tumors is associated with blood vessel destruction and necrosis. Int. J. Cancer. 2011;128:371–378. doi: 10.1002/ijc.25350. [DOI] [PubMed] [Google Scholar]
- 20.Anders K, et al. Oncogene-targeting T cells reject large tumors while oncogene inactivation selects escape variants in mouse models of cancer. Cancer Cell. 2011;20:755–767. doi: 10.1016/j.ccr.2011.10.019. [DOI] [PMC free article] [PubMed] [Google Scholar]
- 21.Mazzieri R, et al. Targeting the ANG2/TIE2 axis inhibits tumor growth and metastasis by impairing angiogenesis and disabling rebounds of proangiogenic myeloid cells. Cancer Cell. 2011;19:512–526. doi: 10.1016/j.ccr.2011.02.005. [DOI] [PubMed] [Google Scholar]
- 22.Schietinger A, et al. Longitudinal confocal microscopy imaging of solid tumor destruction following adoptive T cell transfer. OncoImmunology. 2013;2:e26677. doi: 10.4161/onci.26677. [DOI] [PMC free article] [PubMed] [Google Scholar]
- 23.Hock H, et al. Mechanisms of rejection induced by tumor cell-targeted gene transfer of interleukin 2, interleukin 4, interleukin 7, tumor necrosis factor, or interferon γ. Proc. Natl Acad. Sci. USA. 1993;90:2774–2778. doi: 10.1073/pnas.90.7.2774. [DOI] [PMC free article] [PubMed] [Google Scholar]
- 24.Augustin HG, Braun K, Telemenakis I, Modlich U, Kuhn W. Ovarian angiogenesis Phenotypic characterization of endothelial cells in a physiological model of blood vessel growth and regression. Am. J. Pathol. 1995;147:339–351. [PMC free article] [PubMed] [Google Scholar]
- 25.Modlich U, Kaup FJ, Augustin HG. Cyclic angiogenesis and blood vessel regression in the ovary: blood vessel regression during luteolysis involves endothelial cell detachment and vessel occlusion. Lab. Invest. 1996;74:771–780. [PubMed] [Google Scholar]
- 26.Guo S, et al. IRF4 is a novel mediator for neuronal survival in ischaemic stroke. Cell Death Differ. 2014;21:888–903. doi: 10.1038/cdd.2014.9. [DOI] [PMC free article] [PubMed] [Google Scholar]
- 27.Rothstein JL, Schreiber H. Synergy between tumor necrosis factor and bacterial products causes hemorrhagic necrosis and lethal shock in normal mice. Proc. Natl Acad. Sci. USA. 1988;85:607–611. doi: 10.1073/pnas.85.2.607. [DOI] [PMC free article] [PubMed] [Google Scholar]
- 28.Johansson A, Hamzah J, Payne CJ, Ganss R. Tumor-targeted TNFα stabilizes tumor vessels and enhances active immunotherapy. Proc. Natl Acad. Sci. USA. 2012;109:7841–7846. doi: 10.1073/pnas.1118296109. [DOI] [PMC free article] [PubMed] [Google Scholar]
- 29.Refaeli Y, Van Parijs L, Alexander SI, Abbas AK. Interferon γ is required for activation-induced death of T lymphocytes. J. Exp. Med. 2002;196:999–1005. doi: 10.1084/jem.20020666. [DOI] [PMC free article] [PubMed] [Google Scholar]
- 30.Hemmi S, et al. Cloning of murine interferon gamma receptor cDNA: expression in human cells mediates high-affinity binding but is not sufficient to confer sensitivity to murine interferon gamma. Proc. Natl Acad. Sci. USA. 1989;86:9901–9905. doi: 10.1073/pnas.86.24.9901. [DOI] [PMC free article] [PubMed] [Google Scholar]
- 31.Sakai K, Mitani K, Miyazaki J. Efficient regulation of gene expression by adenovirus vector-mediated delivery of the CRE recombinase. Biochem. Biophys. Res. Commun. 1995;217:393–401. doi: 10.1006/bbrc.1995.2789. [DOI] [PubMed] [Google Scholar]
- 32.Staveley-O’Carroll K, et al. In vivo ligation of CD40 enhances priming against the endogenous tumor antigen and promotes CD8+ T cell effector function in SV40 T antigen transgenic mice. J. Immunol. 2003;171:697–707. doi: 10.4049/jimmunol.171.2.697. [DOI] [PubMed] [Google Scholar]
- 33.Bhowmick NA, et al. TGF-β signaling in fibroblasts modulates the oncogenic potential of adjacent epithelia. Science. 2004;303:848–851. doi: 10.1126/science.1090922. [DOI] [PubMed] [Google Scholar]
- 34.Clausen BE, Burkhardt C, Reith W, Renkawitz R, Förster I. Conditional gene targeting in macrophages and granulocytes using LysMcre mice. Transgenic Res. 1999;8:265–277. doi: 10.1023/a:1008942828960. [DOI] [PubMed] [Google Scholar]
- 35.Claxton S, et al. Efficient, inducible Cre-recombinase activation in vascular endothelium. Genesis. 2008;46:74–80. doi: 10.1002/dvg.20367. [DOI] [PubMed] [Google Scholar]
- 36.Luche H, Weber O, Nageswara Rao T, Blum C, Fehling HJ. Faithful activation of an extra-bright red fluorescent protein in “knock-in” Cre-reporter mice ideally suited for lineage tracing studies. Eur. J. Immunol. 2007;37:43–53. doi: 10.1002/eji.200636745. [DOI] [PubMed] [Google Scholar]
- 37.Mittrücker HW, et al. Requirement for the transcription factor LSIRF/IRF4 for mature B and T lymphocyte function. Science. 1997;275:540–543. doi: 10.1126/science.275.5299.540. [DOI] [PubMed] [Google Scholar]
- 38.Willimsky G, Blankenstein T. Sporadic immunogenic tumours avoid destruction by inducing T-cell tolerance. Nature. 2005;437:141–146. doi: 10.1038/nature03954. [DOI] [PubMed] [Google Scholar]
- 39.Textor A, et al. Preventing tumor escape by targeting a post-proteasomal trimming independent epitope. J. Exp. Med. 2016;213:2333–2348. doi: 10.1084/jem.20160636. [DOI] [PMC free article] [PubMed] [Google Scholar]
- 40.Li LP, Schlag PM, Blankenstein T. Transient expression of SV 40 large T antigen by Cre/LoxP-mediated site-specific deletion in primary human tumor cells. Hum. Gene Ther. 1997;8:1695–1700. doi: 10.1089/hum.1997.8.14-1695. [DOI] [PubMed] [Google Scholar]
- 41.Schindelin J, et al. Fiji: an open-source platform for biological-image analysis. Nat Methods. 2012;9:676–682. doi: 10.1038/nmeth.2019. [DOI] [PMC free article] [PubMed] [Google Scholar]
Associated Data
This section collects any data citations, data availability statements, or supplementary materials included in this article.
Supplementary Materials
Data Availability Statement
The datasets generated during the current study are available from the corresponding author on reasonable request. The custom-written AFS Visual Basic macro for the time-lapse microscopy series with reflection-based autofocus was developed by A. Politi and J. Ellenberg (EMBL Heidelberg) and is available at http://www.ellenberg.embl.de/. The microarray data are available from the GEO data repository under the accession number GSE94504.


