

Abstract
Approaches to differentiating pluripotent stem cells (Pscs) into neurons currently face two major challenges—(i) generated cells are immature, with limited functional properties; and (ii) cultures exhibit heterogeneous neuronal subtypes and maturation stages. using lineage-determining transcription factors, we previously developed a single-step method to generate glutamatergic neurons from human Pscs. here, we show that transient expression of the transcription factors Ascl and dlx2 (Ad) induces the generation of exclusively GABAergic neurons from human Pscs with a high degree of synaptic maturation. these Ad-induced neuronal (in) cells represent largely nonoverlapping populations of GABAergic neurons that express various subtype-speci c markers. We further used Ad-in cells to establish that human collybistin, the loss of gene function of which causes severe encephalopathy, is required for inhibitory synaptic function. the generation of de ned populations of functionally mature human GABAergic neurons represents an important step toward enabling the study of diseases affecting inhibitory synaptic transmission.
Excitation and inhibition are the two basic interactions between neurons, which utilize glutamate and γ-aminobutyric acid (GABA) as the major neurotransmitters for excitatory and inhibitory signals, respectively. Abnormal GABAergic neuron function has been associated with multiple neurodevelopmental and neurodegenerative disorders. Considerable efforts have thus focused on deriving GABAergic neurons from human induced pluripotent stem (iPS) cells and embryonic stem (ES) cells as a system to study pathogenesis and identify potential therapeutic targets1–4. These studies endeavored to recapitulate developmental processes and derive properly regionalized neural progenitor cells. While this approach likely generates neuronal subtypes that are derived from regionally specified progenitors during development, it presents three important obstacles for translational research. First, spontaneous differentiation of neural progenitor cells leads to mixed neuronal cultures. Second, functional maturation requires extended culture periods, which complicates experimental design. Finally, multi-stage and prolonged differentiation procedures present technical challenges for reproducibility and consistency.
To overcome these problems, we and others have developed methods to directly convert fibroblasts into iN cells using defined reprogramming factors5–12. More recently, we extended this direct-reprogramming approach to iPS and ES cells5,13,14 and demonstrated that the transcription factor Ngn2, or Neurod1, could rapidly convert human iPS and ES cells into glutamatergic iN cells13. In the current study, we show that Ascl1 and Dlx2 together induce the differentiation of human neurons with homogeneous GABAergic neurotransmitter specification. These iN cells expressed genes representing GABAergic neuron subtypes of the telencephalon and diencephalon but not of the hindbrain or spinal cord, and the cells expressed subtype-specific markers somatostatin (SST), calbindin (CB) and calretinin (CR) in largely nonoverlapping subpopulations. We also illustrate that GABAergic iN cells can be used for analyzing inhibitory synapse-specific phenotypes associated with a human neurological disorder. In combination with our previously established glutamatergic Ngn2-iN cells, our approach provides a new platform for cellular modeling of human diseases.
Results
Identification of factors to induce GABAergic neurons
We previously observed that Ngn2, or Neurod1, rapidly converted ES and iPS cells into glutamatergic iN cells13. Notably, we also found that forced expression of Ascl1—a basic helix–loop–helix (bHLH) factor not conventionally associated with cell fate determination of glutamatergic neurons—induces excitatory iN cells from human PSCs with slower conversion kinetics14. In an effort to improve Ascl1-mediated neuronal induction, we found that coexpression of the zinc finger protein Myt1-like (Myt1l) greatly accelerated the appearance of morphologically complex iN cells (Supplementary Fig. 1).
In order to promote the GABAergic cell fate, we cloned six transcription factors known to play important roles during the formation of inhibitory neurons and expressed each of the factors together with Ngn2, Neurod1 or Ascl1 + Myt1l (collectively termed AM) in human ES cells using doxycycline-inducible lentiviral vectors. We cultured the transduced cells with mouse glia and performed patch–clamp recordings 28 d later to assess the formation of functional inhibitory synapses (Supplementary Fig. 1). The iN cells generated by various transcription factor combinations displayed three different patterns of spontaneous synaptic currents—exclusively excitatory postsynaptic currents (EPSCs), exclusively inhibitory postsynaptic currents (IPSCs), or both EPSCs and IPSCs (mixed currents). Of note, the combination of AM factors together with Dlx2 (AMD pool) produced cells with only IPSCs, which suggested that the cultures consisted of largely homogenous GABAergic neurons (Fig. 1a and Supplementary Fig. 1). We therefore decided to further characterize the iN cells generated by AMD.
Figure 1.
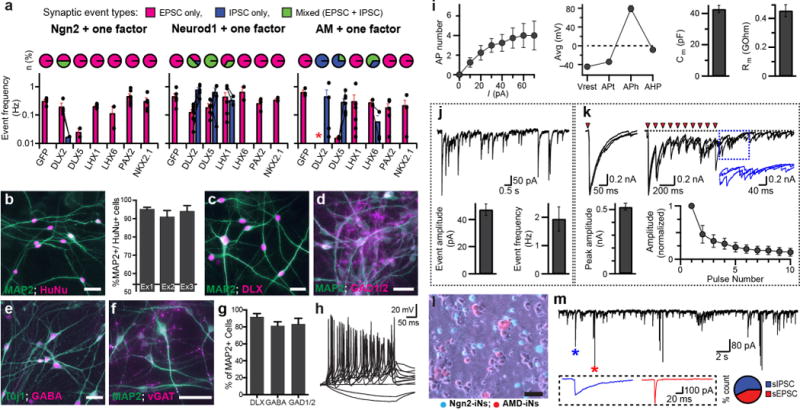
Rapid and efficient generation of human inhibitory iN cells with Ascl1, Dlx2 and Myt1l. (a) Identification of transcription factor (TF) combinations to generate GABAergic neurons. TF combinations give rise to different fractions of iN cells (pie charts) with spontaneous EPSCs (magenta), IPSCs (blue) or mixed postsynaptic currents (green) and varying frequencies (mean ± s.e.m.; n = 5–7 cells) of EPSCs and IPSCs (histograms). Filled circles represent values measured from individual cells. (b) Representative images of AMD-iN cells 5 weeks after infection (4 weeks after coculture with mouse glia). iN cells were detected with antibodies against MAP2 and Human Nuclear Antigen (HuNu). Bar graphs show percentage of HuNu-positive cellsthat express neuronal marker MAP2 (n = 3 independent experiments). (c–g) MAP2-expressing AMD-iN cells colabel with additional GABAergic markers including DLX proteins, GAD1/2 (GAD67/GAD65), GABA and vGAT. (h) Repetitive series of action potentials (APs) in response to step-current injections in AMD-iN cells. (i) Intrinsic and active membrane properties of AMD-iN cells observed as AP generation in response to amplitude of step-current stimulation (left); resting membrane potential (Vrest), AP threshold (APt), AP height (APh) and after hyperpolarization potentials (AHP) (second left); membrane capacitance (Cm, second right) and input resistance (Rm, right). Values are mean ± s.e.m. (n = 8–18 cells). (j) Spontaneous IPSCs recorded from AMD-iN cells. (k) Evoked IPSCs in AMD-iN cells as elicited by single (top left) or a train (top right) of stimulation (triangles). Inset, expanded view of asynchronous delayed IPSCs. Evoked IPSC amplitude (bar graph) and synaptic depression (filled circles) are presented as mean ± s.e.m. (l,m) AMD-iN cells received spontaneous excitatory (red asterisk and example trace) and inhibitory (blue asterisk and example trace) synaptic inputs when cocultured with Ngn2-iN cells. Pie chart indicates percentages of synaptic event types (IPSC, blue; EPSC, red) recorded from an AMD-iN cell cocultured with Ngn2-induced neurons. Scale bars, 50 um (b,c–f,l).
At 4 weeks post-exogenous gene induction (WPI), 93.2 ± 3.4% of all human cells were MAP2 positive, indicating successful neuronal conversion of almost the entire ES cell population (Fig. 1b). More importantly, the vast majority of iN cells expressed markers for GABAergic neurons, including the pan-DLX proteins (91.9% ± 6.6%), GABA (81.4% ± 4.7%), GAD1/2 (GAD67/65) (83.5% ± 6.7%) and vesicular GABA transporter vGAT (SLC32A1) (Fig. 1c–g). Whole-cell patch–clamp recordings showed that the cells were able to fire repetitive action potentials with prominent spike adaptation upon depolarization, and they exhibited both active and passive membrane properties indicating functional maturation (Fig. 1h,i). The AMD-induced neurons displayed spontaneous IPSCs and generated large GABAA-receptor-mediated evoked IPSCs upon extracellular field stimulations, confirming the predominant formation of inhibitory synapses (Fig. 1j,k). Moreover, when cocultured with Ngn2-iN cells, the AMD-induced neurons displayed both EPSCs and IPSCs, which indicated that despite having a presynaptic specification for GABAergic outputs, the AMD-iN cells are fully competent to receive excitatory synaptic inputs from glutamatergic Ngn2-iN cells (Fig. 1l,m).
To assess the reproducibility of our protocol among multiple PSC lines, we transduced another three independent iPS cell lines and quantified intrinsic membrane properties, including the frequency and amplitude of spontaneous IPSCs, of the AMD-induced neurons. All these parameters were statistically indistinguishable (one-way ANOVA, P > 0.05) among iN cells derived from different cell lines (Supplementary Fig. 2). We conclude that the combined expression of Ascl1, Myt1l and Dlx2 induces the differentiation of human PSCs into a virtually homogenous population of GABAergic neurons with high yield and reproducibility.
AMD-in cells exhibit forebrain GABAergic gene signatures
To characterize the AMD-iN cells, we performed RNA-seq on human AMD-iN cells cocultured with mouse glia for 4 weeks and computationally eliminated the mouse reads. AMD-iN cells robustly expressed markers of telencephalon such as FOXG1; whereas markers of the midbrain, hindbrain and spinal cord were largely absent (Supplementary Fig. 3). Numerous genes known to be expressed in GABAergic neurons15 and involved in GABAergic interneuron identity, maturation and function— such as DLX1/5/6, GAD1/2 and vGAT—were highly expressed in AMD-iN cells; transcripts of excitatory neuron genes vGluT1/2 were almost undetectable (Supplementary Fig. 3). The bulk of forebrain GABAergic neurons are generated in the medial, lateral and caudal ganglionic eminences (MGE, LGE and CGE); and we found markers of all three compartments expressed in AMD-iN cells (e.g., NKX2-1, LHX6, MAFB, MAF, NR2F2 and SP8). We also detected robust expression of gene sets characteristic of some MGE- and CGE-derived cortical interneurons (cINs), olfactory bulb interneurons, striatal projection neurons, retinal cells, prethalamic reticular nucleus cells and inhibitory cells derived from the zona limitans (zli) (Supplementary Fig. 3). Cortical interneurons are conventionally categorized based on neuropeptide and Ca2+ binding protein expression16. Of those markers, we found that somatostatin (SST) was most highly expressed; calbindin (CB or CALB1), calretinin (CR or CALB2), and neuropeptide Y (NPY) were also robustly detected; little parvalbumin (PV) or vasoactive intestinal polypeptide (VIP) was detected (Supplementary Fig. 3). Thus, mRNA profiling suggests that AMD-iN cells resemble forebrain GABAergic neurons derived from the ganglionic eminences.
Ascl and dlx2 are sufficient to generate GABAergic cells
We previously observed that Ascl1 alone can generate glutamatergic iN cells from fibroblasts and ES cells, and it induces endogenous MYT1L expression14. We thus speculated that AD may be sufficient to induce GABAergic iN cells. While AD-induced cells displayed less complex morphology during the early stage, the morphology improved over time and was comparable to that of AMD-iN cells by day 6 after transgene expression (Fig. 2a). Indeed, qPCR analysis demonstrated that endogenous MYT1L and its family members MYT1 and ST18 were induced around day 4 (Fig. 2b). MYT1L protein persisted in AD-iN cells for at least 5 weeks (Fig. 2c).
Figure 2.
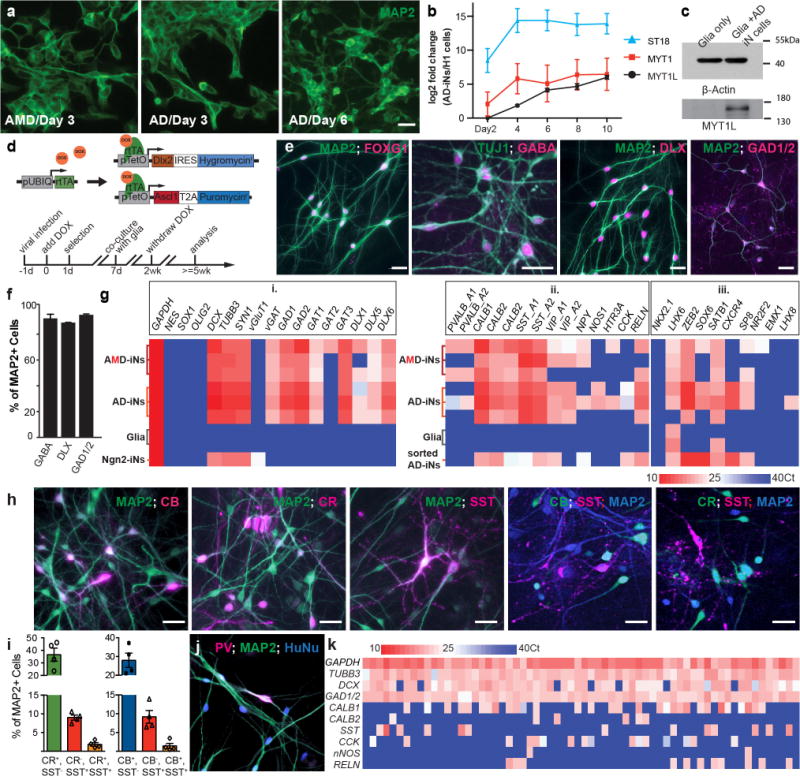
Transient expression of Ascl1 and Dlx2 (AD) generates GABAergic iN cells from human ES cells. (a) Omission of Myt1l slows the formation of neuronal morphologies, but exogenous Myt1l is not necessary for neuronal induction mediated by Ascl1 and Dlx2. (b) Endogenous MYT1 family members are induced in AD-transduced human ES cells (qRT-PCR results expressed as log2 fold change between AD-transduced cells and human ES cells. Mean ± s.e.m., n = 3 biological replicates). (c) MYT1L protein is present in AD-iN cells 5 weeks postinfection. (d) Lentiviral vectors and timeline for GABAergic iN cell induction. Cells are transduced with three viruses expressing rtTA, a fused Ascl1-T2A-puromycin resistance gene, and a fused Dlx2-hygromycin resistance gene. (e) AD-iN cells express telencephalic marker FOXG1 and GABAergic neuron markers (GABA, DLX proteins, GAD1/2 (GAD67/65)). (f) MAP2-positive cells coexpress GABA, DLX proteins or GAD1/2 (GAD65/67) after 5 weeks of conversion. (g) qRT-PCR analysis in AMD and AD-iN cells (5 WPI) cultured on mouse glia (three biological replicates each), mouse glia, and Ngn2-iN cells (i) or EGFP-sorted AD-iN cells (ii and iii) after coinfection of hES cells with a constitutive EGFP virus. (h) AD- iN cells cocultured with mouse glia for 4 weeks show highly branched MAP2-positive neurons that coimmunostain for CB, CR and SST. Expression of CB and SST or CR and SST is largely nonoverlapping. (i) Quantification of marker overlap. (mean ± s.e.m., n = 3 biological replicates). (j) PV-expressing AD-iN cells were detected. (k) Single-cell qRT-PCR analysis of 64 AD-iN cells for genes indicated on the left. Ct, crossing threshold (g,k). Scale bars, 50um (a,e,h,j).
Next, we asked whether the absence of Myt1l as an exogenous factor would impact neuronal specification. At 5 WPI, we observed that almost all neurons expressed the forebrain marker FOXG1 (93.5% ± 2.7%) and GABAergic neuron markers such as GABA (89.1% ± 3.5%), DLXs (88.5% ± 1.4%) and GAD65/67 (94.4% ± 4.2%) based on immunofluorescence analysis (Fig. 2d–f). For a more comprehensive characterization, we used qPCR analysis to interrogate the expression of a series of markers in AMD-, AD- and Ngn2-iN cells cocultured with mouse glia. Virtually none of the iN cells expressed progenitor cell markers (NES, SOX1, OLIG2) (Fig. 2g(i)). The glutamatergic neuron marker vGluT1 was only detected in Ngn2-iN cells, whereas GABAergic markers (vGAT, GAD1/2, DLX1/5/6, GAT1/3) were exclusively found in AMD- and AD-iN cells. We also detected expression of PV, CB, CR, SST, VIP, NYP, NOS1, HTR3A, CCK and Reelin (RELN); however, only CB, CR and SST were consistently expressed in all biological replicates of AMD- iN cells (Fig. 2g(ii)). The expression pattern of these interneuron markers was very similar in AD-iN cells, except that RELN and VIP were also consistently detected. Finally, we compared the expression pattern of transcription factors important for GABAergic neuron specification and found that LHX6, ZEB2 and SATB1 (but not NKX2-1) expression was consistently detected in AMD- and AD-iN cells (Fig. 2g(iii)). Since LHX6 and SATB1 were detectable in primary cultures of mouse glia, we verified their expression in FACS- purified AD-iN cells. These results show that AMD- and AD-iN cells have a similar morphology and gene expression pattern.
Single-cell characterization of Ad-in cells
Given the expression of several mutually exclusive subtype markers in the bulk analysis, we investigated the expression of these genes at the single-cell level. Immunofluorescence analysis showed that ~37% of the neurons were CR-positive, 28% were CB-positive and 9% were SST-positive at 5 WPI (Fig. 2h,i and Supplementary Fig. 4). Less than 2% of the AD-iN cells were CR/SST double positive or CB/SST double positive (Fig. 2h,i). We observed expression of ISL1 in about 20% of the cells and of NR2F2 and PV in a small fraction of AD-iN cells (Fig. 2j and Supplementary Fig. 4). On the other hand, we detected exceedingly few or no CTIP2-, NKX2-1-, SP8- and DARRP-32-expressing cells.
To expand the panel of markers, we performed single-cell qPCR on AD-iN cells at 5 WPI. Confirming our immunostaining results, ~80% of the cells that expressed any Ca2+-binding proteins or SST (41 cells) expressed either CB (22 cells), CR (4 cells), or SST (7 cells) (Fig. 2k). We also found several cells expressing CCK, a gene frequently expressed among human cortical interneurons17. The low frequency of PV-positive neurons was potentially due to the late developmental expression of this marker1,2,4,18. Previous studies showed that accelerated generation of motor neurons from PSCs could be achieved by the use of Notch inhibitors19. Indeed, when we treated AD-iN cells with a γ-secretase inhibitor (DAPT), we observed improved complexity of the neuronal morphology in terms of neurite arborization (Supplementary Fig. 5). However, DAPT treatment did not enhance the appearance of PV-expressing cells.
Prolonged culture increases synaptic maturation
To characterize the functional properties of AD-iN cells, we performed patch–clamp recordings from cells at 5 and 7 WPI. We found that AD-iN cells, at both timepoints, elicited spontaneous and current-induced action potentials and expressed voltage-gated ion channels (Fig. 3a,b and Supplementary Fig. 6). Their intrinsic membrane properties, including capacitance and input resistance, were similar between the two timepoints; but upon coculturing with glutamatergic Ngn2-iN cells, AD-iN cells showed improved maturation in terms of larger cell sizes and more ion channels in their membranes (Fig. 3a,b). Resting membrane potential was not affected by coculture. We then analyzed the synaptic properties of AD-iN cells. Immunoblotting showed that a large panel of synaptic markers was robustly expressed at 5 WPI (Supplementary Fig. 6). Moreover, MAP2-positive dendrites were decorated with the presynaptic proteins SYN1 and vGAT in a punctate pattern, which suggested the formation of GABAergic synapses (Supplementary Fig. 6). Spontaneous and evoked IPSCs could be readily recorded at 5 and 7 WPI, but both frequency and amplitude of synaptic events were increased at least two-fold by 7 WPI, showing a progressive maturation of inhibitory synapses in AD-iN cells even after 5 WPI (Fig. 3c,d, and Supplementary Fig. 6). As expected, AD-iN cells cocultured with Ngn2-iN cells were also able to receive excitatory synaptic inputs from neighboring neurons (Fig. 3e).
Figure 3.
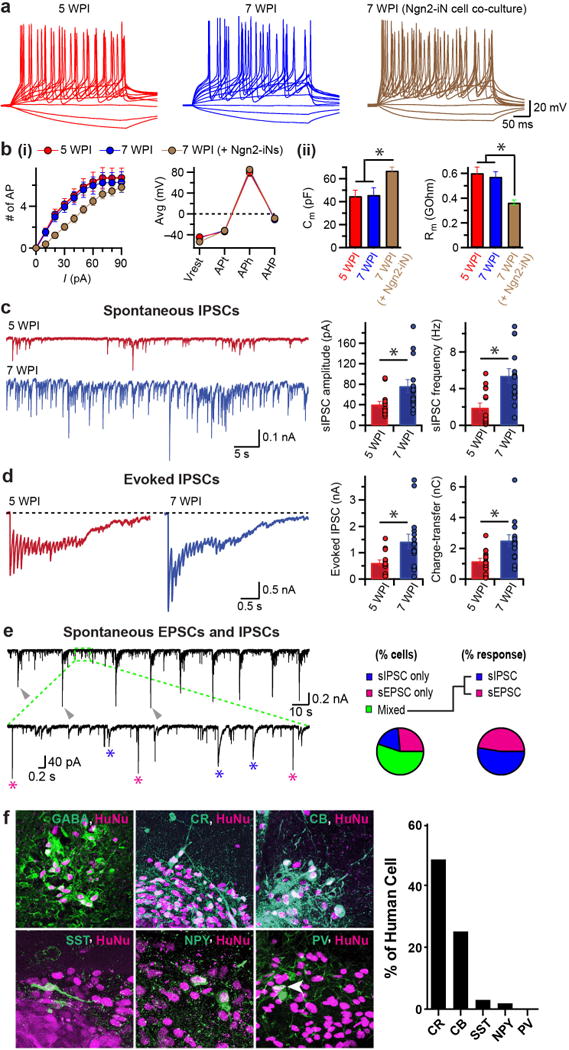
Functional maturation and synaptic integration of AD-iN cells in vitro and long-term stability of GABAergic fate in vivo. (a) Current injection-induced action potentials recorded from AD-iN cells as replated on mouse glia for 4 to 6 weeks (red and blue, respectively) or when cocultured with Ngn2-induced excitatory neurons for 6 weeks (brown). (b) AP-generation properties (i) measured as number of APs generated with current-pulse amplitude (left) and as resting membrane potential (Vrest), AP threshold (APt), AP height (APh) and after-hyperpolarization potentials (AHP) (right); and intrinsic properties (ii) measured as membrane capacitance (Cm, left) and input resistance (Rm, right). All values are mean ± s.e.m. (n = 14 cells, 5 WPI; n = 12 cells, 7 WPI;n = 32 cells, 7 WPI Ngn2-iN coculture; Student’s t-test; *, P > 0.05). (c) Sample traces (left) of spontaneous IPSCs and event amplitude and frequency (mean ± s.e.m., right), as recorded from AD-iN cells cocultured with mouse glia for 4 weeks (red) or 6 weeks (blue). (d) Sample traces of train-stimulation-induced evoked IPSCs (left) and first IPSC amplitude and total charge transfer from IPSC trains (mean ± s.e.m., right) recorded from AD-iN cells when coculturedwith mouse glia for 4 weeks (red) or 6 weeks (blue). (c,d) Filled circles represent individual cells (n = 15 cells per condition; Student’s t-test; *, P > 0.05). (e) Representative traces (left) of spontaneous EPSCs and IPSCs recorded from GABAergic AD-iN cell when cocultured with Ngn2-induced glutamatergic neurons for 7 weeks. Arrowheads, network activity. Inset, expanded view of boxed area. Asterisks, EPSC-like events with fast kinetics (magenta) and IPSC-like events with slow kinetics (blue). Pie charts indicate cell fraction with EPSCs (magenta), IPSCs (blue) or both types of responses (mixed, green; n = 54 cells). (f) Representative image of grafted AD-iN cells identified by human nuclei antibodies (magenta) and expressed GABAergic neuron markers including GABA, CR, CB, SST, NPY and PV (green). Histogram shows percentage of human cells that express different markers.
Transgene-independent stability of GABAergic phenotype
To assess whether the cellular identity of AD-iN cells requires continuous transgene expression, we withdrew doxycycline at various timepoints after infection and characterized the iN cells at 4 WPI. 14 d of doxycycline treatment was sufficient to generate stable neuronal cells in vitro (Supplementary Fig. 7). In order to evaluate the cell-fate stability of iN cells more rigorously, we collected EGFP-labeled AD-iN cells at day 14 and injected them into the subventricular zone and cerebral cortex of newborn severe combined immunodeficient (SCID) mice.
Ample human cells had engrafted 2 weeks post-transplantation as revealed by staining for human-specific nuclear antigen (HuNu) and EGFP (Supplementary Fig. 8). The majority of the cells remained close to the injection core and expressed the neuronal marker Doublecortin (DCX). By 3 months post-transplantation, most cells expressed the neuronal marker NeuN and GABA (Supplementary Fig. 8). We also noticed that NeuN expression increased over time, which suggested the continuous maturation of AD-iN cells in vivo. Similar to their differentiation in vitro, we observed SST, CR and CB expression in the grafted cells. We also detected suggestive colabeling of human cells with NPY and PV antibodies (Fig. 3f). Thus, GABAergic AD-iN cells are transgene independent and can stably integrate into the rodent brain, where they continue to mature.
Collybistin in human GABAergic synaptic transmission
Finally, we explored whether the GABAergic iN cells can be used to study inhibitory synapse function and uncover cellular phenotypes of a disease condition. Collybistin is a core component of inhibitory postsynapses and regulates the submembrane clustering of GABAARs20,21. Loss-of-function mutations in collybistin have been associated with X-linked mental disorder, epilepsy and hyperekplexia22,23. We performed shRNA-mediated knockdown (KD) of collybistin in iN cells using five shRNA constructs, and this KD resulted in significant reduction in collybistin expression with variable efficiencies (Fig. 4a and Supplementary Fig. 9). Strikingly, collybistin KD constructs caused a reduction of peak amplitude and total charge transfer of IPSCs upon local GABA administration (Fig. 4b–d), which suggested that expression level of collybistin directly affects the number of surface GABA receptors in human neurons. Next, we quantified inhibitory synaptic properties and found a reduction of both amplitude and frequency of spontaneous IPSCs in iN cells following collybistin KD (Fig. 4e–g). This effect was specific for inhibitory synapses, as there was no change in spontaneous EPSCs or intrinsic membrane properties (Supplementary Fig. 9). These findings are similar to findings in mouse collybistin mutant neurons24. Thus, the GABAergic iN cells are a valuable tool for studying inhibitory synaptic transmission in human neurons.
Figure 4.
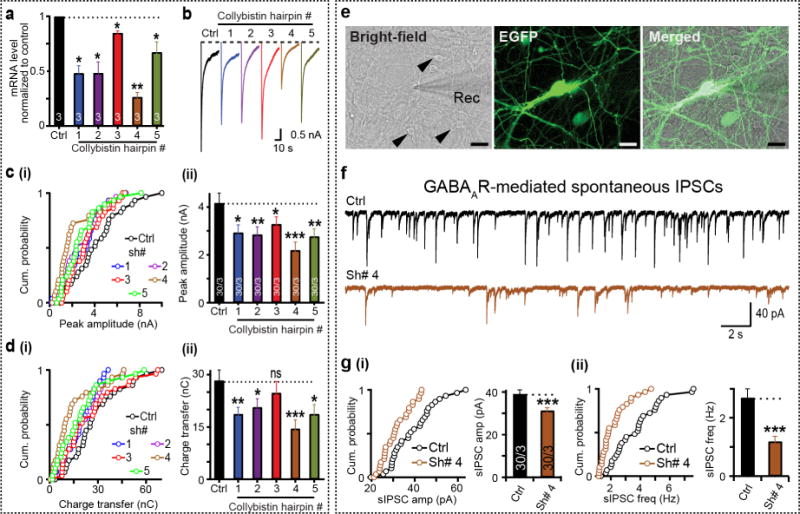
Induced GABAergic neurons for human neurological disease modeling. (a) Collybistin expression is reduced by shRNA knockdown (hairpin numbers 1–5) compared with control (Ctrl) in iN cells as measured by qRT-PCR (mean ± s.e.m.). (b) Representative traces of postsynaptic currents induced by exogenous application of GABA (1 mM). (c,d) Cumulative (cum.) plots (i) and summary graphs (ii) show reduction in average peak amplitude (c) and total charge-transfer (d) of GABA puff-induced IPSCs in human Ngn2-iN cells subjected to collybistin knockdown. (e) Patch–clamp configuration for postsynaptic recordings performed on day 28–30 human neurons expressing collybistin shRNAs. Collybistin KD iN cells (EGFP positive) were cocultured with Ascl1, Dlx2, Myt1l-generated iN cells (EGFP negative, black arrowheads). Rec, recording electrode. Scale bars, 15 μm. (f) Sample traces of GABAAR- mediated spontaneous IPSCs recorded from control (top) or collybistin shRNA no. 4 (Sh# 4)-infected neurons (bottom). (g) Cumulative plots (left) and average graphs (right) representing mean ± s.e.m. values of sIPSC amplitude (amp, i) and event frequency (freq, ii), recorded from control versus collybistin shRNA no. 4 – infected neurons in (e). Numbers inside bars indicate total number of independent batches (for batch-wise comparisons) or total number of cells recorded/number of batches. Two-tailed, unpaired Student’s t-test; ***, P < 0.005; **, P < 0.01; *, P < 0.05; n.s., not significant. P > 0.05 was used for all comparisons except batch-wise comparisons, where paired t-tests were performed. For cumulative plots, circles represent average values recorded from individual cells.
Discussion
In this study, we showed that the combination of the two transcription factors Ascl1 and Dlx2 is sufficient to convert human PSCs into essentially pure cultures of GABAergic neurons. The cells are generated in a single conversion step and reach synaptic maturity after 5 weeks. Given the importance of inhibitory neurotransmission in health and disease, AD-iN cells will likely become a critical addition in the portfolio of cell types to model diseases with human cells.
Several groups have reported stepwise maturation of GABAergic interneurons through a PSC-derived MGE-like intermediate1,2,4. Remarkably, transient expression of AD is sufficient to generate a panel of GABAergic neurons that are surprisingly similar to those matured from MGE-like cells, but AD expression requires much less time. Some functional properties of 7-week AD-iN cells (e.g., input resistance and resting membrane potential) were strikingly similar to those of MGE-like cells 10 weeks after differentiation (i.e.,15 weeks after PSC differentiation). Meanwhile, the peak voltage-gated Na+ and K+ channel currents and membrane capacitance of AD-iN cells were more comparable to those of progenitor-derived interneurons at 25 weeks after differentiation2. Apparently, the transcription factors induce not only specification but also an accelerated maturation program. It is worth noting that when human MGE-like cells were cocultured with mouse embryonic cortical neurons, prominent inhibitory synaptogenesis could be detected after ~4 weeks1, suggesting the feasibility of enhanced maturation of human MGE-like cell in vitro.
The fact that AD proved most competent to induce GABAergic neurons is well supported by a large body of literature25–29. For instance, both Ascl1 and Dlx2 are prominently expressed in germinal zones that produce GABAergic neurons, and ectopic expression of either factor in cortical progenitors induces markers of GABAergic neurons25,29. Ascl1 mutant mice show an aberrant development of ganglionic eminences25–28. Dlx2, in conjunction with other Dlx factors, is important for GABAergic neuron generation and migration15,27–30. The many AD expression domains during development may explain why AD induces multiple GABAergic subtypes from PSCs. However, not all neuronal subtypes generated from AD progenitors are produced from PSCs by AD expression, which suggests that additional factors may be required to generate these specific lineages.
In the future, it will be important to explore whether transcription factor combinations can generate selective interneuron subtypes such as PV interneurons. Surprisingly, combining Ascl1 and Dlx2 with additional subtype-specific transcription factors did not result in different subclasses of GABAergic neurons (Supplementary Fig. 10). Consistently, simultaneous expression of Asc1, Dlx2, Lhx6 and miR-9/9*-124 was recently shown to induce a GABAergic cell population similar to that induced by only Ascl1 and Dlx231. This suggests that timing and cellular context are critical for productive engagement of some transcription factors to specify specific neuronal subtypes3. While there is a wealth of information about mouse GABAergic neurons such as molecular markers, morphology and electrophysiological properties, similar depth of information for primary human GABAergic neurons is only emerging. Better characterization of primary human neurons will greatly facilitate the interpretation of properties of neurons generated in vitro, such as the GABAergic AD-iN cells described in this paper.
Methods
Cell culture
H1 (WA01) ES cells were obtained from WiCell Research Resources (Wicell, WI); the original untargeted iPS cell lines were derived from dermal fibroblasts or keratinocytes of two patients with dystrophic epidermolysis bullosa. Targeting of the COL7A1 locus and successful excision of both the reprogramming cassette and the positive selection cassette were achieved in both lines33. The clones that were karyotypically normal were used in the study and were named as iPSC#1 line and iPSC#2 line. iPSC#3 was derived from stored peripheral T cells obtained from the Rutgers University Cell and DNA Repository (RUCDR). ES and iPS cells were maintained as feeder-free cells in mTeSR1 medium (Stem Cell Technologies; ref. 34). Mouse glial cells were isolated from the forebrain of newborn wild-type CD1 mice35. Briefly, newborn mouse forebrain homogenates were digested with papain and EDTA for 15 min, cells were dissociated by harsh trituration to avoid growing of neurons and plated onto T75 flasks in MEM (Invitrogen) supplemented with 10% fetal bovine serum (FBS). Upon reaching confluence, glial cells were trypsinized and replated at lower density for a total of three times to remove potential trace amounts of mouse neurons before the glia cell cultures were used for coculture experiment with iN cells.
Lentiviral constructs and virus generation
The following lentivirus constructs were used: (i) lentivirus vector (FUW-TetO-Ngn2-P2A-puromycin) expressing Ngn2-P2A-puromycin cassette; (ii) lentivirus vector (FUW-TetO-Ngn2-T2A-blasticidin) expressing Ngn2-P2A-puromycin cassette; (iii) lentivirus vector (FUW-TetO-Ascl1-T2A-puromycin) expressing Ascl1-T2A-puromycin cassette; (iv) lentivirus vector (FUW-TetO-Dlx2-IRES-hygromycin) expressing Dlx2-IRES-hygromycin cassette; (v) lentivirus vectors expressing single transcription factors including Myt1L, Lhx1, Lhx6, Dlx5, Pax2 and Nkx2-1 under the control of TetO promoter; and (vi) lentivirus vector (FUW-rtTA) containing rtTA36. For collybistin knockdown (KD) experiments, five shRNA constructs (pLKO.1 backbone) targeting human collybistin isoforms were purchased from Mission Sigma (Sigma-Aldrich). Lentiviruses were produced as described5,10.
Generation of iN cells from human ES and iPS cells
Ngn2-iN cells were generated as described13. To generate AMD- and AD-iN cells, ES or iPS cells were treated with Accutase (Innovative Cell Technologies) and plated as dissociated cells in six-well plates (H1 cells: ~5 × 10⁴ cells/well; iPS cells: 7.5 × 10⁴ cells/well) on day −2. Cells were plated on plates coated with matrigel (BD Biosciences) mTeSR1 containing 2 μM thiazovivin (Bio Vision). On day −1, lentivirus prepared as described above (1.5 μl/well of six-well plate) was added in fresh mTeSR1 medium. On day 0, the culture medium was replaced with N2/DMEM/F12/NEAA (Invitrogen) containing doxycycline (2 g/l, Clontech) to induce TetO gene expression, and the culture was retained in the medium for ~2 weeks. On day 1, a 3-d drug-resistance selection period was started. On day 6, mouse glial cells were plated on matrigel-coated coverslips (~5 × 10⁴ cells/well of 24-well plate). On day 7, iN cells were dissociated using Accutase and plated on coverslips (~3 × 10⁵ cells/well of 24-well plate) in Neurobasal medium supplemented with B27/Glutamax (Invitrogen) containing BDNF (20ng/ml, Peprotech). Around day 10, Ara-C (2 g/l, Sigma) was added to the medium to inhibit astrocyte proliferation. After day 7, 50% of the medium in each well was exchanged every 2–3 d. FBS (1%) was added to the culture medium on day 10 to support astrocyte viability, and iN cells were assayed on day 35 (5 weeks) in most experiments. The efficiency of conversion of ES and iPS cells into iN cells was calculated from counts of cell densities in ten random fields on each coverslip (Fig. 1b) as the percentage of HuNu-positive cells that expressed MAP2 as revealed by immunofluorescence assay.
Transplantation
Cells were trypsinized and washed in L-15 medium containing 100 IU/ml DNase I (Roche) and concentrated via centrifugation at 600 g for 3 min. Newborn severe combined immunodeficient (SCID) mice (n = 8–10) regardless of sex were used as recipients for each experiment. P1-2 SCID recipients were anesthetized by hypothermia until pedal reflex disappeared, and subsequently placed on a stereotaxic platform. Concentrated cells (~1,000,000 cells/μl) were loaded into a beveled glass micropipette (Drummond Scientific), and two injections of 0.1 μl each were delivered into the forebrain of the recipient at 2.0 mm posterior, 1.4 mm lateral, 0.8 mm deep (targeting the subventricular zone) and 2.0 mm posterior, 1.4 mm lateral, 0.5 mm deep (targeting the cortex). The coordinates were zeroed anteriorly at the inner corner of the eye, laterally at the midpoint between the eyes and vertically at the skin surface. After the injections, recipients were placed on a heating pad until warm and active and returned to their mothers until weaning at P21. All animal experiments for the present study were performed with approval of the Stanford IACUC.
Immunofluorescence experiments
Immunofluorescence experiments were performed essentially as described5,10. Antibodies used include Calbindin (1:1,000, Swant, 300), Calretinin (mouse, 1:500, DAKO, M7245), Calretinin (mouse, 1:1,000, Swant, 6B3), Somatostatin (rabbit, 1:5,000, Bachem, T-4103.00), NKX2-1 (mouse, 1:300, Invitrogen, 18-0221), ISLET1 (mouse, 1:100, DSHB, 39.3F7), Pan DLX (rabbit, 1:1,000, gift from Y.M. Morozov, Department of Neurobiology, Yale University School of Medicine), NeuN (mouse, 1:100, Millipore, MAB377), GAD1 (mouse, 1:1,000, Millipore, MAB5406), GAD2 (mouse, 1:500, DSHB, GAD6), Synapsin-1 (rabbit, 1:1,000, Synaptic System, 106-002), DCX (rabbit, 1:1,000, Cell Signaling, 4604S), OLIG2 (rabbit, 1:1,000, Millipore, AB9610), TUJ1 (mouse, 1:1,000, Covance, MMS-435P), TUJ1 (rabbit, 1:1,000, Covance, MRB- 435P), VGAT (mouse, 1:1,000, Synaptic System, 131 003), Human nuclei antigen (mouse, 1:100, Millipore, MAB1281), GFP (chicken, 1:1,000, Aves Labs, GFP-1020), COUPTFII (mouse, 1:300, Perseus Proteomics, PP-H7147-00), MAP2 (chicken, 1:20,000, Abcam, AB5392), MAP2 (mouse, 1:500, Sigma Aldrich, M4403), GABA (rabbit, 1:1,000, Sigma Aldrich, A2052), Parvalbumin (mouse, 1:1,000, Sigma, P3088) (see also Supplementary Table 1).
RNA-sequencing experiments
Total RNA was purified with Trizol (Thermo Fisher Scientific) following the supplier’s recommended method and Poly-A selected using the MicroPoly(A) Purist Kit (Ambion). Samples were processed according to the manufacturer’s protocol. Subsequently, libraries were prepared following the dUTP protocol37. Sequencing reads (100 bp) were generated on Hi-Seq 2000 Illumina platforms. Given that the samples contained a mixed population of human and mouse cells, paired-end reads were aligned to both the human reference sequence NCBI Build hg19 and the mouse reference sequence NCBI Build 37/mm9 with TopHat (v1.1.3)38. Properly paired reads were extracted using the samtools function. Only properly paired reads to the human reference were considered for subsequent analysis. Expression levels of RefSeq-annotated genes were calculated in units of reads per kilobase of exon model per million mapped fragments (RPKM). Genes with low RPKM (average log2 RPKM across all samples less than 1) were removed. Differential expression analysis was performed using Students’ t-test function “t.test” in R, and genes with P value < 0.05 and at least two-fold expression change were defined as significant.
Gene expression analyses
For quantitative RT-PCR analyses of pooled cultured cells, RNA was isolated using the RNAqueous Kit (Applied Biosystems), treated with DNase (Applied Biosystems) and reverse transcribed with Superscript III (Invitrogen). mRNA levels were quantified by RT-PCR assay using the Applied Biosystems 7900HT Fast real-time PCR system and RQ analysis software. For quantitative RT-PCR analyses of single cells, single EGFP-labeled iN cells (n = 1) were sorted by FACS into individual wells of 96-well PCR plates using a protocol built into the FACSAriaII flow cytometer’s software package, and mRNA levels were measured using the Fluidigm Biomark dynamic array system as previously described39. Information on TaqMan assays used in the expression assay can be found in Supplementary Table 2. Human specific primer sets used to analyze collybistin mRNA expression included collybistin forward (5′-ATGATTGACA TTGCTATCGA-3′) and reverse (5′-CCAGTCTAGG ACAGAAGCC-3′); GAPDH forward (5′-TTGAGGTCAA TGAAGGGGTC-3′) and reverse (5′- GAAGGTGAAG GTCGGAGTCA-3′).
Electrophysiology
For electrophysiological characterization, iN cells were cocultured with mouse glia for an additional 4 to 6 weeks. Electrophysiology experiments were performed similarly to those described40. In brief, voltage-clamp recordings were performed in whole-cell configuration with internal solution containing (in mM): 135 CsCl2, 10 Hepes, 1 EGTA, 1 Na–GTP, and 1 QX-314 (pH adjusted to 7.4, 310 mOsm); whereas current-clamp internal solution contained (in mM): 130 KMeSO3, 10 NaCl, 10 HEPES, 2 MgCl2, 0.5 EGTA, 0.16 CaCl2, 4 Na2ATP, 0.4 NaGTP, and 14 Tris-creatine phosphate (pH adjusted with KOH to 7.3, 310 mOsm). The bath solution contained (in mM): 140 NaCl, 5 KCl, 2 CaCl2, 1 MgCl2, 10 glucose, and 10 HEPES-NaOH (pH 7.4).
Membrane potentials were maintained around −60 mV, and a series of step currents with incremental amplitude (10–12 steps, with 10 pA increment) were injected to elicit action potentials, except for spontaneous action potential recordings where resting membrane potential was not adjusted. Na+/K+ currents were recorded in voltage-clamp mode at a holding potential of −70 mV with step-voltage changes as indicated. Evoked synaptic currents were elicited essentially as previously described41 using an extracellular concentric bipolar stimulating electrode (FHC) connected to an Isolated Pulse Stimulator 2100 (A-M Systems). Pharmacological reagents used were Picrotoxin (50 μM, Tocris, GABAAR blocker) and CNQX (50 μM, Tocris, AMPAR blocker). All recordings were performed at room temperature.
Data presentation and statistics
All data shown are mean ± s.e.m.; all statistical analyses were performed using Student’s t-test (except when mentioned otherwise), comparing the test sample with the control sample examined in the same experiments.
Data availability statement
All sequencing data that support the findings of this study have been deposited in the National Center for Biotechnology Information Gene Expression Omnibus (GEO) and are accessible through the GEO Series accession number GSE97710. All other relevant data are available from the corresponding author on request.
Supplementary Material
Acknowledgments
This work was supported by the New York Stem Cell Foundation-Robertson Award (to M.W.), the NIH grants U19MH104172-01 and R01MH092931 (to M.W. and T.C.S.), HD032116 (to A.A.B.), MH049428 (to J.L.R.), P50-HG007735 (to H.Y.C.) and the DoD grant W81XWH-14-1-0307 (to M.W.). M.W. is a New York Stem Cell Foundation-Robertson Investigator, a Howard Hughes Medical Institute Faculty Scholar, and the Tashia and John Morgridge Faculty Scholar from the Child Health Research Institute at Stanford. T.C.S. is a Howard Hughes Medical Institute Investigator. N.Y. is supported by a 2014 NARSAD Young Investigator Award and a Siebel Foundation Scholarship. S.C. was supported by a postdoctoral grant (Stanford ChEM-H112878). H.A. was supported by postdoctoral fellowships from Swedish Research Council and Swedish Society for Medical Research.
Footnotes
Author Contribution
N.Y., S.C., T.C.S. and M.W. designed and performed the experiments and analyzed the data. S.M. helped with single-cell experiments and data analyses; Y.H.N.and J.A.J. provided experimental material and helped with biochemistry experiments. D.H. and C.E.A. helped with the disease modeling experiment. M.M. provided Myt1l antibody. H.A., Y.T., Q.F., A.A.B. and J.L.R. provided experimental material and helped with in vivo study and data analyses. O.W., M.L. and H.Y.C. helped with RNA-sequencing experiment and data analyses. N.Y., S.C. and M.W. wrote the paper.
References
- 1.Maroof AM, et al. Directed differentiation and functional maturation of cortical interneurons from human embryonic stem cells. Cell Stem Cell. 2013;2:559–572. doi: 10.1016/j.stem.2013.04.008. [DOI] [PMC free article] [PubMed] [Google Scholar]
- 2.Nicholas CR, et al. Functional maturation of hPSC-derived forebrain interneurons requires an extended timeline and mimics human neural development. Cell Stem Cell. 2013;2:573–586. doi: 10.1016/j.stem.2013.04.005. [DOI] [PMC free article] [PubMed] [Google Scholar]
- 3.Au E, et al. A modular gain-of-function approach to generate cortical interneuron subtypes from ES cells. Neuron. 2013;80:1145–1158. doi: 10.1016/j.neuron.2013.09.022. [DOI] [PMC free article] [PubMed] [Google Scholar]
- 4.Liu Y, et al. Directed differentiation of forebrain GABA interneurons from human pluripotent stem cells. Nat Protoc. 2013;8:1670–1679. doi: 10.1038/nprot.2013.106. [DOI] [PMC free article] [PubMed] [Google Scholar]
- 5.Pang ZP, et al. Induction of human neuronal cells by de ned transcription factors. Nature. 2011:220–223. doi: 10.1038/nature10202. [DOI] [PMC free article] [PubMed] [Google Scholar]
- 6.Yoo AS, et al. MicroRNA-mediated conversion of human broblasts to neurons. Nature. 2011:228–231. doi: 10.1038/nature10323. [DOI] [PMC free article] [PubMed] [Google Scholar]
- 7.Psterer U, et al. Direct conversion of human broblasts to dopaminergic neurons. Proc Natl Acad Sci USA. 2011;08:10343–10348. doi: 10.1073/pnas.1105135108. [DOI] [PMC free article] [PubMed] [Google Scholar]
- 8.Caiazzo M, et al. Direct generation of functional dopaminergic neurons from mouse and human broblasts. Nature. 2011:224–227. doi: 10.1038/nature10284. [DOI] [PubMed] [Google Scholar]
- 9.Victor MB, et al. Generation of human striatal neurons by microRNA-dependent direct conversion of broblasts. Neuron. 2014;8:311–323. doi: 10.1016/j.neuron.2014.10.016. [DOI] [PMC free article] [PubMed] [Google Scholar]
- 10.Vierbuchen T, et al. Direct conversion of broblasts to functional neurons by de ned factors. Nature. 2010:1035–1041. doi: 10.1038/nature08797. [DOI] [PMC free article] [PubMed] [Google Scholar]
- 11.Kim J, et al. Functional integration of dopaminergic neurons directly converted from mouse broblasts. Cell Stem Cell. 2011;9:413–419. doi: 10.1016/j.stem.2011.09.011. [DOI] [PMC free article] [PubMed] [Google Scholar]
- 12.Son EY, et al. Conversion of mouse and human broblasts into functional spinal motor neurons. Cell Stem Cell. 2011;9:205–218. doi: 10.1016/j.stem.2011.07.014. [DOI] [PMC free article] [PubMed] [Google Scholar]
- 13.Zhang Y, et al. Rapid single-step induction of functional neurons from human pluripotent stem cells. Neuron. 2013;8:785–798. doi: 10.1016/j.neuron.2013.05.029. [DOI] [PMC free article] [PubMed] [Google Scholar]
- 14.Chanda S, et al. Generation of induced neuronal cells by the single reprogramming factor ASCL1. Stem Cell Reports. 2014:282–296. doi: 10.1016/j.stemcr.2014.05.020. [DOI] [PMC free article] [PubMed] [Google Scholar]
- 15.Taniguchi H, et al. A resource of Cre driver lines for genetic targeting of GABAergic neurons in cerebral cortex. Neuron. 2011:995–1013. doi: 10.1016/j.neuron.2011.07.026. [DOI] [PMC free article] [PubMed] [Google Scholar]
- 16.Ascoli GA, et al. Petilla terminology: nomenclature of features of GABAergic interneurons of the cerebral cortex. Nat Rev Neurosci. 2008;9:557–568. doi: 10.1038/nrn2402. [DOI] [PMC free article] [PubMed] [Google Scholar]
- 17.Darmanis S, et al. A survey of human brain transcriptome diversity at the single cell level. Proc Natl Acad Sci USA. 2015;2:7285–7290. doi: 10.1073/pnas.1507125112. [DOI] [PMC free article] [PubMed] [Google Scholar]
- 18.Zecevic N, Hu F, Jakovcevski I. Interneurons in the developing human neocortex. Dev Neurobiol. 2011:18–33. doi: 10.1002/dneu.20812. [DOI] [PMC free article] [PubMed] [Google Scholar]
- 19.Du ZW, et al. Generation and expansion of highly pure motor neuron progenitors from human pluripotent stem cells. Nat Commun. 2015:6626. doi: 10.1038/ncomms7626. [DOI] [PMC free article] [PubMed] [Google Scholar]
- 20.Harvey K, et al. The GDP-GTP exchange factor collybistin: an essential determinant of neuronal gephyrin clustering. J Neurosci. 2004;2:5816–5826. doi: 10.1523/JNEUROSCI.1184-04.2004. [DOI] [PMC free article] [PubMed] [Google Scholar]
- 21.Mayer S, et al. Collybistin activation by GTP-TC10 enhances postsynaptic gephyrin clustering and hippocampal GABAergic neurotransmission. Proc Natl Acad Sci USA. 2013;0:20795–20800. doi: 10.1073/pnas.1309078110. [DOI] [PMC free article] [PubMed] [Google Scholar]
- 22.Shimojima K, et al. Loss-of-function mutation of collybistin is responsible for X-linked mental retardation associated with epilepsy. J Hum Genet. 2011:561–565. doi: 10.1038/jhg.2011.58. [DOI] [PubMed] [Google Scholar]
- 23.Lesca G, et al. De novo Xq11.11 microdeletion including ARHGEF9 in a boy with mental retardation, epilepsy, macrosomia, and dysmorphic features. Am J Med Genet A. 2011:1706–1711. doi: 10.1002/ajmg.a.34004. [DOI] [PubMed] [Google Scholar]
- 24.Papadopoulos T, et al. Impaired GABAergic transmission and altered hippocampal synaptic plasticity in collybistin-de cient mice. EMBO J. 2007;2:3888–3899. doi: 10.1038/sj.emboj.7601819. [DOI] [PMC free article] [PubMed] [Google Scholar]
- 25.Fode C, et al. A role for neural determination genes in specifying the dorsoventral identity of telencephalic neurons. Genes Dev. 2000:67–80. [PMC free article] [PubMed] [Google Scholar]
- 26.Casarosa S, Fode C, Guillemot F. Mash1 regulates neurogenesis in the ventral telencephalon. Development. 1999;2:525–534. doi: 10.1242/dev.126.3.525. [DOI] [PubMed] [Google Scholar]
- 27.Long JE, Cobos I, Potter GB, Rubenstein JLR. Dlx1&2 and Mash1 transcription factors control MGE and CGE patterning and differentiation through parallel and overlapping pathways. Cereb Cortex. 2009;9:i96–i106. doi: 10.1093/cercor/bhp045. [DOI] [PMC free article] [PubMed] [Google Scholar]
- 28.Long JE, et al. Dlx1&2 and Mash1 transcription factors control striatal patterning and differentiation through parallel and overlapping pathways. J Comp Neurol. 2009;2:556–572. doi: 10.1002/cne.21854. [DOI] [PMC free article] [PubMed] [Google Scholar]
- 29.Stühmer T, Anderson SA, Ekker M, Rubenstein JLR. Ectopic expression of the Dlx genes induces glutamic acid decarboxylase and Dlx expression. Development. 2002;29:245–252. doi: 10.1242/dev.129.1.245. [DOI] [PubMed] [Google Scholar]
- 30.Potter GB, et al. Generation of Cre-transgenic mice using Dlx1/Dlx2 enhancers and their characterization in GABAergic interneurons. Mol Cell Neurosci. 2009;0:167–186. doi: 10.1016/j.mcn.2008.10.003. [DOI] [PMC free article] [PubMed] [Google Scholar]
- 31.Sun AX, et al. Direct induction and functional maturation of forebrain GABAergic neurons from human pluripotent stem cells. Cell Rep. 2016:1942–1953. doi: 10.1016/j.celrep.2016.07.035. [DOI] [PubMed] [Google Scholar]
- 32.Yang N, et al. Generation of pure inhibitory neurons by transcription factor programming. Protoc Exch. 2017 doi: 10.1038/nmeth.4291. http://dx.doi.org/10.1038/protex.2017.042. [DOI] [PMC free article] [PubMed]
- 33.Sebastiano V, et al. Human COL7A1-corrected induced pluripotent stem cells for the treatment of recessive dystrophic epidermolysis bullosa. Sci Transl Med. 2014:264ra163. doi: 10.1126/scitranslmed.3009540. [DOI] [PMC free article] [PubMed] [Google Scholar]
- 34.Xu Y, et al. Revealing a core signaling regulatory mechanism for pluripotent stem cell survival and self-renewal by small molecules. Proc Natl Acad Sci USA. 2010;0:8129–8134. doi: 10.1073/pnas.1002024107. [DOI] [PMC free article] [PubMed] [Google Scholar]
- 35.Franke B, Figiel M, Engele J. CNS glia are targets for GDNF and neurturin. Histochem Cell Biol. 1998;0:595–601. doi: 10.1007/s004180050322. [DOI] [PubMed] [Google Scholar]
- 36.Lois C, Hong EJ, Pease S, Brown EJ, Baltimore D. Germline transmission and tissue-speci c expression of transgenes delivered by lentiviral vectors. Science. 2002;29:868–872. doi: 10.1126/science.1067081. [DOI] [PubMed] [Google Scholar]
- 37.Levin JZ, et al. Comprehensive comparative analysis of strand-speci c RNA sequencing methods. Nat Methods. 2010:709–715. doi: 10.1038/nmeth.1491. [DOI] [PMC free article] [PubMed] [Google Scholar]
- 38.Trapnell C, Pachter L, Salzberg SL. TopHat: discovering splice junctions with RNA-Seq. Bioinformatics. 2009;2:1105–1111. doi: 10.1093/bioinformatics/btp120. [DOI] [PMC free article] [PubMed] [Google Scholar]
- 39.Dalerba P, et al. Single-cell dissection of transcriptional heterogeneity in human colon tumors. Nat Biotechnol. 2011;29:1120–1127. doi: 10.1038/nbt.2038. [DOI] [PMC free article] [PubMed] [Google Scholar]
- 40.Chanda S, Marro S, Wernig M, Südhof TC. Neurons generated by direct conversion of broblasts reproduce synaptic phenotype caused by autism-associated neuroligin-3 mutation. Proc Natl Acad Sci USA. 2013;0:16622–16627. doi: 10.1073/pnas.1316240110. [DOI] [PMC free article] [PubMed] [Google Scholar]
- 41.Maximov A, Südhof TC. Autonomous function of synaptotagmin 1 in triggering synchronous release independent of asynchronous release. Neuron. 2005;8:547–554. doi: 10.1016/j.neuron.2005.09.006. [DOI] [PubMed] [Google Scholar]
Associated Data
This section collects any data citations, data availability statements, or supplementary materials included in this article.
Supplementary Materials
Data Availability Statement
All sequencing data that support the findings of this study have been deposited in the National Center for Biotechnology Information Gene Expression Omnibus (GEO) and are accessible through the GEO Series accession number GSE97710. All other relevant data are available from the corresponding author on request.