Abstract
Refinements to previous analyses of the natural correlation lengths within simple images and between images to be compounded are presented. Comparison of theoretical and experimental results show very good agreement for the case of Rayleigh scattering media: the correlation length within a simple image is comparable to the resolution cell size; the correlation length between images to be spatially compounded is comparable to, but smaller than, the transducer or array aperture; and the correlation length between images to be frequency compounded becomes a frequency comparable to their bandwidth. Complications arising from the presence of specular scattering or due to the presence of just a few scatterers are considered. It is shown that straightforward solutions exist for either one of these problems taken by itself. When they occur in combination, calibration techniques may lead to unambiguous identification of the contributions to the scattering from diffuse or incoherent scattering and from specular or coherent scattering, and to estimation of the density of diffuse scatterers.
I. Introduction
The purpose of this paper is to refine some results submitted by our group and others concerning the correlation lengths required for the analysis of the speckle fluctuations in medical ultrasonic images [1]–[4]. We shall speak of simple-scan images, i.e., conventional B-scan images, and images that are collected as candidates for compound scans, i.e., addition on an intensity or magnitude basis to reduce the coherence effects manifested in image speckle. We shall first discuss the correlation in the speckle within simple images; this is a principal determinant of the detectability of lesions in these images. Then we discuss the correlation between images made from different lines of sight, or at different frequencies, that are intended to be compounded to improve imaging performance and lesion detectability. These correlations are described in terms of the natural second order statistics previously discussed in [1] and [2].
We shall use the expressions “complex field,” “complex amplitude” (or simply “amplitude”) for the result of coherent amplitude (phasor) summation of the back-scattered signals, or pulse-echoes, at the transducer. The result of envelope detection of this signal is called the “magnitude” image, i.e., the B-scan image. The square of this latter quantity is called the “intensity” image. The properties of the amplitude are relatively straightforward to study for the case of Rayleigh scattering tissue and tissue-mimicking phantoms. The properties of square-law-detected intensity then follow directly from the application of the moment theorem for complex Gaussian statist ics. The results for the envelope detected magnitude are less amenable to theoretical analysis but have been shown to be almost identical to the intensity results when similarly normalized, and are in fact of no more essential or fundamental value than the latter [1], [2].
We shall assume that the reader is familiar with the theoretical and experimental basis for assuming complex circular Gaussian statistics in the backscattered complex amplitude for the case of diffusely scattering materials with many fine particles per resolution cell [1]. This leads to the familiar exponential probability density function (PDF) for the detected intensity, and the Rayleigh PDF for the detected magnitude, or envelope. These are referred to as first order statistics since they regard values measured at single positions.
Second order statistics regard the joint probabilities of obtaining pairs of values measured at two distinct positions, and are frequently summarized by their expected product as a function of the positions, i.e., their (two-point) correlation function. It has been known for some time that the self- or autocorrelation properties within simple images derive from the resolution cell of the image (at least in the Fraunhofer zone) [1], [2], whereas the crosscorrelation properties between images to be spatially compounded derive from the transducer size directly [3], [4]. We shall first review these two conditions. Then we discuss frequency compounding in the same light. Finally we consider the complications that arise when the scattering is not purely diffuse.
II. Correlations in Simple Images
The autocorrelation RX(x1, x2) of a process X is the joint moment of the random variables X(x1) and X(x2), expressed as the expected product [5], [1],
| (1) |
The autocovariance CX(X1, X2) is found from this as
| (2) |
and the superscript * refers to complex conjugation.
We showed in [1] that for the purely Rayleigh scattering condition the autocorrelation for the complex amplitude process X = 𝒶 is just the autocorrelation of the point spread function (PSF) p (Δx) that sums and reads out the scattering,
| (3) |
where ao is the total scattering amplitude, assumed constant over the region imaged, Δx = x2 − x1, and ⊛ is the convolution operation [1]. The normalization to the value at the origin
| (4) |
called k(Δx) in [1] and μ(Δx) in [6], is called the complex coherence factor. Normalized autocovariance functions are frequently called correlation functions.
For the Rayleigh scattering case (many fine scatterers per resolution cell) the autocorrelation and autocovariance for the detected intensity can be derived in very simple terms by using the Gaussian moment theorem, as we now show. We write the complex amplitude in terms of real and imaginary parts, gr and gi, for positions 1 and 2 as
| (5) |
respectively. The gs have the following properties, based on the complex Gaussian distribution with zero mean, variance along the real axis equal to variance along the imaginary axis, ψ, and uniform distribution of phase over −π to π:
| (6) |
We may write the intensity autocorrelation function as
| (7) |
This can be simplified by using the Gaussian moment theorem for zero mean Gaussian random variables Xi [7],
| (8) |
Eq. (7) then reduces to
| (9) |
when there are many scatterers per resolution cell and effectively Gaussian statistics. Using the properties of (6), this becomes finally
| (10a) |
| (10b) |
A characteristic dimension of the autocovariance function that appears repeatedly in the analysis of signal (lesion) detectability is the average speckle correlation cell size [1], [6]
| (11) |
which, for the Rayleigh scattering condition, is simply
The correlation structure is actually two dimensional in ultrasound scanning. One dimension of the structure is due to the shape of the diffraction pattern in the transverse (x) direction, and one dimension is due to the shape of the pulse in the range (z) direction. Assuming constant lateral phase—a very good approximation in the transducer focal region—the spread function of the system can be factored into p (x) p′ (z). Then the correlation cell integrals become two dimensional, factoring into a simple product of one dimensional integrals of the form of (11) [1]. The two-dimensional cell size is then an area that determines the smallest independent sample of the back-scattered signal from many fine scatterers. It is the density of these cells or samples over a lesion that determines its detectability [2].
It was a simple exercise in [1], then, to calculate CI(Δx) for the transverse direction x in ultrasonic scanning of the focal zone using the continuous wave, one-dimensional approximation to the diffraction pattern due to the insonification and read-out
| (12a) |
with fo = D′/zoλo. Here λo is the wavelength of the central frequency, zo is the distance of the source to the image point, D is the size of the transducer aperture [1] and D′ is its effective length in one dimension. For a rectangular array D′ = D; for a circular aperture the equivalent one dimensional length in the scanning direction is D′ = D/1.08 [1]. B is a normalization factor. We shall see that this one-dimensional continuous wave PSF is a good approximation for characterizing speckle correlation functions measured in the focal zone.
Experimental results from an analog (film) study were given in [1] and were compared with this simple theoretical analysis. The comparison with the normalized autocovariance function |ρ(Δx)|2 (4), (10b), (12a) was favorable when the long range trends due to the film and display were filtered out, demonstrating that the characteristic dimension for lateral correlation in simple images indeed derives from the lateral PSF, and is approximately equal to 0.9/fo. We have also confirmed this [10] using the simulations and measurements of Foster et al. [8]. Further confirmation has been presented by Oosterveld et al. [9] through simulations and laboratory measurements. In all of these cases the correlation function in terms of the magnitude or B-scan image is almost indistinguishable from the correlation function of the quadratically detected or intensity signal.
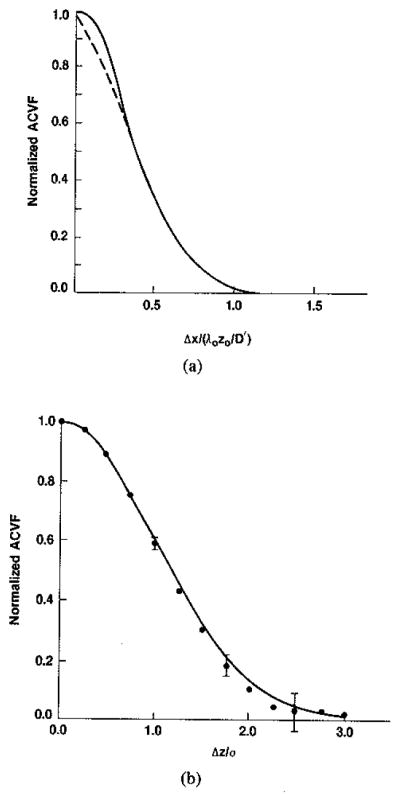
In the light of the similarity of the magnitude and intensity autocorrelation functions, we can also compare the normalized lateral correlation of intensities, |ρ(Δx)|2 (4), (10b), (12a), with recent numerical simulations and experimental data for magnitude from Zagzebski et al. (11). The results shown in Fig. 1(a) are in very good agreement except in the immediate neighborhood of the origin where the experimental result may be undersampled. (We shall comment further on the use of intensity correlation functions to approximate magnitude or B-scan correlations at the end of this section and again in succeeding sections).
Fig. 1.
(a) Theoretical (——) and experimental (---------) [11] autocovariance functions for intensity or magnitude in lateral direction. (b) Theoretical (——) and experimental (.........) autocovariance functions for intensity or magnitude in range direction. Error bars are plus and minus two standard errors of the mean. (Theoretical functions for intensity and magnitude can differ by 0–3 percent (see [1]).)
Theoretical results were given in [1] for the range direction, z, but experimental data were then unavailable to the authors. The results of Flax et al. [12] were invoked as corroboration of the applicability of (3), (5), and (10) to the range direction with the point spread function of the pulse approximated by a Gaussian with standard deviation σz,
| (12b) |
This leads to the result that the correlation cell size in the range direction, as a temporal dimension, is equal to 2.5 σz or 0.9/Δf where Δf is the full width at half maximum of the temporal frequency content of the pulse. Again, we have confirmed these results using the simulations and measurement data from Foster et al. [8] and further confirmation has been presented by Oosterveld et al. [9]. Finally, we have repeated our earlier work using a digital data acquisition system that does not suffer from the trends due to the (analog) film and display device. This gave excellent agreement with the simple theory and we present this next.
Digitized echo signals using a 19-mm, 3.5-MHz transducer were recorded from two graphite-gelatin phantoms [13] at the focal depth of about 80 mm. The phantoms contained a diffuse distribution of microscopic scatterers—about 2000 in a resolution cell of about 3 mm3. When this was imaged a Rayleigh histogram was obtained for the detected envelope signal (magnitude) with mean to standard deviation—pointwise signal-to-noise ratio SNRo–equal to 1.9. This is the expected result from purely diffuse scattering when there are many scatterers per resolution cell, and the image is often referred to as a fully developed speckle pattern. Intensity images were produced off-line by squaring the envelope detected RF signals. The average of the normalized autocovariance functions for the two cases is plotted in Fig. 1(b). This experimental result is in excellent agreement with the theoretically expected result using (12b) to calculate |ρ(Δz)|2. (For a Gaussian pulse the convolution in (3) is effectively undone by the squaring in (10), restoring the shape of (12b); i.e., CI(Δz) ~ p′ for Gaussian pulses.)
This comparison of experimental and theoretical correlations requires that a characteristic dimension of the transmitted pulse be determined. This was found by measuring the full width at half maximum, Fp, for a pulse reflected from a planar surface located at the focal length of the transducer, viz., Fp = 0.78 μs, or equivalently σz = 0.255 mm (see [1] and errata). The expected speckle cell size (11), [1], in millimeters is Scz = 2.51 σz; equivalently in microseconds, . The values predicted by these expressions are in very close agreement with Scz values measured from the experimentally determined autocovariance function. This is summarized in Table I. For the Rayleigh scattering case, then, the speckle cell size in the focal zone is completely determined by the resolution cell size, here, the pulse length. Thus the speckle cell size in this limit serves as a control measurement for any tissue characterization from second-order statistics of clinical image texture.
TABLE 1.
Measurement of Speckle Cell Size Versus Theoretical Predictions; The Axial Dimension.
| Theory | Measurement | |
|---|---|---|
| Scz = 2.51 σz | Scz = ∫CI(Δz)/CI(0) d Δz | |
| Phantom 1 | ||
| (c = 1540 m/s) (α = 0.65 dB/cm-MHz)* |
0.64 mm | 0.624 mm |
| Phantom 2 | ||
| (c = 1540 m/s) (α = 0.55 dB/cm-MHz) |
0.64 mm | 0.604 mm |
Attenuation coefficient
Almost identical results are obtained for the above exercise—when there are many scatterers per resolution cell—whether the analysis is carried out in terms of the magnitude signal or the intensity signal, as long as the autocovariance functions are normalized to unity at the origin. This was demonstrated in [1] and the mathematical basis for this was presented in the references cited there. Since the analysis in terms of intensity always leads to straightforward algebraic expressions we have preferred this route; the analysis in terms of magnitude leads to generalized hypergeometric functions [1], [14] that are not as transparent to intuition as the simple quadratic result in (10). (This is equally true of (17) and (22).)
III. Correlations Between Images to be Spatially Compounded
Burckhardt [3] and then Gehlbach in further detail [4] examined the correlations between images formed from slightly different transducer orientations that might serve as candidates for spatial compounding, in order to reduce the speckle fluctuations and improve lesion detectability. We now review their basic argument—following Gehlbach with minor modifications and with interjections from Burckhardt—and include a necessary refinement. We then compare the results of this treatment with recent data from Trahey et al. [15].
A transducer insonifies and interrogates a resolution cell in its focal zone containing many scattering particles, labeled by subscript i, and uniformly distributed over the scattering volume with random phase. The collected amplitude signal strength of (5) at transducer position 1 (for a given range) can be written as
| (13) |
where |Ti| represents the magnitude of the scattering amplitude from the ith particle, |pi| is the magnitude of the point spread function from the scatterer at position i evaluated at the center of the cell, and exp (iϑi) represents the combined phase of Ti and pi. If the transducer is now translated a distance b and rotated or steered to view the same scattering region as in Fig. 2, an additional phase (2π/λo) (2bx − b2)/2zo will be accumulated. As before, zo is the range and λo is the wavelength at the center frequency. The second term in this additional phase is not a function of the position of the scatterers and will cancel in all subsequent steps where we shall only be interested in intensities. The collected signal strength at position 2 can then be written
Fig. 2.
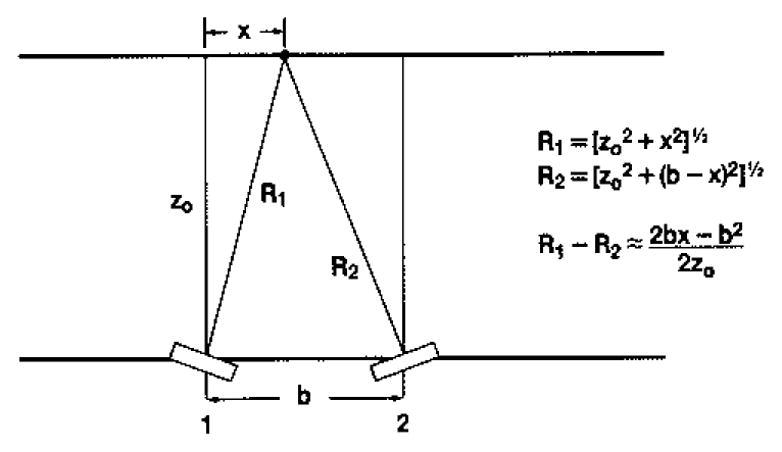
Schematic illustration of transducer viewing scatterers at position x from transducer location 1, then being translated to position 2 and rotated or steered to view same region.
| (14) |
One factor of two in the exponent of (14) accounts for the two-way pulse-echo distance. This result is equivalent to Burckhardt’s invoking the Fourier shift theorem or Gehlbach’s ray tracing.
The intensity corresponding to the signal 𝒶1, is
| (15) |
Gehlbach identifies the first term in this result as the incoherent intensity, i.e., the average over an ensemble of images detected with a square-law device. The second term is the speckle or fluctuating component. Its average over an ensemble of images is zero. The speckle term when the transducer is in a position corresponding to 𝒶2 has the additional factors from (14) yielding
We have then for the crosscorrelation of the speckle terms between transducer positions 1 and 2
| (16) |
The phase factors in ϑ are uniformly distributed over 2π radians with zero mean and have been averaged out to give this simpler expression.
We now invoke the separability of the far field or focal zone spread function into lateral and range components. Then going to a continuous representation we can write |pi| = |p(x)| |p′ (z)|, and the sums become integrals. The range integration takes a value independent of the translation b and only affects the normalization; the lateral integration factors into the product of two Fourier transformations (FT)
| (17) |
since the expected values of the uniformly distributed scattering intensities are independent of position and of each other, and average to give constants that have been absorbed into the normalization. Before carrying out the required FT’s, we shall make some general observations concerning this result.
If we had first calculated the correlation between the complex amplitude signal 𝒶1 of (13) and the complex conjugate of 𝒶2 of (14), we would have obtained the complex coherence factor
| (18) |
We could then have invoked the result of the Gaussian moment theorem cited above in (10) to obtain
| (19) |
which is equivalent to (17). We shall see that this is a general form common to many problems involving the random walk in the complex plane. The underlying physics determines the argument of the Fourier transformation, which in this section is in terms of the frequency variable 2b/λozo. We show next in Fig. 3 how the required Fourier transformations are calculated in terms of this variable and the transducer array length D.
Fig. 3.
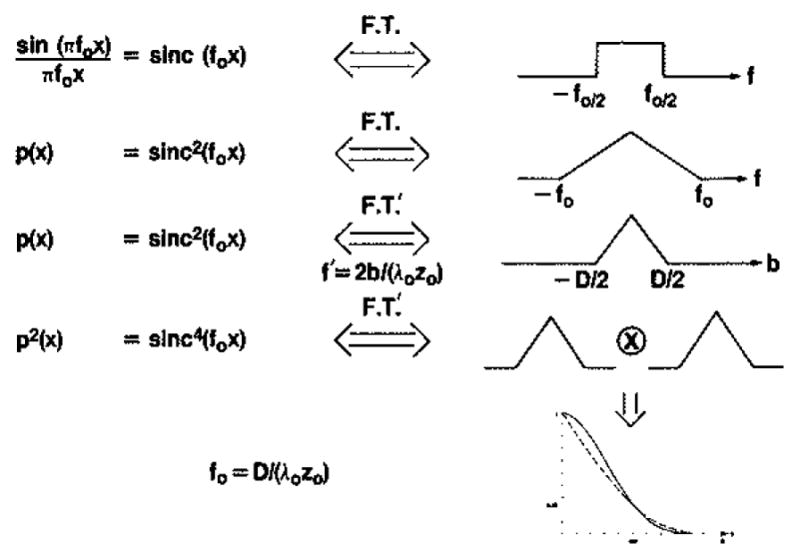
Symbolic representation of steps leading from (17) to curves in Fig. 4, illustrating how the Fourier transformation in the variable 2b/λozo is equivalent to selfconvolution of a triangle function.
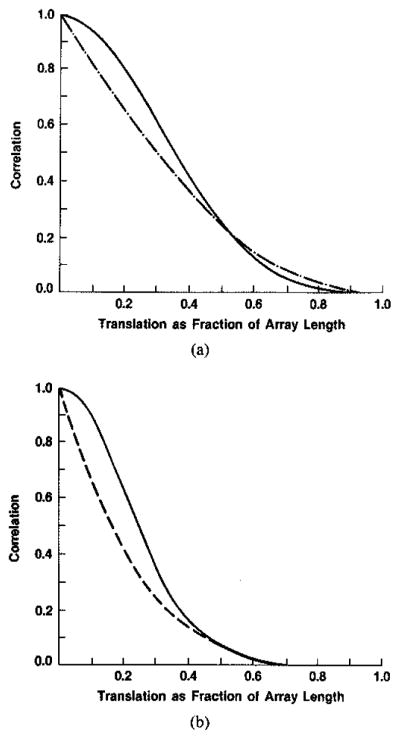
The first row of Fig. 3 gives the well-known relation between the sinc function defined there and the rectangle function; the second power of the sinc function transforms to the selfconvolution of the rectangle yielding a triangle, which simplifies as shown in the third row when the Fourier domain variable is 2b/λozo as in (17). The result we require is the transform of p2(x) in this variable and is therefore the self-convolution of the triangle indicated in the fourth row. Burckhardt [3] indicated that this convolution would be a parabola—indicated schematically in Fig. 3 as the dashed curved and shown plotted in Fig. 4(a). This is only an approximation. (This approximation was also used by Gehlbach [4].) We have carried out the convolution numerically and give the result in Fig. 4 (solid curve). Since the Fourier transforms in the expressions given in (17) derive from even functions, they are both real and are therefore equal in this case. The required correlation function is then the square of the Fourier transform just derived and is given in Fig. 4(b) (solid curve). The distance over which the correlation (or decorrelation) falls to zero is characterized in terms of the transducer aperture or array length, D. The correlation falls to about 0.5 when the transducer has been translated through a distance equal to about 0.25 D and steered to view the same scattering volume; it falls essentially to zero when this distance is increased to about 0.6D.
Fig. 4.
(a) Results of present work using numerical convolution to obtain correlation in terms of amplitudes of images, one of which is obtained by a transducer translation b, followed by rotation to view same region (——); Burckhardt’s approximation [3] to this result (---------). (b) The squares of the functions from (a) give theoretical correlation in terms of intensities or magnitudes.
Gehlbach gives an argument based on a Taylor series expansion that the shape of the correlation of magnitudes should closely follow the correlation of intensities when similarly normalized. Our previous numerical experience and arguments drawn from earlier investigations based on Taylor series supports this conclusion when there are many scatterers per cell, as does much current work here based on the analysis given originally by Middleton [14]. This was demonstrated numerically for the case of simple images in [1], and was summarized at the end of the previous section. We may therefore compare the function derived for intensities above with experimental results obtained by Trahey et al. [15] for magnitude (B-scan) images following the transducer translation and rotation paradigm described above. The shapes of the theoretical and experimental results in Fig. 5 are seen to be similar; the magnitude of the theoretical result is almost everywhere above the experimental. This latter condition is expected since in practice new particles move into the resolution cell and old particles move out as the transducer is translated and resteered, thus hastening the decorrelation; the theoretical treatments given above ignore this second-order effect. One may conclude that the argument given by Gehlbach for detected intensities and refined above yields a good upper bound for the speckle decorrelation in B-scans due to transducer translation and rotation. This bound is very close to the measured result and so the second order effects appear to be small.
Fig. 5.
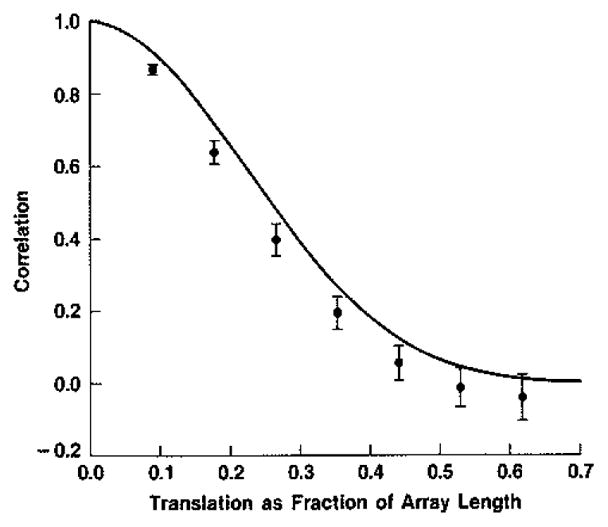
The numerical result from Fig. 4(b) (——) accounts theoretically to first order for experimental data of Trahey et al. [15] for decorrelation as a function of translation. Error bars are plus and minus two standard errors of the mean.
When two uncorrelated intensity or B-scan images are compounded, the speckle contrast is reduced by , the SNR0—its inverse—increased by [6]. It is as if the density of speckle spots or image samples has been doubled. The detectability of uniform lesions [2] or homogeneous textures [21], [22] is as equally improved by increasing the number of independent images as by reducing the inherent speckle spot size. (Analysis of the compounding of correlated images requires the more detailed analysis of an eigenvalue problem as given by Goodman [6].)
The result obtained by Burckhardt [3] was for compounding complex amplitudes. That is, it is the result corresponding to (18) above for amplitudes, and not that corresponding to (17) and (19) for the intensity or magnitude. The single power of the complex amplitude correlation is not relevant to the problem of speckle reduction. Complex amplitude summation is used to synthesize large apertures from smaller subunits and requires the recording of phase information, for example by quadrature detection of the in phase and quadrature phase components of the signal. Complex summation can lead to improved resolution and can therefore improve signal detection indirectly through its effect on the speckle spot size (Section II). However, the process of complex summation by itself does not change the underlying statistics [6] and therefore does not reduce the speckle contrast. In brief, complex amplitude summing does not reduce the coherence that results in speckle; intensity or magnitude summing does reduce the effective coherence and speckle. It is the latter approach that is used in compounding, and therefore the correlation of intensity or magnitude is the quantity of interest, not the correlation of complex amplitude. The details above demonstrate the difference in these functions. Examples of the trade-off between resolution and independent images available within a given overall aperture limitation have been given by Trahey et al. [15] who demonstrate experimentally and theoretically the quantitative advantage of B-scan compounding for lesion detection. (Additional theoretical motivation and analysis of the compounding vs resolution trade-off have been presented by Shankar and Newhouse [16].)
Finally, we note that it can seem counterintuitive that the complex amplitude should decorrelate more slowly than the magnitude if one thinks in terms of factoring the magnitude and phase correlations. This, however, is not allowed: the correlation of the phases between positions 1 and 2 is not independent of the correlations of the associated magnitudes [6]. This makes an intuitive ordering of the decorrelations difficult without carrying out the calculations given above.
IV. Correlations Between Images to Be Frequency Compounded
The correlation between the complex amplitudes of scans collected in the spatial compounding scheme of the previous section was given in (18) in terms of the Fourier transform, in the variable f = 2b/λozo, of the absolute square of the lateral PSF, p(x). The correlation between the corresponding intensities is then given immediately in terms of the absolute square of the same Fourier transform, (17) or (19). These properties of the random walk with a large number of phasors recur in the same form—but with different variables—in many other applications. In particular, they appear also in the problem of scans made at different center frequencies that are to be compounded to reduce coherence effects. We exemplify this next through the results for frequency compounding given by Melton and Magnin [17] and these points are further demonstrated in the references that they give.
Melton and Magnin considered the problem of frequency compounding using pulsed sinusoids with a Gaussian temporal envelope,
| (20) |
where the temporal bandwidth B = 1/πT. They showed that the correlations relevant to the problem of frequency compounding from central frequencies f1 and f2 are dominated by the Fourier transform of p2(t) in the variable Δf = f2 − f1. That is, the coherence between the two fields is to a very good approximation
| (21) |
They then studied the coherence between the corresponding detected envelopes or magnitudes and found the same nonlinear function of ρ that we studied in [1]. However, as pointed out there and several times in the present paper, this nonlinear function is very closely equal to the absolute square,
| (22) |
—whenever there are many scatterers per resolution cell— and this is borne out in their theoretical results. Melton and Magnin also showed very good agreement between their theoretical result and experimental measurements in [17], and independent verification of this agreement has recently been presented by Trahey et al. [18]. We reproduce here in Fig. 6 the comparison given by the latter authors.
Fig. 6.
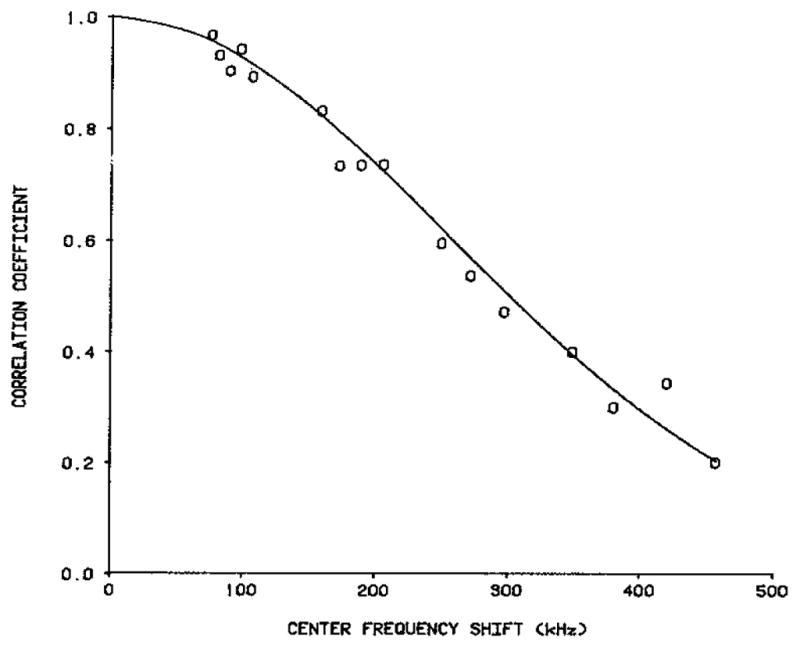
Theoretical (——) correlation [17] and experimental (0) correlation [18] between images generated at different center frequencies, as function of shift or difference between these frequencies, when pulse shape is Gaussian ([18], with permission).
A helpful mnemonic can be derived by applying their result to a pulse whose spectrum is flat, i.e., a boxcar with spectral width fD. This would derive from a temporal PSF whose square is given by
| (23) |
The Fourier transform of this function is a triangle and its square is the parabolic shape whose right half is given in Fig. 7. By comparing Figs. 5 and 7 we see that the efficacy of working with a fixed bandwidth and shifting the center frequency to generate uncorrected signals may be reasonably compared with the efficacy of working with a fixed array length D and shifting the array to generate uncorrelated signals. The spatial decorrelation in terms of the fraction of the aperture dimension D is somewhat faster, however, than the frequency decorrelation in terms of the fraction of the uniform bandwidth fD. The qualitative difference in the shapes of the spatial and frequency decorrelations is due to the qualitative difference between the lateral and range PSF’s: the pulse-echo PSF in the lateral direction is the product of two one-way PSF’s, due to the first weighting the second [1]; the pulse-echo PSF in the range direction is the usual convolution of the two one-way PSF’s.
Fig. 7.
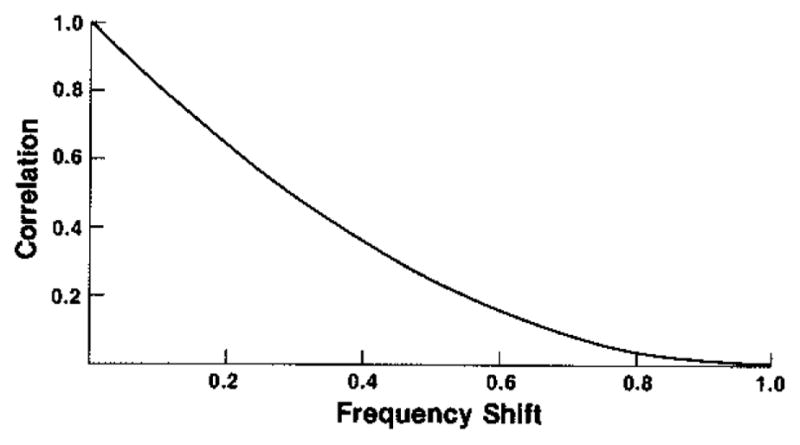
Theoretical correlation between images generated at different center frequencies, for pulse with boxcar (i.e., uniform) spectral shape, as function of shift or difference between frequencies given as fraction of uniform bandwidth.
V. Departures from Rayleigh Scattering
A. Addition of Coherent Scatter
We return now to the statistics of simple images (i.e., without reference to compounding). The case considered above in Section II was that of purely diffuse or Rayleigh scattering. If in addition to this incoherent scatter there are scatterers with long range order, e.g. large scatterers, or periodic or extended structure, this cooperative or coherent scatter will manifest itself in the image statistics [19], [20], [21], [22]. The contrast of the speckle will be reduced and the average correlation length of the speckle will increase.
We may calculate the correlation length from a generalization of the derivation of (10) above. Here we consider only the special case of the addition of a constant level of specular intensity Is to the previously considered diffuse intensity Id. We may then write for the complex amplitudes, without loss of generality,
| (24) |
where . The g’s have the same properties as given above in (6). We have then for the autocorrelation function
| (25) |
where
| (26) |
The first terms in each parenthesis generate the Rayleigh autocorrelation function as given in (10). The remaining terms are simple to average since R is constant. We obtain the final result using the properties of the g’s given above in (6), together with
| (27) |
obtaining
| (28) |
This expression may also be used to calculate the mean square intensity—by setting ρ = 1; the squared mean intensity—by setting ρ = 0; and the variance from the difference of these. Then the average speckle contrast follows directly from taking the ratio of the square root of the variance to the mean and is found to range from unity (Is = 0) to zero (Is = ∞). (The speckle contrast is the inverse of the intensity “signal-to-noise ratio” at a point, SNRo, which would range from unity to infinity.) The term in (28) that is first power in ρ is a cross term representing the coupling between the diffuse and specular scattering and is responsible for broadening the speckle cell. If a speckle cell size is defined in terms of the area under the autocorrelation function, or in terms of any other measure that scales linearly, e.g., the full width at half maximum of the autocovariance, then the increase in cell size as a function of r = Is/Id follows the curve given in Fig. 8 for the case where ρ has a Gaussian profile. The cell size increases rapidly as r increases from zero (where ρ2 dominates) to about two, then quickly reaches an asymptote of corresponding to r ⇒ infinity (where ρ dominates).
Fig. 8.
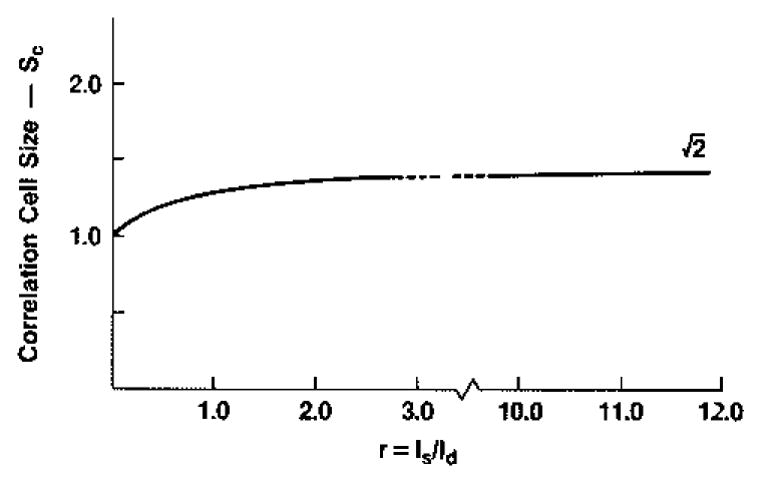
Theoretical autocovariance cell size as function of specular to diffuse scattering ratio, r, for a Gaussian complex (amplitude) coherence factor (relative to r = 0 cell size).
This longer correlation length for combinations of diffuse and specular scattering, as well as the even greater correlation lengths associated with purely specular scattering, will lead to the requirement for greater shifts in aperture or center frequency than calculated in Sections III and IV when compounding to achieve a given decor-relation, or will lead to less dramatic effects for a given shift.
From the preceding discussion it would appear that either the speckle contrast (or its inverse, SNRo-see, e.g., [23]), or the speckle cell size, would serve as a tissue signature corresponding to the value of the specular to diffuse scattering ratio r. This is only true, however, when there are very many diffuse scatterers per resolution cell. We now consider the case where this number decreases toward zero.
B. Decrease in the Number of Scatterers per Resolution Cell
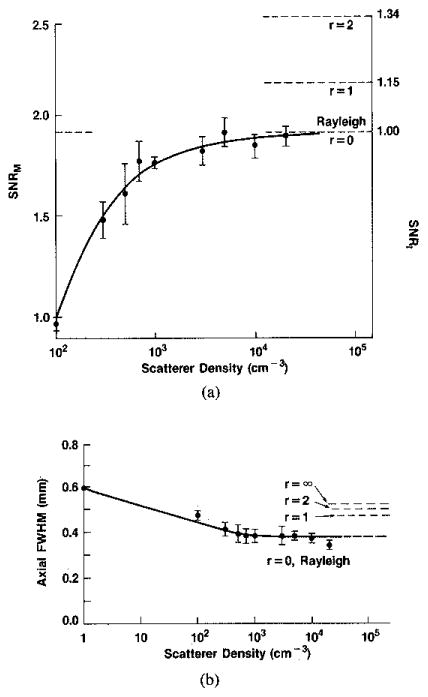
Oosterveld, Thijssen, and Verhoef [9] have generated a computer model of the ultrasound insonification, scattering, and detection process. Among other things they studied the dependence of first and second order statistics on the density of scattering particles. They found that the backscattered intensity depended linearly on the scatterer density, in agreement with the random walk theory, over several decades of scatterer density N (see also Insana et al [24], and Smith et al. [25]). The speckle contrast—the inverse of the point SNRo—decreased to an asymptote corresponding to the Rayleigh—or complex Gaussian— limit as the scatterer density increased to a level corresponding to roughly ten scatterers per interrogated resolution cell (cf. [26]). And the axial and lateral speckle cell size decreased to an asymptote corresponding to the natural dimensions found here in Section II for a similar scatterer density. (Wagner et al. [1] and Smith and Wagner [10] found that the Rayleigh or complex Gaussian limit was approached in first order statistics for slightly fewer than 10 scatterers per resolution cell and Dainty [27] indicates that this limit is approached in fourth order statistics for about 100 scatterers per resolution cell.) This suggests that for small N the speckle contrast or the speckle cell size may be taken as a tissue signature that estimates the density of scattering particles or their number per resolution cell. This is indeed true if it is known that there is only diffuse scattering without the combination of specular or coherent scattering to confound the analysis as indicated in the previous section. If the amount of coherent scatter is not known independently, several measurements may be made and the methods of Oosterveld et al. may be combined with methods deriving from the present work to solve for the physical parameters r = Is/Id and N, the number density of diffuse scatterers per resolution cell or per unit volume.
(If the scatterers in the medium are not identical, then all scatterers will not contribute equally to the echo signal and N will refer to an average appropriate to the frequency dependence of the scattering physics. For example, Bamber and Hill [28] have shown that in liver parenchyma, at low frequencies (f < 2.5 MHz), the echo signal is dominated by large scattering structures, whereas at higher ultrasonic frequencies (f > 2.5 MHz) it is dominated by smaller scatterers. The measured density of scatterers will therefore correspond to an average density for a range of scatterer dimensions determined by the center frequency and bandwidth of the pulse.)
In Fig. 9(b) we reproduce the results of Oosterveld et al. [9] for the cell size (in their terms, viz. FWHM) vs. the density of diffuse scattering particles; in Fig. 9(a) we reproduce their results for the SNR at a point vs the same average density. On the same plots we present our limiting values—for large values of N—of the same quantities as a function of the specular/diffuse ratio r as found from the present work (28). If the previous investigators [9], and others with related computer models [8], [11], [29], [30] would introduce specular scatterers into their simulations, then a family of curves as indicated by the partial dashed curves could be completed. These curves would then serve as a calibration from which the values of r and N could be obtained from measurements of the SNR at a point (or speckle contrast) and the average speckle cell size or its characteristic dimension, by simultaneous graphical solution of Figs. 9(a) and (b). One further important caveat is necessary.
Fig. 9.
(a) (Left hand ordinate) First order statistics of simulated B-mode scans in terms of ratio of mean to standard deviation (SNRM), as function of the scatterers, after Oosterveld et al. [9]. (Right hand ordinate) Limiting values of first order statistics for intensities with r = Is/Id as parameter. (b) Second order statistics of simulated B-mode scans as function of density of scatterers, after Oosterveld et al. [9], in terms by FWHM of axial or range autocovariance function. Dashed lines: limiting values of this parameter for either intensity or magnitude with r as parameter.
We have shown in other places [21], [22] that the presence of structure such as a sinusoidal or other oscillatory variation in the coherent scatter increases the total variance of the speckle fluctuations, i.e., it enhances the speckle contrast. If only first order statistics, e.g., the mean and variance, are considered, this increase of speckle contrast—decrease in the pointwise SNR—drives a first order analysis in the direction of non-Gaussian statistics, corresponding to the few scatterer case as shown on the left portion of Fig. 9(a). This takes place even though there are a great number N of diffuse scatterers per resolution cell. We show in these references how preprocessing of the data and partitioning of the second order statistics are required to unmask the underlying Gaussian statistics that are present. This partitioning yields yet another tissue signature corresponding to the scattering strength in the structure. When this component is peeled away, leaving the steady or average level of the specular component, the techniques of the previous section and the calibration described above in this section may be applied rigorously. (Without this step the results are open to ambiguous interpretations, as in [19], [23]). When this calibration is measured, it will be possible to obtain measures of the specular/diffuse scattering ratio and the density of diffuse scatterers from the analysis of the statistics of the speckle texture described here.
VI. Conclusion
We have reviewed the theory of the correlation cell size and its relation to the resolution cell size for simple-scan images and presented additional experimental verification of the relationship. We have refined the Burckhardt/Gehlbach analysis of the correlation between images that are candidates for compounding to reduce the speckle fluctuations. This treatment is in very good agreement with the experimental results of Trahey et al., and shows that the fundamental correlation distance is a fraction of the transducer or array characteristic dimension. In a similar manner we showed that for frequency compounding, the fundamental measure is a somewhat larger fraction of the pulse bandwidth.
We have reviewed our own theoretical results for the correlations in images that result from the addition of coherent scatter to the Rayleigh scatter and re-presented the computer simulation results of Oosterveld et al. demonstrating the effects of departure from Rayleigh statistics due to the decrease in the number of scatterers per resolution cell. Finally, we have suggested computer experiments for those who have developed simulation routines that will allow the final two effects listed here to be separated. This means that there exist statistical techniques for simultaneously obtaining the ratio of specular to diffuse scattering strength as well as the number density of diffuse scatterers from ultrasonic B-scans of tissue parenchyma or tissue-mimicking phantoms.
The relationships between the correlation lengths derived in this paper and the density of speckle spots—or independent samples—over a lesion or region of interest are treated in [2], [15], and [18]. It is this density of samples that determines detectability and discrimination in ultrasonic images.
Acknowledgments
The experimental results of Trahey et al, cited here and our theoretical results for the correlation of scans to be spatially compounded were obtained independently and then swapped between labs prior to publication. We are grateful to G. E. Trahey, O. T. von Ramm, and S. W. Smith for this exchange prior to publication, and to the same authors and J. W. Allison for communicating the data of Fig. 6 prior to publication.
Between the review cycles for the present paper, a study of spatial compounding and related questions in the context of synthetic aperture radar has come to our attention [31].
Biographies
 Robert F. Wagner (S’58–M’83–SM’84) was born in Philadelphia on January 10, 1938. He received the B.S. degree in electrical engineering in 1959 from Villanova University, Villanova, PA, the M.A. degree in 1965 from Augustinian College, Washington, D.C., and the M.S. degree in physics in 1965 and the Ph.D. degree in nuclear physics in 1969 from Catholic University, Washington, D.C.
From 1970 to 1972 he held a postdoctoral fellowship at Ohio University in Athens, Ohio, taught modern physics, and did research on photo- and electro-nuclear interactions. In 1972 he joined the laboratories of the Bureau of Radiological Health, where he has been chief of the Medical Imaging Section for most of the last decade. At BRH (now the FDA’s Center for Devices and Radiological Health) he has worked on problems concerning the ultimate sensitivity of X-ray, CT scanning, and ultrasound systems in medical imaging, vision and image display, consensus measurement methodology for medical imaging systems, and statistical pattern recognition in medical images.
Dr. Wagner is an associate editor of the journal Medical Physics and has published five papers on nuclear physics and about 60 on medical imaging. He is a fellow of SPSE, a senior member of the IEEE, and a member of the American Association of Physicists in Medicine and SPIE.
 Michael F. Insana (M’85) was bron in Ports-mouth, VA, on December 18, 1954. He received the B.S. degree in physics from Oakland University, Rochester, MI, in 1978 and the M.S. and Ph.D. degrees in medical physics in 1982 and 1983, respectively, from the University of Wisconsin—Madison. He was a research physicist at the FDA’s Center for Devices and Radiological Health. He is currently with the University of Kansas Medical Center, Kansas City, KS. His research interests in medical imaging include ultrasonic and magnetic resonance imaging and tissue characterization and statistical pattern recognition techniques.
Dr. Insana is a member of the IEEE and an associate member of the Acoustical Society of America.
 Stephen W. Smith was born in Covington, KY, on July 27, 1947. He received the B.S. degree in physics from Thomas More College, Ft. Mitchell, KY, in 1967, and M.S. degree in physics in 1969 from Iowa State University, and Ph.D. degree in biomedical engineering from in 1975 Duke University, Durham, NC.
In 1969 he joined the Food and Drug Administration, Bureau of Radiological Health, where he has worked in the study of medical imaging techniques, particularly diagnostic ultrasound, and in the development of performance standards for such equipment. He is also Adjunct Associate Professor of Radiology at Duke University.
Dr. Smith is a member of the American Institute of Ultrasound in Medicine and the Executive Board of the American Registry of Diagnostic Medical Sonographers.
Footnotes
In reference [1], following (32) we calculate the size of the correlation cell for ultrasound B-scans. The calculation is correct for both intensity and magnitude along the lateral or diffraction direction. It is also correct for these quantities along the range direction when calculated in terms of time. At that point the authors struggled privately over whether the more fundamental conversion to distance was through the speed of sound or through the pulse-echo speed. We believed that, for purposes of calculating signal detectability, the former was the more fundamental quantity, and the subsequent results of the paper follow in those terms. When the paper appeared, Christoph Burckhardt wrote to the authors indicating the incorrectness of this conversion. Michael Insana argued in favor of Burckhardt’s position and convinced the authors. We are most grateful for these communications.
This means that (33) and (35) in [1] are incorrectly high by a factor two. These results appear again in Table I B in [2] and should also be corrected there. Finally, this propagates to Table II in [2] where the entries in the final column are also high by a factor two, and the threshold signal-to-noise ratio, SNRr, six lines further on are then low by . This means they will increase from the neighborhood of about 2.0 to about 2.8, which are closer to values found in the other references cited.
This factor does not propagate to reference [10] where comparisons in the range direction were carried out in the temporal domain.
Finally, the autocorrelation function shown in [1] for the complex amplitude in the range direction (Fig. 5) is based on the RF center frequency being shifted to zero. Thus it shows no oscillations. If the shift is not carried out in practice, this autocorrelation function will show oscillations at the center frequency. Although this point has no effect on the results of [1], it will show up in practical RF autocorrelation functions. We thank G. E. Trahey for pointing this out.
IEEE Log Number 8717129.
Contributor Information
ROBERT F. WAGNER, Center for Devices and Radiological Health, HFZ-142, Food and Drug Administration, Rockville, MD 20857.
MICHAEL F. INSANA, Center for Devices and Radiological Health. He is now with the University of Kansas Medical Center 39th & Rainbow Blvd., Kansas City, KS 66103.
STEPHEN W. SMITH, Center for Devices and Radiological Health, HFZ-142, Food and Drug Administration, Rockville, MD 20857
Referencesa
- 1.Wagner RF, Smith SW, Sandrik JM, Lopez H. Statistics of speckle in ultrasound B-scans. IEEE Trans Sonics Ultrason. 1983 May;SU-30(3):156–163. [Google Scholar]
- 2.Smith SW, Wagner RF, Sandrik JM, Lopez H. Low contrast detectability and contrast/detail analysis in medical ultrasound. IEEE Trans Sonics Ultrason. 1983 May;SU-30(3):164–173. [Google Scholar]
- 3.Burckhardt CB. Speckle in ultrasound B-mode scans. IEEE Trans Sonics Ultrason. 1978 Jan;SU-25(1):1–6. [Google Scholar]
- 4.Gehlbach SM. PhD dissertation. Stanford University; Stanford, CA: Mar, 1983. Pulse reflection imaging and acoustic speckle. [Google Scholar]
- 5.Papoulis A. Probability, Random Variables, and Stochastic Processes. ch. 10 New York: McGraw-Hill; 1965. [Google Scholar]
- 6.Goodman JW. Statistical properties of laser speckle patterns. In: Dainty JC, editor. Laser Speckle and Related Phenomena. Berlin: Springer-Verlag; 1975. pp. 9–75. [Google Scholar]
- 7.Bendat JS, Piersol AG. Random Data: Analysis and Measurement Procedures. ch. 3 New York: Wiley; 1971. [Google Scholar]
- 8.Foster DR, Arditi M, Focter FS, Patterson MS, Hunt JW. Computer simulations of speckle in B-scan images. Ultrason Imaging. 1983 Oct;5(4):308–330. doi: 10.1177/016173468300500403. [DOI] [PubMed] [Google Scholar]
- 9.Oosterveld BJ, Thijssen JM, Verhoef WA. Texture of B-mode echograms: 3-D Simulations and experiments of the effects of diffraction and scatterer density. Ultrason Imaging. 1985 Apr;7(2):142–160. doi: 10.1177/016173468500700204. [DOI] [PubMed] [Google Scholar]
- 10.Smith SW, Wagner RF. Ultrasound speckle size and lesion signal to noise ratio: verification of theory. Ultrason Imaging. 1984 Apr;6(2):174–180. doi: 10.1177/016173468400600206. [DOI] [PubMed] [Google Scholar]
- 11.Zagzebski JA, Madsen EL, Goodsitt MM. Quantitative tests of a three-dimensional model for grey-scale texture. Ultrason Imaging. 1985 Jul;7(3):252–263. doi: 10.1177/016173468500700305. [DOI] [PubMed] [Google Scholar]
- 12.Flax SW, Glover GH, Pelc NJ. Textural variations in B-mode ultrasonography: A stochastic model. Ultrason Imaging. 1981 Jul;3(3):235–257. [Google Scholar]
- 13.Madsen EL, Zagzebski JA, Banjavic RA, Jutila RE. Tissue mimicking materials for ultrasound phantoms. Med Phys. 1978 Sep-Oct;(5):391–394. doi: 10.1118/1.594483. [DOI] [PubMed] [Google Scholar]
- 14.Middleton D. An Introduction to Statistical Communication Theory. ch. 9 New York: McGraw-Hill; 1960. [Google Scholar]
- 15.Trahey GE, Smith SW, von Ramm OT. Speckle pattern correlation with lateral aperture translation: Experimental results and implications for spatial compounding. IEEE Trans Ultrason Ferroelect Freq Contr. 1986 May;UFFC-33(3):257–264. doi: 10.1109/t-uffc.1986.26827. [DOI] [PubMed] [Google Scholar]
- 16.Shankar P, Newhouse VL. Speckle reduction with improved resolution in ultrasound images. IEEE Trans Sonics Ultrason. 1985 Jul;SU-32(4):537–543. [Google Scholar]
- 17.Melton HE, Magnin PA. A-Mode speckle reduction with compound frequencies and compound bandwidths. Ultrason Imaging. 1984 Apr;6(2):159–173. doi: 10.1177/016173468400600205. [DOI] [PubMed] [Google Scholar]
- 18.Trahey GE, Allison JW, Smith SW, von Ramm OT. A quantitative approach to speckle reduction via frequency compounding. Ultrason Imaging. 1986;8:151–164. doi: 10.1177/016173468600800301. [DOI] [PubMed] [Google Scholar]
- 19.Sommer FG, Joynt LF, Carroll BA, Macovski A. Ultrasonic characterization of abdominal tissues via digital analysis of backscattered waveforms. Radiology. 1981 Dec;141:811–817. doi: 10.1148/radiology.141.3.7302239. [DOI] [PubMed] [Google Scholar]
- 20.Fellingham LL, Sommer FG. Ultrasonic characterization of tissue structure in the in vivo human liver and spleen. IEEE Trans Sonics Ultrason. 1984;SU-31(4):418–428. [Google Scholar]
- 21.Wagner RF, Insana MF, Brown DG. Unified approach to the detection and classification of speckle texture in diagnostic ultrasound. Proc Soc Photo-Optical Instrum Engrs (SPIE, Bellingham, WA) 1985;556:146–152. doi: 10.1117/12.7973899. [DOI] [PMC free article] [PubMed] [Google Scholar]; Opt Eng. 1986;25(6):738–742. doi: 10.1117/12.7973899. [DOI] [PMC free article] [PubMed] [Google Scholar]
- 22.Insana MF, Wagner RF, Garra BS, Brown DG, Shawker TH. Proc Soc Photo-Optical Instrum Engrs. Vol. 556. SPIE; Bellingham, WA: 1985. Analysis of ultrasound image texture via generalized Rician statistics; pp. 153–159. [Google Scholar]; Opt Eng. 1986;25(6):743–748. [Google Scholar]
- 23.Schnittger I, Vieli A, Heiserman JE, Director BA, Billingham ME, Ellis SG, Kernoff RS, Takamoto T, Popp RL. Ultrasonic tissue characterization: detection of acute myocardial ischemia in dogs. Circulation. 1985 Jul;72(1):193–199. doi: 10.1161/01.cir.72.1.193. [DOI] [PubMed] [Google Scholar]
- 24.Insana MF, Zagzekbsi JA, Madsen EL. Acoustic back-scattering from ultrasonically tissuelike media. Medical Physics. 1982 Nov-Dec;9(6):848–855. doi: 10.1118/1.595194. [DOI] [PubMed] [Google Scholar]
- 25.Smith SW, Lopez H, Bodine WJ., Jr Frequency independent ultrasound contrast-detail analysis. Ultrasound in Medicine & Biology. 1985;11(3):467–477. doi: 10.1016/0301-5629(85)90158-9. [DOI] [PubMed] [Google Scholar]
- 26.Jakeman E. Proc SPIE. Vol. 243. SPIE; Bellingham, WA: 1980. Speckle statistics with a small number of scatters; pp. 9–19. [Google Scholar]; Optical Engineering. 1984;23(4):453–461. (an up-date of the SPIE paper). A number of models are presented; e.g., if the number of scatterers is Poisson distributed the speckle contrast becomes (1 + N−1)1/2 where N is the mean number. Cf. Fig. 9(a) of the present paper. [Google Scholar]
- 27.Dainty JC. Proc SPIE. Vol. 243. SPIE; Bellingham, WA: 1980. An introduction to ‘Gaussian’ speckle; pp. 2–8. [Google Scholar]
- 28.Bamber JC, Hill CR. Acoustic properties of normal and cancerous human liver. I. Dependence on pathological condition. Ultrasound in Med & Biol. 1981;7(2):121–133. doi: 10.1016/0301-5629(81)90001-6. [DOI] [PubMed] [Google Scholar]
- 29.Bamber JC, Dickinson RJ. Ultrasonic 6-scanning: a computer simulation. Phys Med Biol. 1980 May;25(3):463–479. doi: 10.1088/0031-9155/25/3/006. [DOI] [PubMed] [Google Scholar]
- 30.Goodsitt MM, Madsen EL, Zagzebski JA. A three-dimensional model for generating the texture in B-scan ultrasound images. Ultrason Imaging. 1983;5:253–279. doi: 10.1177/016173468300500305. [DOI] [PubMed] [Google Scholar]
- 31.Silverstein SD. Coherence and speckle reduction in compounded correlated phased arrays: SAR. J Opt Soc Am A. in press. [Google Scholar]


