Abstract
Purpose
To evaluate relationships between age-related macular degeneration (AMD) morphology on spectral domain optical coherence tomography (SDOCT) and visual function.
Design
Cross-sectional, observational.
Methods
From the Alabama Study on Early AMD baseline visit, visual acuity, cone-mediated sensitivity (Humphrey Field Analyzer, Carl Zeiss Meditec, Dublin, CA), rod-mediated dark adaptation (AdaptDx, MacuLogix, Hummelstown, PA), and SDOCT (Spectralis, Heidelberg Engineering, Germany) were obtained in one eye per subject with No Apparent Retinal Aging (N=15), Normal Aging (N=15), Early AMD (N=15), and Intermediate (N=46) AMD. The volumes of retinal pigment epithelium (RPE)-drusen-complex, RPE-drusen-complex abnormal thinning, RPE-drusen-complex abnormal thickening and inner and outer retina were calculated in specified regions using semi-automated SDOCT segmentation.
Results
Better cone-mediated sensitivity was associated with greater RPE-drusen-complex volume (r=0.34, p<0.001) and less RPE-drusen-complex abnormal thinning volume (r=-0.31, p=0.003). Longer rod-mediated dark adaptation time, the duration for rod-mediated sensitivity to recover from photo-bleach exposure, correlated with lower RPE-drusen-complex volume (r=-0.34, p=0.005) and greater RPE-drusen-complex abnormal thinning volume (r=0.280, p=0.023). In 19 eyes with subretinal drusenoid deposits (SDD) versus 47 eyes without SDD, rod-mediated dark adaptation time was longer (mean ±SD 13.5 ±7.0 versus 10.2 ±3.1 minutes, p=0.004), RPE-drusen-complex abnormal thinning volume was greater (p<0.0001), and visual acuity and cone sensitivity did not differ.
Conclusion
Decreased function relates to structural markers on SDOCT in AMD. Because the RPE-drusen-complex includes the interdigitation of outer segments and RPE apical processes and SDD in eyes with AMD, slower dark adaptation might be related to structural abnormalities of the RPE, the RPE-photoreceptor interface, or both.
INTRODUCTION
Despite advances in medical and surgical care, age-related macular degeneration (AMD) remains an important cause of central vision loss in the United States.1 In AMD, the neurosensory retina in the macula is thought to degenerate in part due to the accumulation of extracellular deposits in the spaces found on either aspect of the retinal pigment epithelium (RPE). When deposits in the sub-RPE space coalesce into visible lesions, they are termed drusen. In the sub-retinal/pre-RPE space, lesions are termed subretinal drusenoid deposits (SDD), also known as reticular drusen or reticular pseudodrusen.2 The degeneration of photoreceptors is believed to be rooted in the failure of their support system (RPE, Bruch’s membrane, and the choroid). Photoreceptor degeneration in early AMD is associated with decreased light sensitivity in the macula and slowed dark adaptation despite normal visual acuity.3–5
This study is an initial step in phenotyping early and intermediate AMD using spectral domain optical coherence tomography (SDOCT). We hypothesized that early AMD classification by measurement of SDOCT structures and/or retinal function may better indicate disease stage than AMD solely classified by color fundus photography. We examine the relationship between morphology and function in early AMD by correlating severity of disease as assessed by SDOCT scans with macular function measured by visual acuity, cone-mediated light sensitivity, and rod-mediated dark adaptation. Our goal is to identify methods that reveal the relationship between AMD pathology and psychophysically measured cone- and rod-mediated function. The structural and functional markers studied herein have the potential to lead to improved endpoints integral to the design of large multicenter AMD clinical studies.
METHODS
The data source for our analysis was the Alabama Study on Early Age-Related Macular Degeneration (ALSTAR)6, a prospective study on the association between visual function at baseline in older adults in normal macular health and incident early AMD. The eligibility criteria for enrollment have been described.6 All participants provided informed written research consent. The analysis of the ALSTAR study data was approved by both the University of Alabama Birmingham Institutional Review Board (IRB) under protocol X120724002, Phenotyping AMD: Relating retinal structure and function in early AMD, and the Duke University Health System IRB under protocol Pro00016373, Duke Advanced Research in SDOCT Imaging (DARSI) Laboratory. Data collected from SDOCT scans for all enrolled eyes were stored and managed in compliance with guidelines from the Health Insurance Portability and Accountability Act.
ALSTAR also assembled a sample of older adults who already had early or intermediate AMD in one or both eyes at baseline. A subsample of the ALSTAR baseline group was used for this proof of concept study relating morphology to function. For the current study, a subsample of eyes was assembled into four groups. Groups were defined by grading 3-field 30° digital, color stereo-fundus photos (Carl Zeiss Meditec 450 Plus camera, Dublin CA) using the Beckman AMD Classification scale.7 The groups were as follows: No Apparent Aging changes (no drusen and no AMD pigmentary abnormalities); Normal Aging changes (only small drusen < 65 μm and no AMD pigmentary abnormalities); Early AMD (medium drusen > 65 and ≤ 125 μm and no AMD pigmentary abnormalities); and Intermediate AMD (large drusen > 125 μm and/or any AMD pigmentary abnormalities, without any area of geographic atrophy). The SDOCT grader was masked to all structural and functional characteristics of eyes. Across all groups, eyes were also categorized as yes or no for the presence of SDD based on SDOCT review by a masked grader at Duke for sub-retinal versus sub-RPE drusen.
Eyes were randomly selected (one eye per participant) from the total sample of eyes from ALSTAR patients at baseline who completed satisfactory SDOCT imaging (N = 1,243 eyes). There were originally 15 eyes in each of the categories of No Apparent Aging, Normal Aging, and Early AMD and Intermediate AMD. The sample size for Intermediate AMD was intentionally increased after qualitative review of the SDOCT revealed sparse and small drusen in the first 15 eyes with Intermediate AMD. Thus an additional 31 eyes (36 eyes, with 5 excluded due to insufficient image quality) were added prior to analysis, since there was considerably more variability in funduscopic appearance and SDOCT characteristics among eyes with Intermediate AMD than in the other groups.
Functional Testing
Best-corrected visual acuity for each eye was assessed via the Electronic Visual Acuity tester (EVA; JAEB Center, Tampa FL)8 under photopic conditions (100 cd/m2) and expressed as the logarithm of the minimum angle resolvable (logMAR).
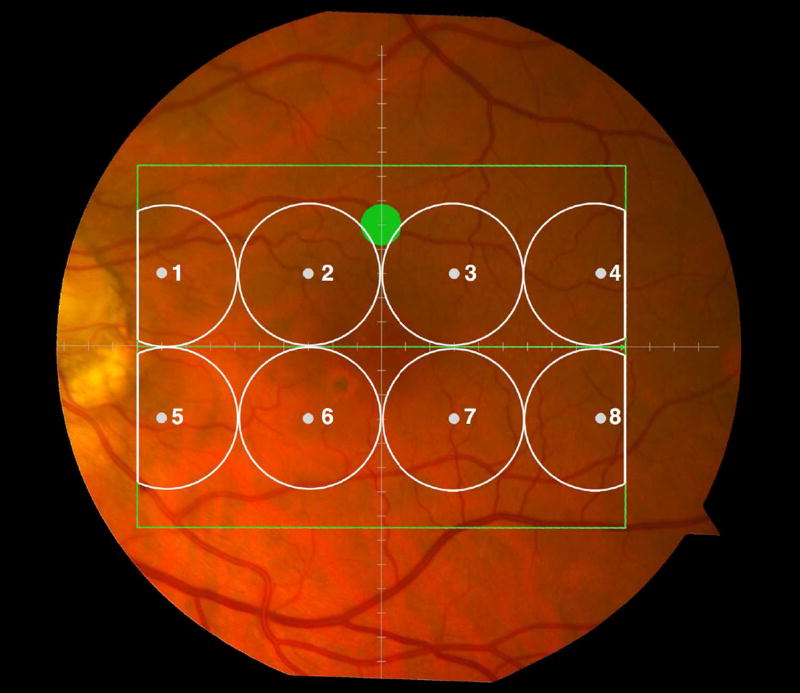
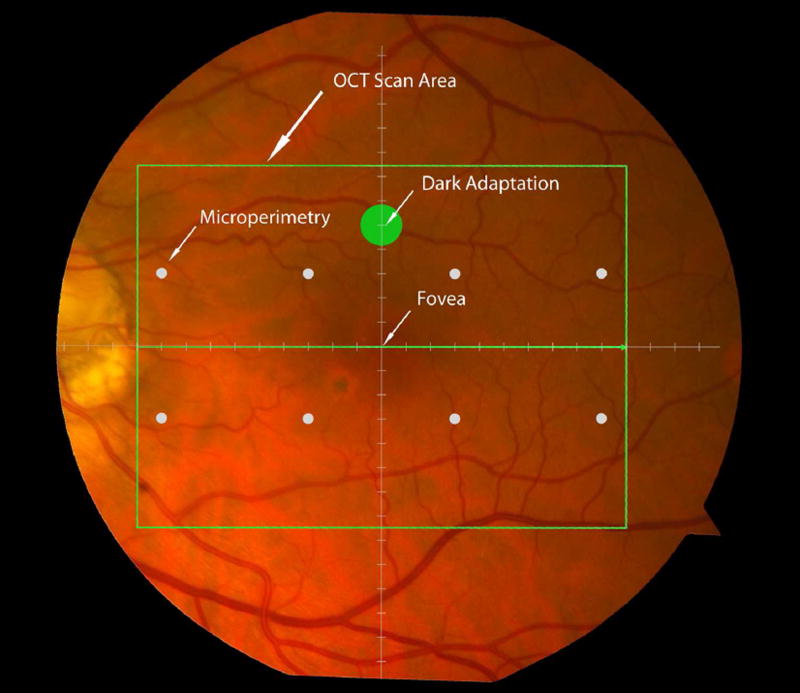
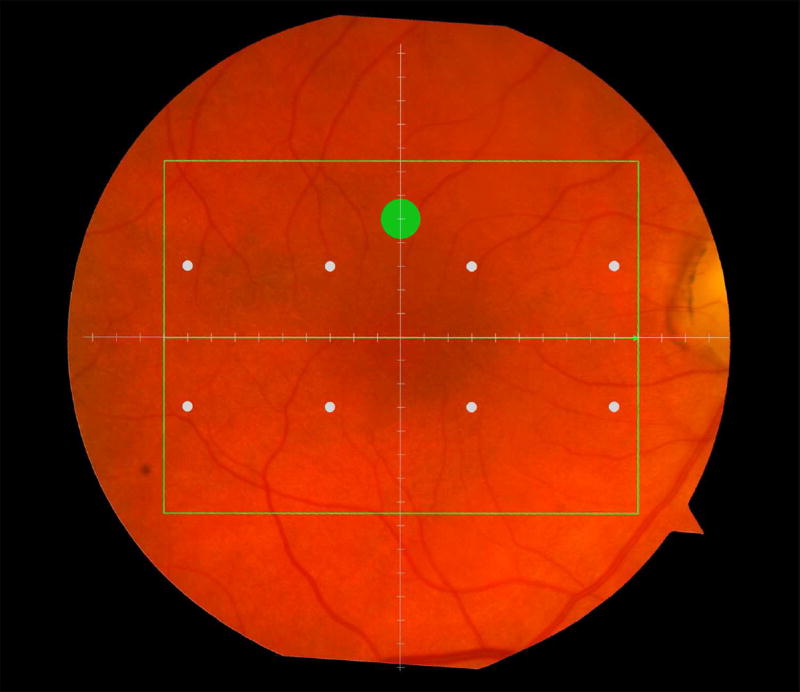
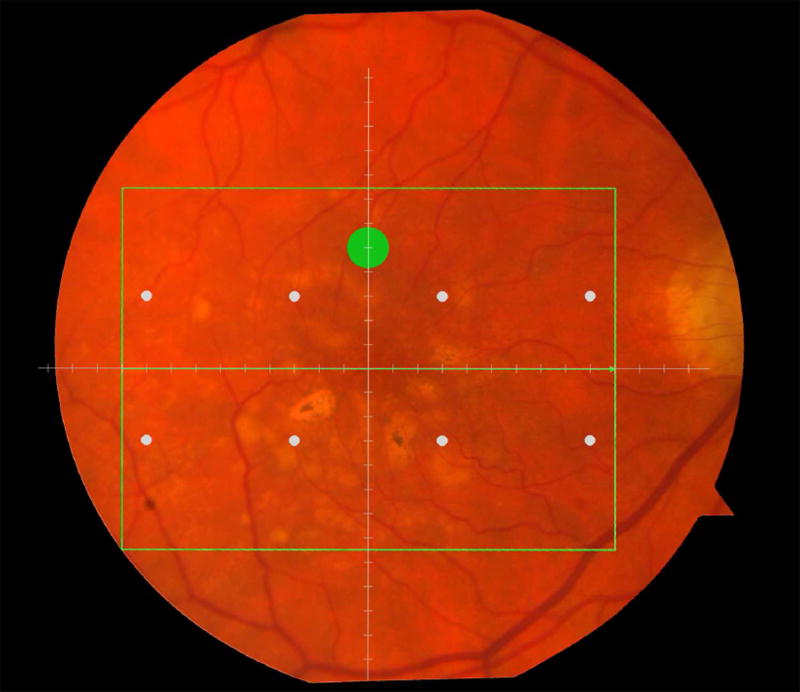
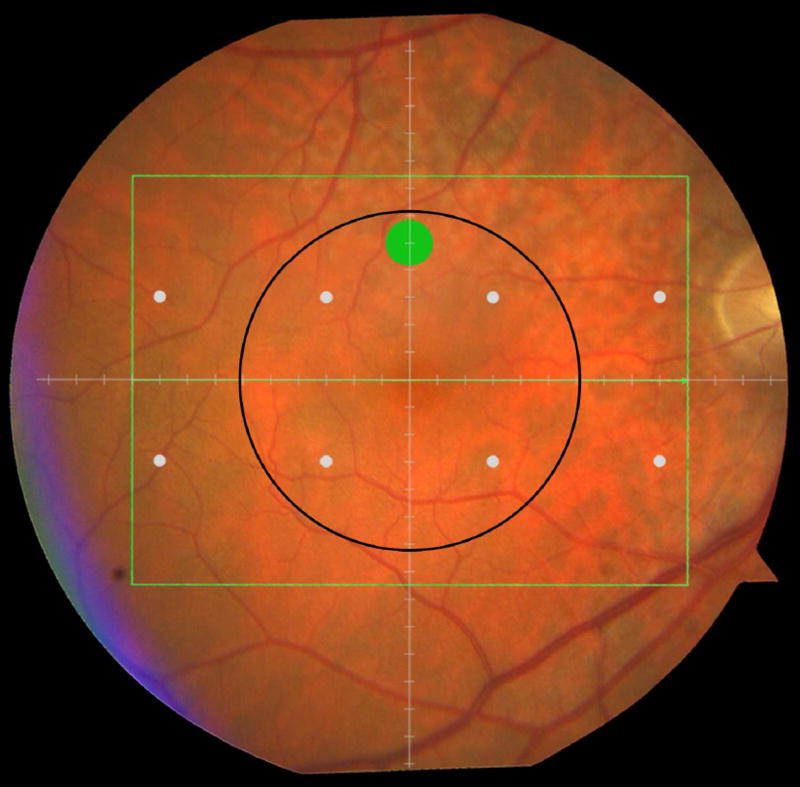
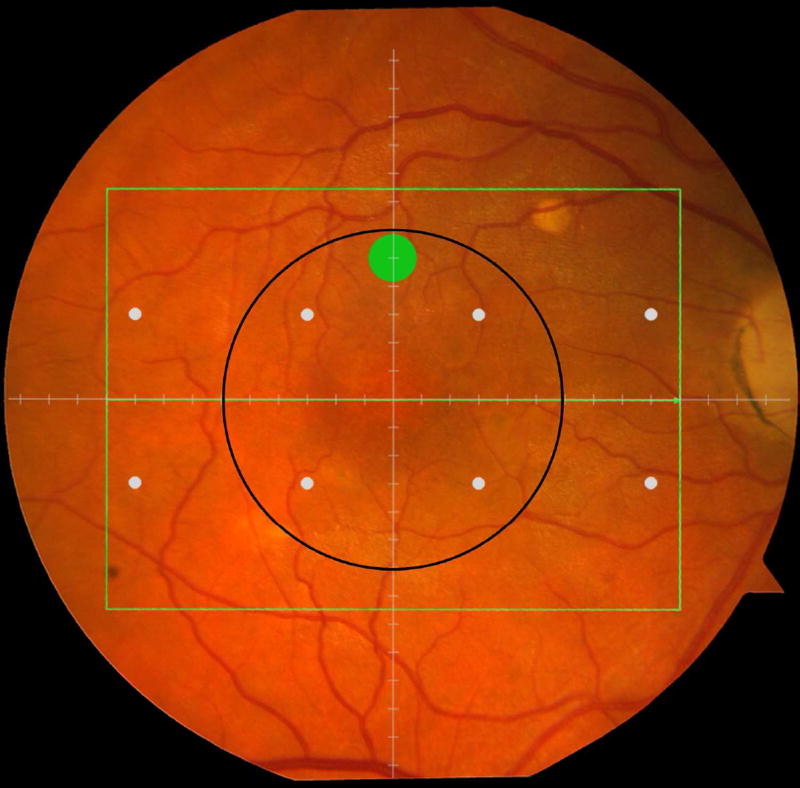
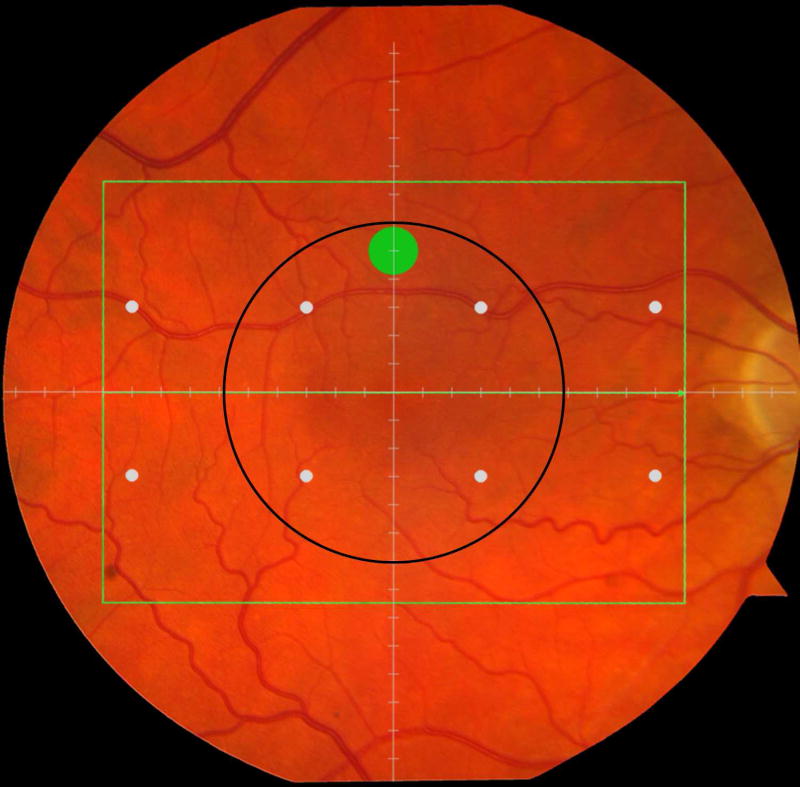
Cone-mediated light sensitivity was measured at eight retinal loci by the Humphrey Field Analyzer (Carl Zeiss Meditec, Inc., Dublin, CA) in the 24° radius field using the 24-2 SITA protocol and a white stimulus on white background. The diameter of the target stimulus was 0.43° of visual angle. Light sensitivity thresholds were expressed in decibel units (dB) of attenuation. In Figure 1 (bottom left), the white dots represent the eight test target locations where cone-mediated light sensitivity was measured within the region of SDOCT imaging as denoted by the green rectangle.
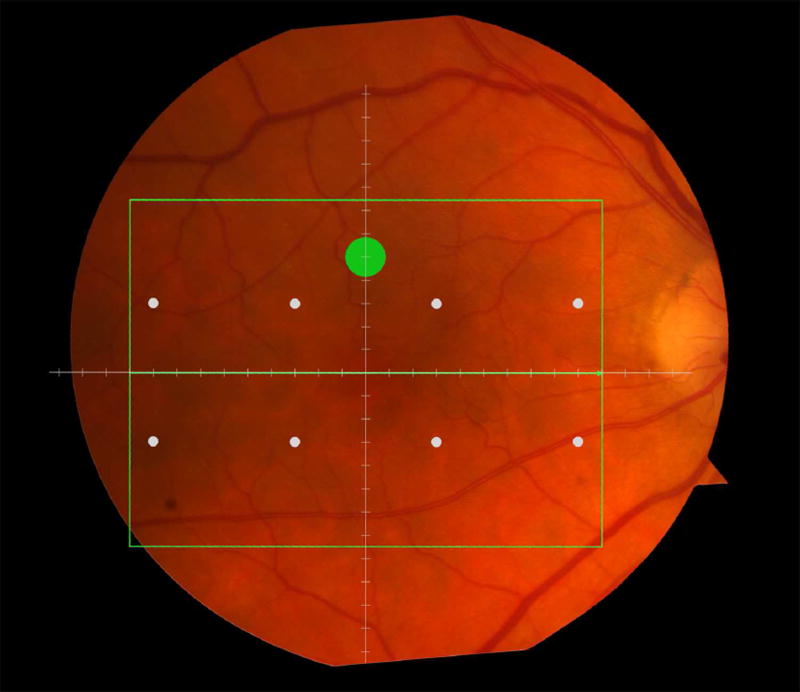
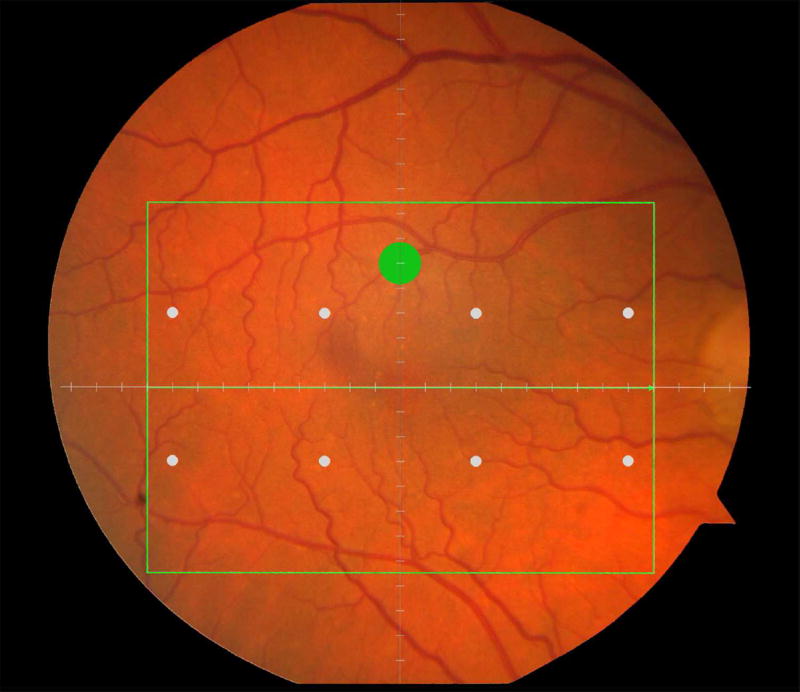
Figure 1.
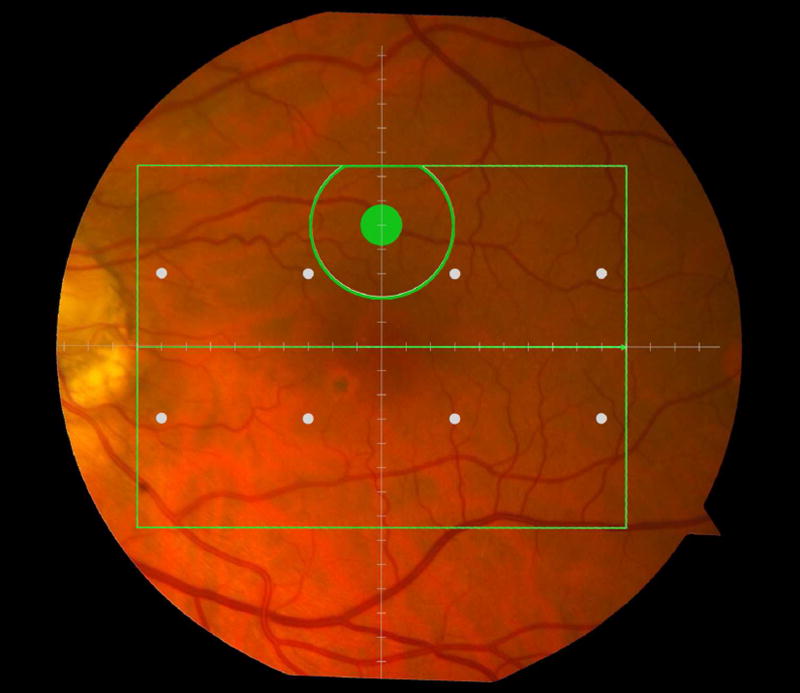
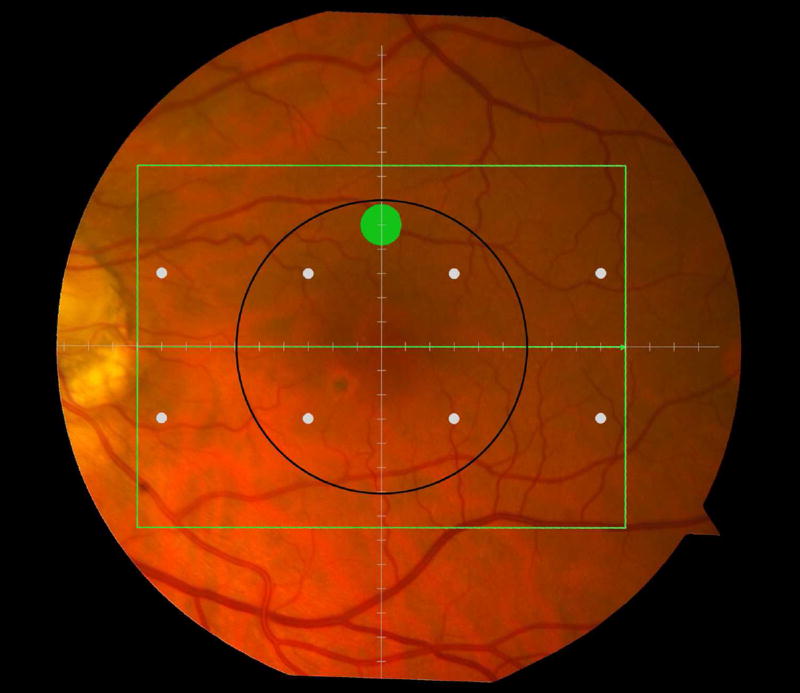
Macular locations used for structure-function analysis. The green rectangle delineates the area of spectral domain optical coherence tomography Spectralis imaging on a color photograph of the fundus (Top left). The large green spot represents the location and size of the test target where rod-mediated dark adaptation was evaluated. The small white spots represent the locations and sizes of 8 test targets where cone-mediated light sensitivity was measured. Total retinal pigment epithelium (RPE)-drusen-complex volume, abnormal volumes, and retinal volumes (outer, inner, and total) were calculated centered at the fovea within a 12° diameter signified by the black circle (Top right), within a 6° diameter at each of eight perimetry points outlined in white circles (Bottom left), and within a 6° diameter at the dark adaptation point outlined by the green circle (Bottom right). A consistent truncation of the volumes was applied at the margin of the area of OCT imaging for all eyes.
Rod-mediated dark adaptation was measured psychophysically using AdaptDx (MacuLogix, Hummelstown, PA), a computer-automated dark adaptometer described previously.9–11 Before testing, the eye was dilated with 1% tropicamide and 2.5% phenylephrine hydrochloride so that a pupil diameter of ≥ 6 mm was achieved. Trial lenses were added for the 30 cm viewing distance, if needed, to correct for optical blur. The fellow eye was occluded with an opaque patch. The participant then placed his/her head in the forehead-chinrest of the adaptometer. An infrared camera behind the fixation light displayed the eye on a monitor viewed by the examiner, who positioned the participant’s test eye to the red fixation light using a reticule. The procedure began with a photo-bleach exposure to a flash (0.25 ms duration, 58,000 scotopic cd/m2 s intensity; equivalent ~ 83% bleach) while the participant was focused on the fixation light. This bleach has been shown to be sufficiently intense to generate impaired dark adaptation parameters in early AMD patients using a 20-minute duration test protocol.10 The flash subtended 4° and was centered at 5° on the inferior vertical meridian (i.e., superior to the fovea on the retina). This position was also used for the test target for measuring light sensitivity. During threshold measurement, the participant was instructed to maintain fixation on the red fixation light and to press a response button when a flashing target first became visible within the bleached area. Threshold was estimated using a three-down/one-up modified staircase procedure described previously,10 and continued at 30 seconds intervals for 20 minutes. Log thresholds were expressed as sensitivity in dB as a function of time from bleach offset. The speed of dark adaptation was characterized by the “rod intercept time", defined as the duration required for sensitivity to recover to a criterion sensitivity value of 5.0 × 10⁻³ scotopic cd/m2 (3.0 log units of attenuation of the stimulus).10 The criterion sensitivity level is located in the latter half of the second component of rod recovery.12 An increase in the rod intercept time is caused by a slowing of the second component of rod-mediated dark adaptation and thus a rightward shift of the dark adaptation function. In Figure 1, the large green dot represents the location and size of the test target where rod-mediated dark adaptation was measured. Note that this is located within the region of SDOCT imaging denoted by the green rectangle.
Optical Coherence Tomography
Retinal vascular landmarks on the fundus photographs were used to register the fundus image onto the Scanning Laser Ophthalmoscope retinal image of the 20°X15° SDOCT volume (Spectralis, Heidelberg Engineering, Germany) which had 60 μm between B-scans. A retinal map was developed, specifying the locations and sizes of test targets for both dark adaptometry and cone-mediated light sensitivity measurements (Figure 1).
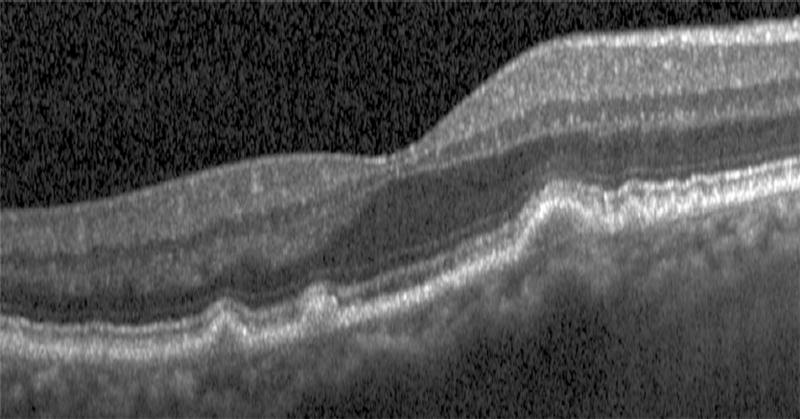
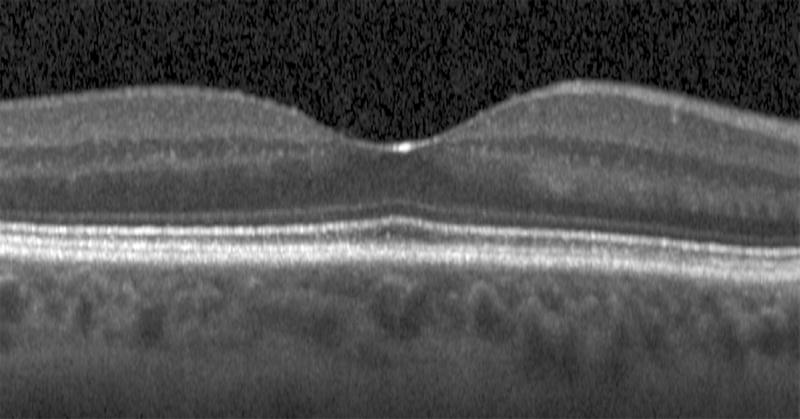
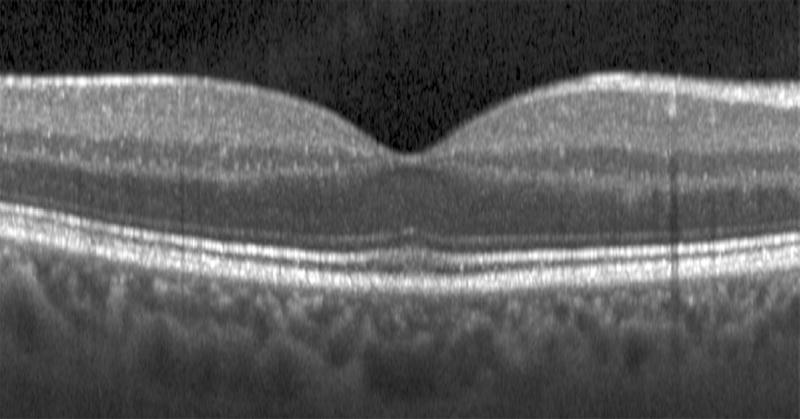
The SDOCT structures were qualitatively and quantitatively analyzed for regions of 12° (3.46 mm) diameter centered on the fovea (Figure 1 top right), 6° (1.73 mm) diameter centered on each of the eight cone sensitivity test sites (Figure 1 bottom left), and 6° (1.73 mm) diameter centered on the dark adaptation site (Figure 1 bottom right). SDOCT analyses were masked to all color fundus photograph, functional and clinical data. Qualitative analysis included assessment of the vitreoretinal interface, hyperreflective foci within the retina, external limiting membrane, photoreceptor inner segment ellipsoid band,13 and interdigitation zone (where RPE apical processes and photoreceptor outer segments interface). In our dataset, we found no SDOCT findings (e.g. fluid or gross atrophy) that would typically be associated with advanced AMD.
For quantitative SDOCT analysis, semi-automated segmentation of the inner retina, outer retina, and RPE was performed using proprietary software (Duke SDOCT Retinal Analysis Program, DOCTRAP V14.1.2, Duke University, Durham, NC).14, 15
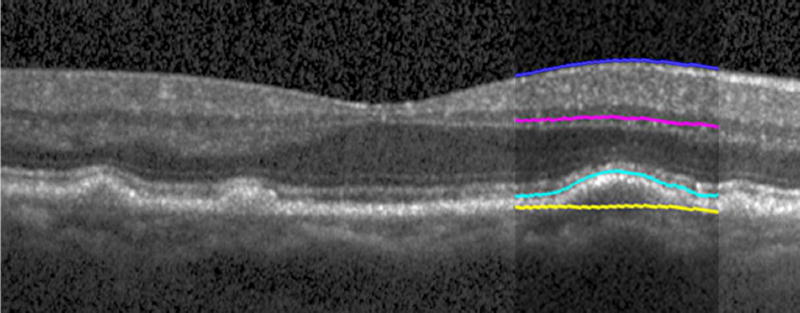
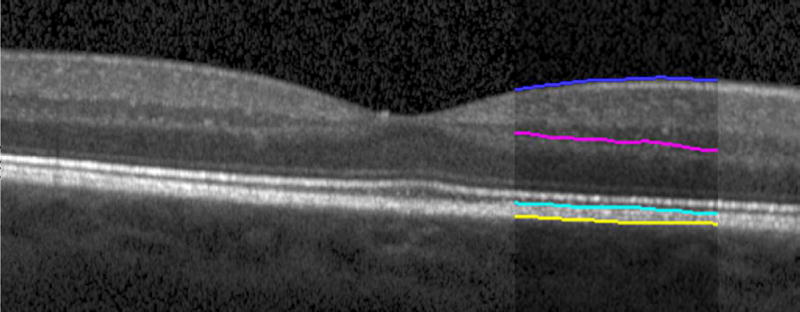
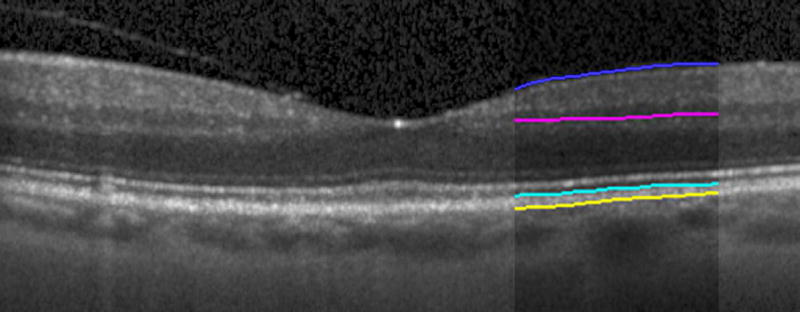
Automated segmentation was reviewed for errors by trained graders. The foveal center was chosen manually based on the deepest site in the foveal pit. Retinal thickness was measured from the inner aspect of the internal limiting membrane to the inner aspect of the RPE plus drusen complex (Figure 2, between lines 1 and 3). Inner retinal layers were measured from the inner border of the internal limiting membrane to the inner border of the outer plexiform layer (Figure 2, between lines 1 and 2). Thickness of the photoreceptor layer was measured from the outer plexiform layer to the inner border of RPE or any overlying SDD material (Figure 2, between lines 2 and 3). RPE-drusen-complex thickness extended from the inner aspect of the RPE plus drusen material to the outer aspect of Bruch’s membrane (Figure 2, between lines 3 and 4). Thus, according to previously published definitions, the RPE-drusen-complex volume contained all extracellular deposits internal to the RPE (SDD)2 and external to the RPE (basal laminar deposits, basal linear deposits/drusen), as well as RPE apical processes and cell bodies, whether normal, hypertrophic, or atrophied.14, 16
Figure 2.
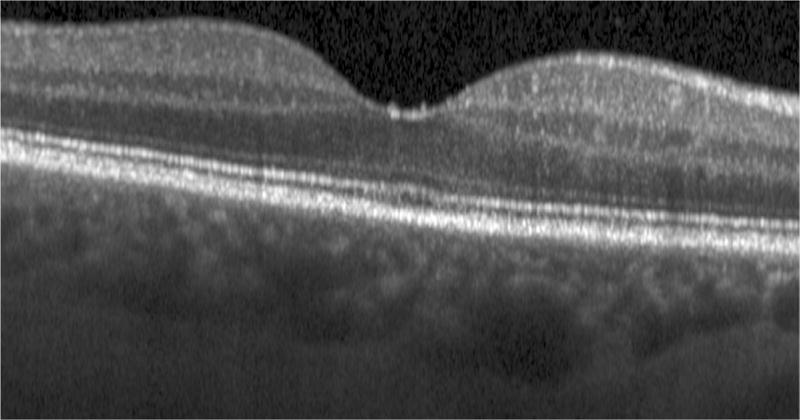
Semi-automated segmentation of the inner retina, outer retina, and retinal pigment epithelium (RPE)-drusen-complex by Duke SDOCT Retinal Analysis Program V14.1.2. The inner retina is delineated from the internal limiting membrane to the inner aspect of the outer plexiform layer (between lines 1 and 2), while the outer retina is delineated from the inner aspect of the outer plexiform layer to the inner border of the RPE-drusen-complex (between lines 2 and 3). The RPE-drusen-complex extends from the inner aspect of the Retinal Pigment Epithelium plus drusen material to the outer aspect of Bruch’s Membrane (between lines 3 and 4), as seen in the color legend (Bottom right). Representative examples are shown for: No Apparent Aging (Top left), Early AMD (Top right), Intermediate AMD (Bottom left). Note the interdigitation zone is less apparent in the Early (Top right) and Intermediate AMD groups (Bottom left) than in the No Apparent Aging group (Top left).
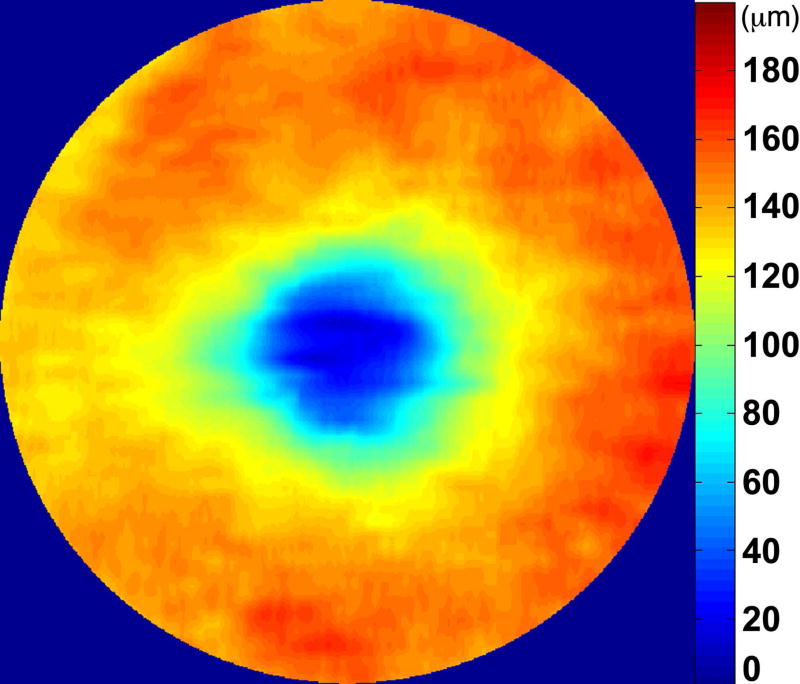
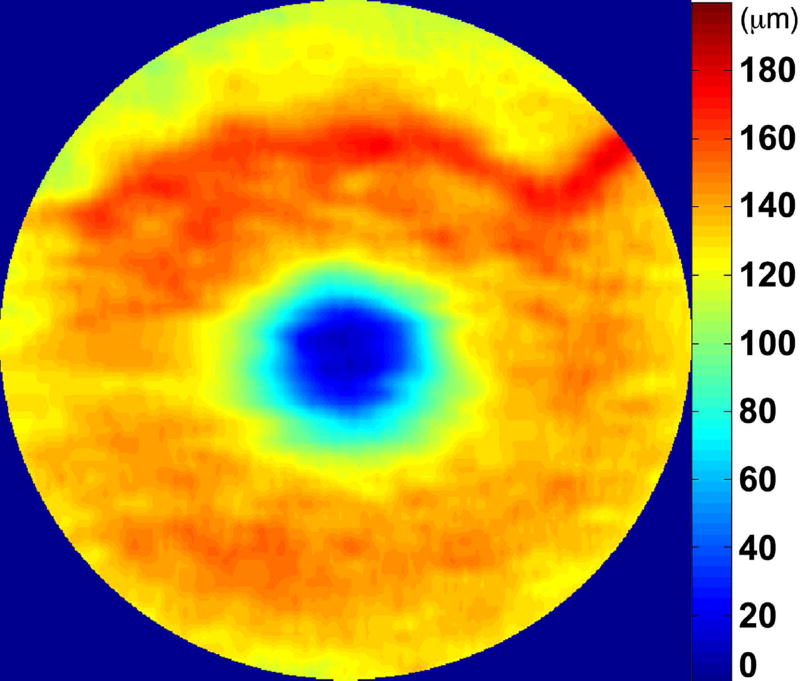
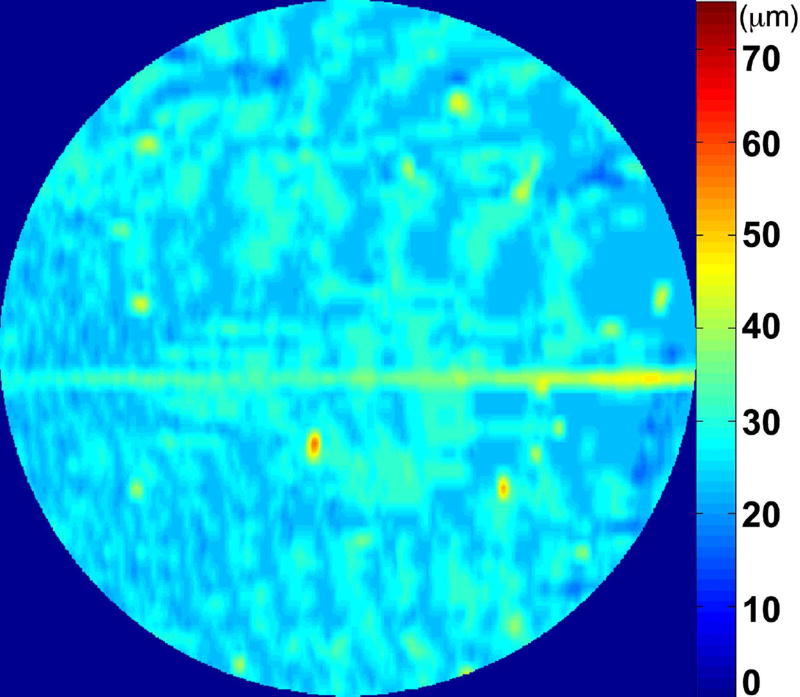
We calculated the volumes of the retina, inner and outer retina, and RPE-drusen-complex, by first centering the layer boundary positions on the fovea, then generating thickness maps 73x1024 pixels in size. These maps were interpolated to 1001x1001 pixels to achieve equivalent resolutions in both en face (X-Y) directions. Thickness values were converted from pixels to micrometers according to the Spectralis SDOCT imaging axial resolutions. The volumes consisted of the thicknesses integrated over the 12° (3.46 mm) diameter region centered on the fovea (Figure 1 top right, black ring), within a 6° (1.73 mm) diameter region centered on each of the eight cone sensitivity test sites (Figure 1 bottom left, white rings), and within a 6° (1.73 mm) diameter region centered on the dark adaptation site (Figure 1 bottom right, green ring). Several of the regions of OCT volumes were truncated at the margin of the SDOCT scan; these were at the same location for all eyes (Figure 3). Overlaid thickness maps and representative B-scans for each group are illustrated in Figure 3.
Figure 3.
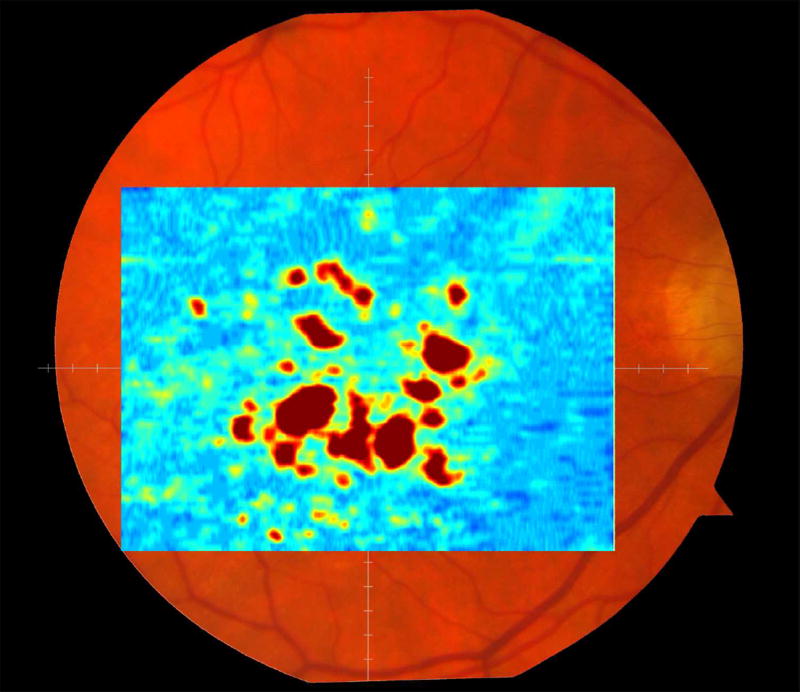
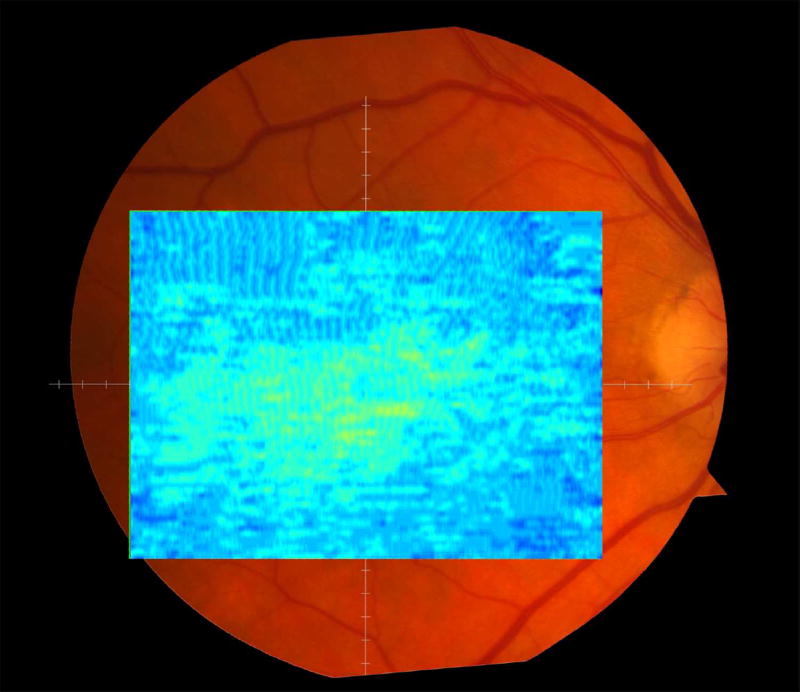
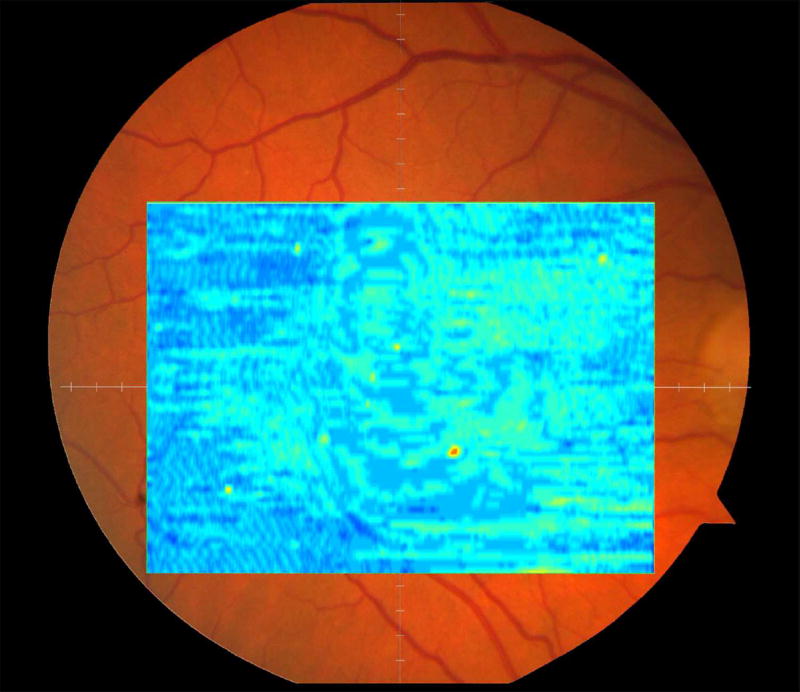
Color fundus photographs and retinal pigment epithelium (RPE)-drusen-complex volume maps in the four age-related macular degeneration study groups. Top row: Color fundus photographs with schematic overlay of dark adaptation site and perimetry sites (See Figure 1). Middle row: Overlay of retinal thickness maps from Spectralis SDOCT on color fundus photography. Bottom row: Representative foveal B-scans are also shown for each: No Apparent Aging (First column), Normal Aging (Second column), Early AMD (Third column), Intermediate AMD (Fourth column).
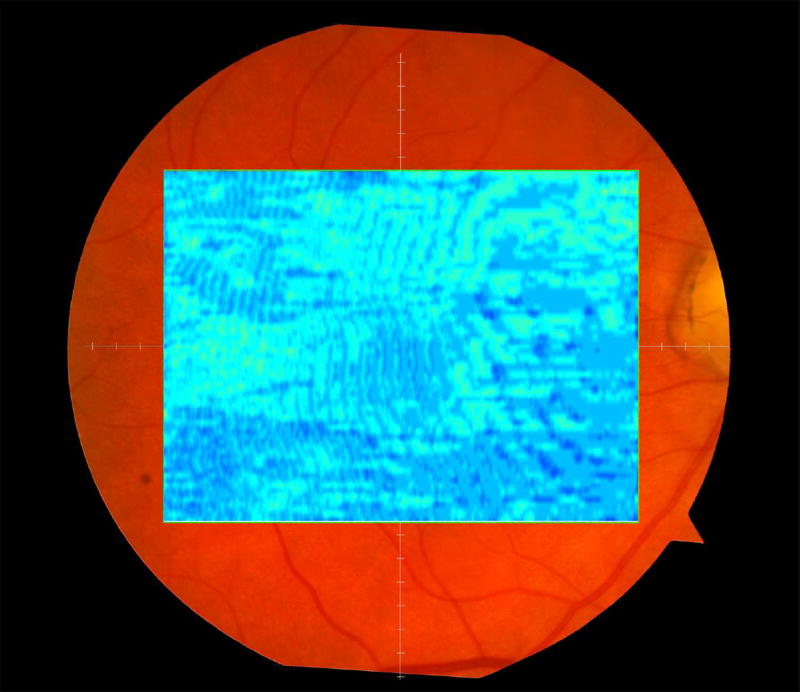
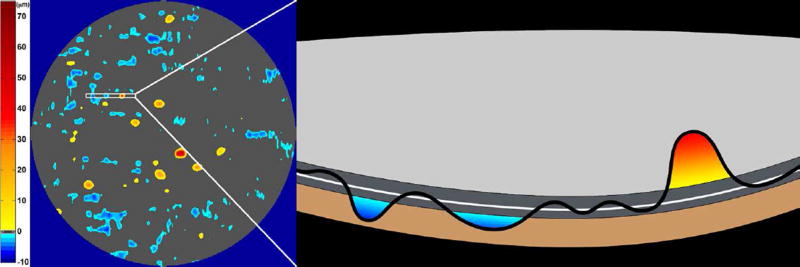
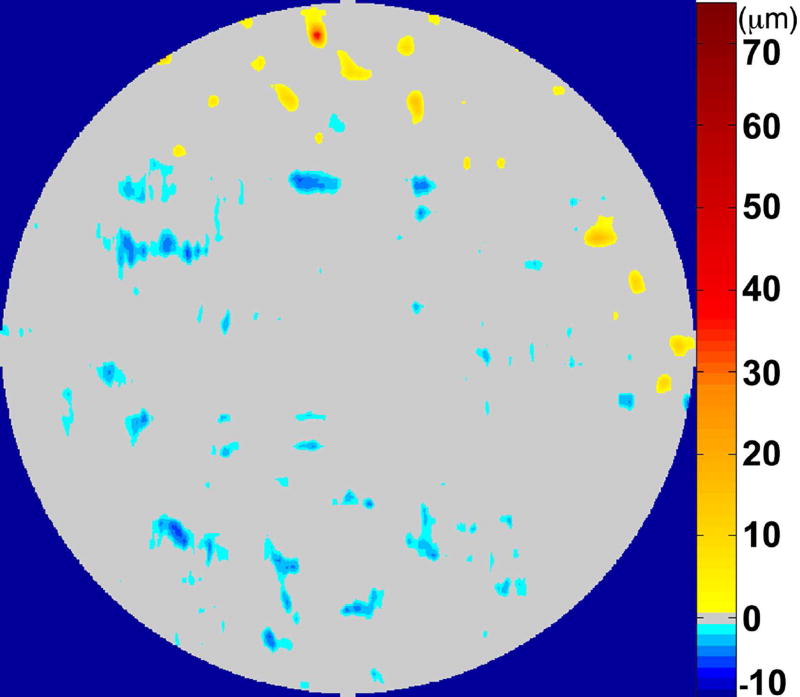
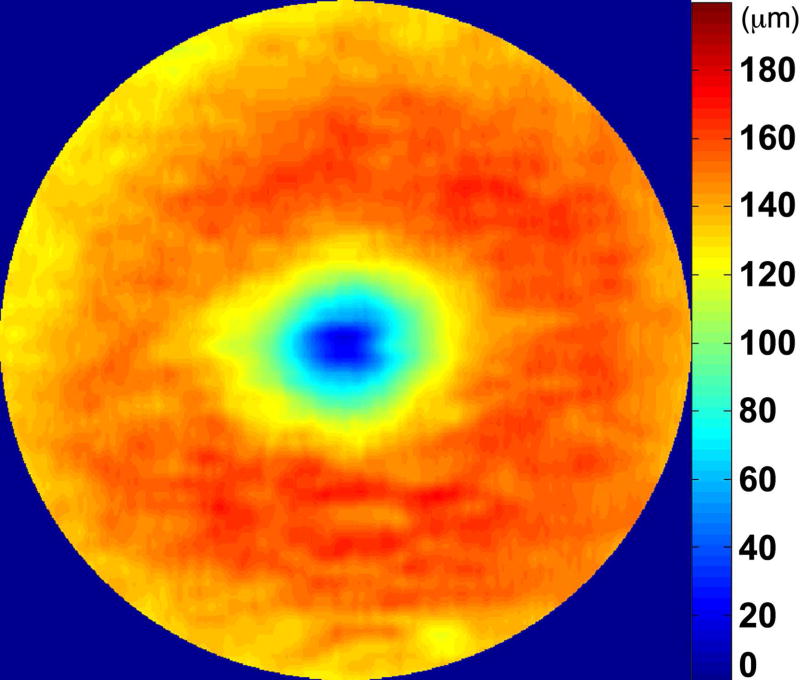
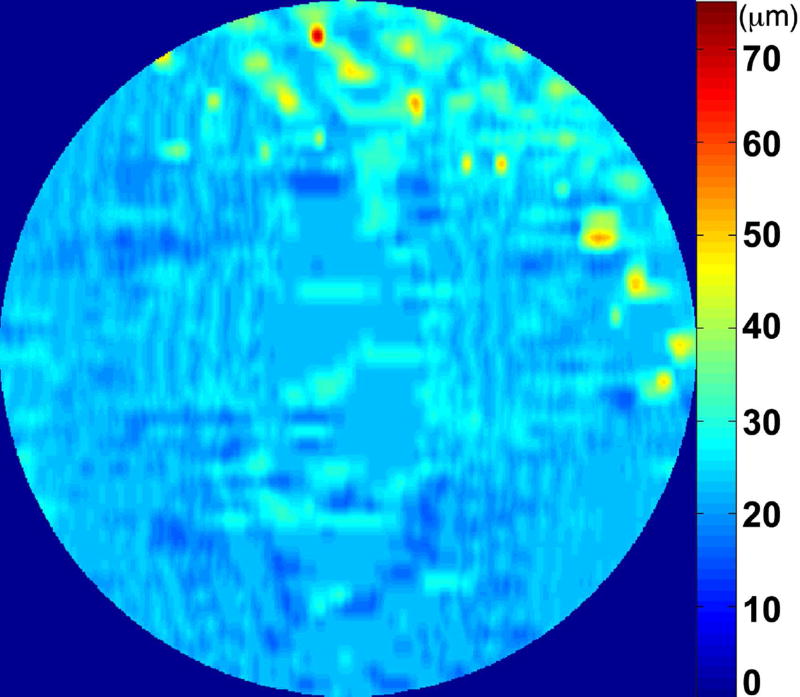
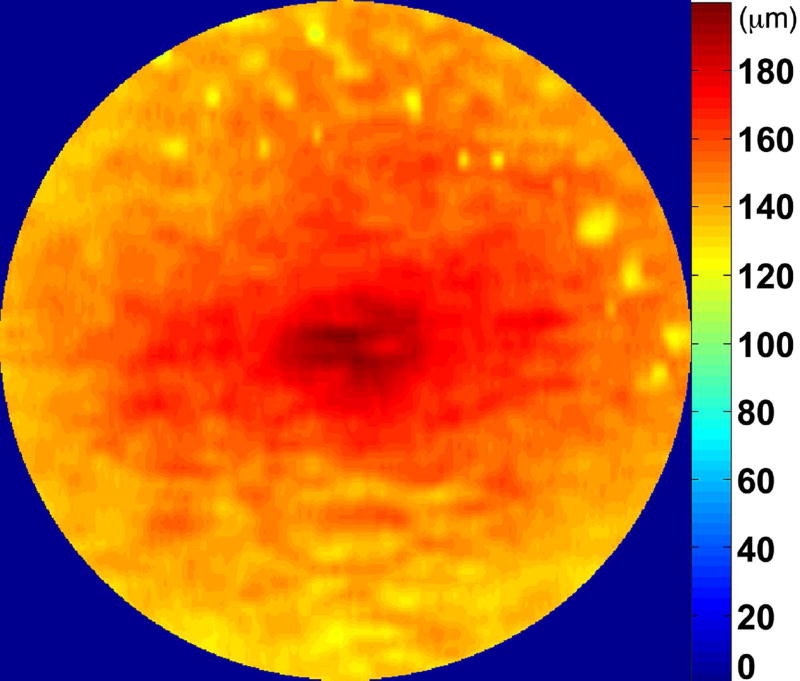
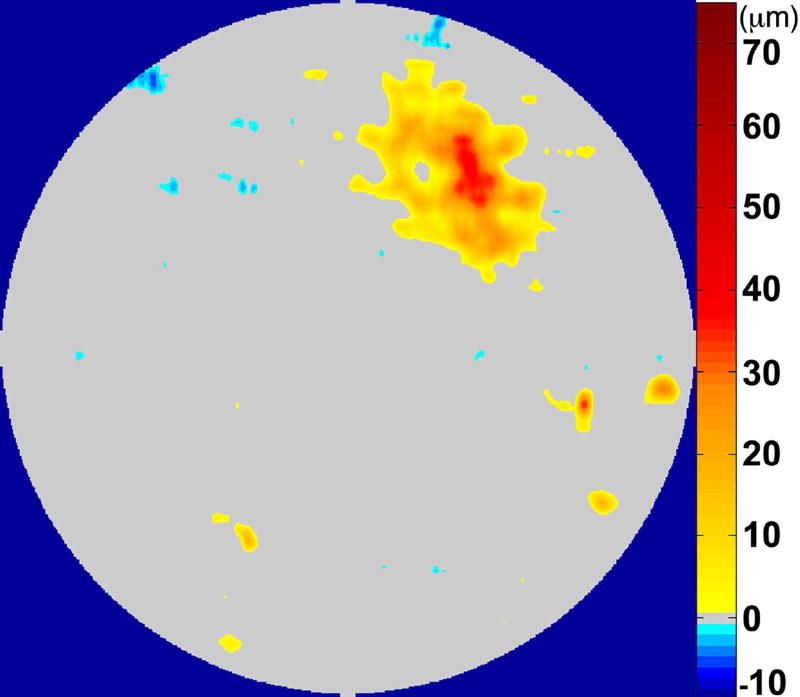
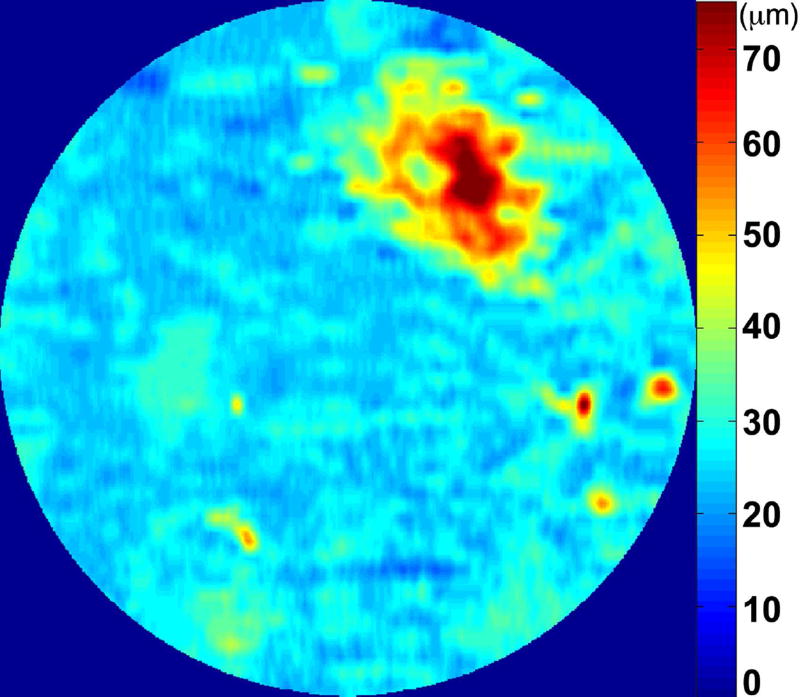
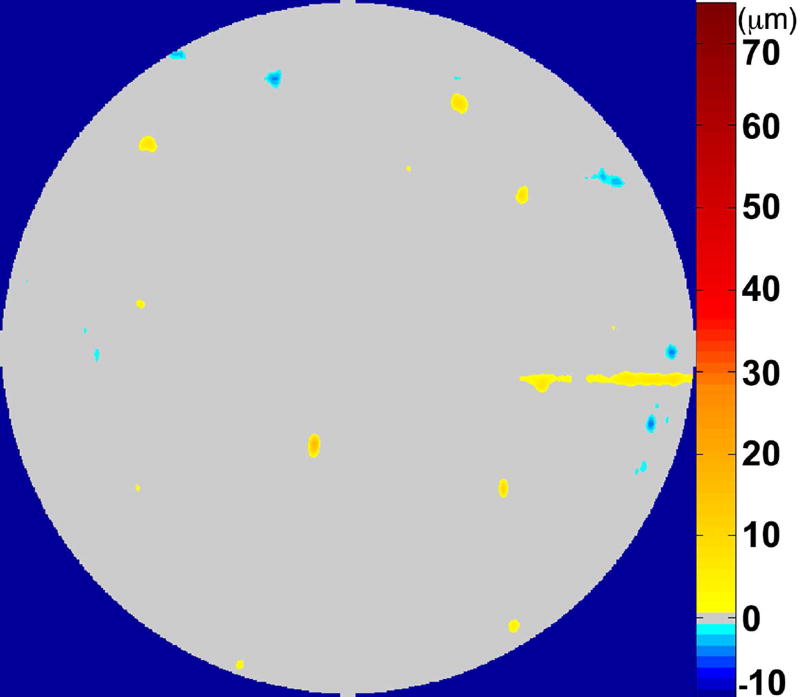
The RPE-drusen-complex abnormal thickening and abnormal thinning volumes were also computed. The volume of RPE-drusen-complex abnormal thickening, is a measure of RPE-drusen-complex that exceeds three standard deviations above the mean of each SDOCT axial measurement point from the normative data set composed of the 15 No Apparent Aging subjects (Figure 4, orange tones).16, 17 RPE-drusen-complex abnormal thinning volume (mm3) is defined as the cumulative loss of volume from sites with volume loss of two or more standard deviations below the mean at each location based on the mapped SDOCT thicknesses from 15 No Apparent Aging subjects (Figure 4, blue tones).17, 18 RPE-drusen-complex abnormal thinning is thus the cumulative absolute value of deviation of RPE-drusen-complex thickness measurements below the macular site-specific normal range. Detailed methods have been published for these analyses in a larger AMD and control population in the Age-Related Eye Disease Study 2 (AREDS2) Ancillary SDOCT Study.16, 17
Figure 4.
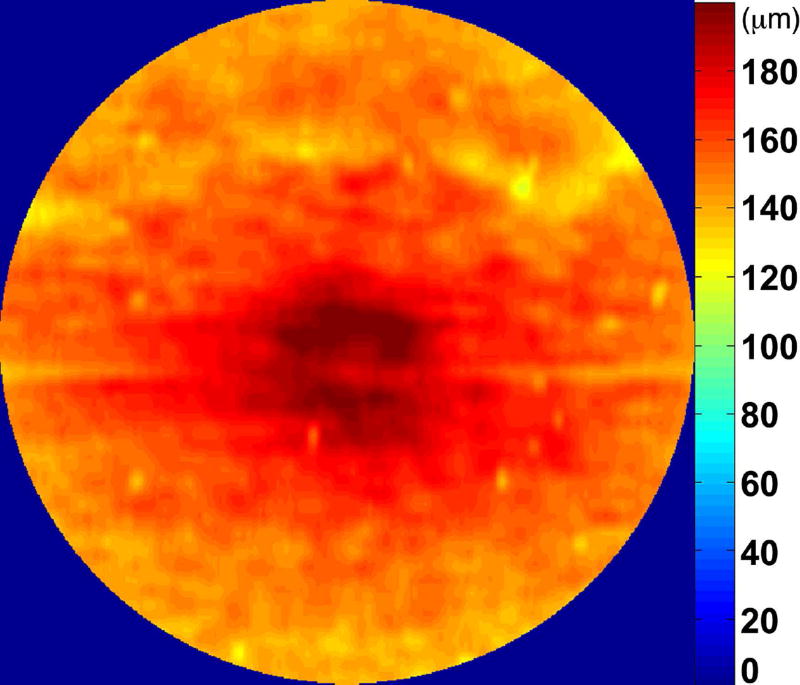
A map of abnormal retinal pigment epithelium (RPE)-drusen-complex thickness (Left) within the 12° diameter macular field of an eye with intermediate age-related macular degeneration (AMD), and an exaggerated schematic diagram (Right) of cross-sectional RPE-drusen-complex thickness within the region of the white box. At right, the black line, is the segmentation line of the inner border of the RPE-drusen-complex layer in this AMD eye, and the white line, is mean RPE-drusen-complex thickness calculated from the No (retinal) Aging dataset. In both images, the dark gray area is the normal range of RPE-drusen-complex thickness based on the non-AMD dataset, with upper limit defined as ≥3 standard deviations above the mean and lower limit defined as ≥2 standard deviations below the mean in the No Apparent Aging dataset. In both images, the orange tones, are the areas included in RPE-drusen-complex abnormal thickening volume, obtained from RPE-drusen-complex thickness measurements greater than the normal range, and the blue tones, are the areas included in RPE-drusen-complex abnormal thinning volume, defined as the volume lost due to RPE-drusen-complex thickness measurements below the normal range. Note that RPE-drusen-complex abnormal thickening volume can decrease without necessarily increasing RPE-drusen-complex abnormal thinning volume.
A post hoc analysis was performed to compare OCT-based-drusen volume in intermediate AMD from this study (N = 46) to the baseline AREDS 2 Ancillary SDOCT Study Intermediate AMD group without geographic atrophy (N = 184). All volumes were calculated as described above over the same retinal area of 12° (3.46 mm) diameter centered on the fovea. The mean and standard deviation of drusen volume per mm2 were compared between groups using the Wilcoxon rank sums test.
Biostatistical Approach
We compared the three different functional assessments with their corresponding structural SDOCT assessment (by region): visual acuity (foveal centered region, black ring in Figure 1), cone-mediated light sensitivity (six regions, white rings in Figure 1), rod-mediated dark adaptation as assessed by rod intercept time (single superior region, green ring in Figure 1) and to SDOCT assessments for the entire macular region. Analyses were performed for AMD subgroups based on fundus appearance using the Clinical Classification System, across the entire study population.
Statistical analysis was performed using JMP Pro V11 (SAS, Cary, NC) and SAS V9.4 (SAS, Cary, NC). Demographic and visual functional characteristics were compared between groups using chi-square tests and analysis of variance (or non-parametric equivalents). Age-adjusted Spearman correlation coefficients were calculated for the association between functional and structural variables. Analysis of variance was also used to compare functional and structural variables between eyes with and without SDD, adjusted for age.
RESULTS
There were no significant differences in gender distribution and racial makeup among the four groups. The overall sample was 39.6% male and 98.7% Caucasian. Patients with intermediate AMD were older than patients in other groups (Table 1). After adjusting for age, there was no difference between groups in visual acuity (overall sample mean logMAR 0.00), cone-mediated sensitivity (overall sample mean 31.3 dB), or rod-mediated dark adaptation (overall sample mean 11.2 min) (Table 1).
Table 1.
Demographic and visual functional characteristics of participants by Beckman Age-related Macular Degeneration Classification, age-adjusted N =91 eyes.
| Parameter | Overall Sample (N = 91) |
No Aging (N = 15) |
Normal Aging (N = 15) |
Early AMD (N = 15) |
Intermediate AMD (N = 46) |
p-Value |
|---|---|---|---|---|---|---|
| Age (years), M (SD) | 69.3 (6.5) | 66.1 (5.1) | 66.9 (6.0) | 68.9 (5.7) | 71.3 (6.8) | 0.016 |
|
| ||||||
| Gender, n (%) | 0.57 | |||||
| Male | 36 (39.6) | 5 (33.3) | 4 (26.7) | 6 (40.0) | 21 (45.7) | |
|
| ||||||
| Race, n (%) | 0.75 | |||||
| Caucasian | 89 (97.8) | 15 (100) | 14 (93.3) | 15 (100) | 45 (97.8) | |
| African-American | 1 (1.1) | 0 (0) | 1 (6.7) | 0 (0) | 0 (0) | |
| Other | 1 (1.1) | 0 (0) | 0 (0) | 0 (0) | 1 (2.2) | |
|
| ||||||
| Visual acuity, logMAR, M (SD) | 0.00 (0.12) | −0.03 (0.12) | 0.00 (0.08) | −0.06 (0.09) | 0.01 (0.13) | 0.24 |
|
| ||||||
| Cone-mediated sensitivity a, dB, M (SD) | 31.3 (1.9) | 31.9 (1.2) | 31.7 (3.1) | 31.3 (1.3) | 31.0 (1.8) | 0.35 |
|
| ||||||
| Rod-mediated dark adaptation b, rod intercept in minutes, M (SD) | 11.2 (4.8) | 10.3 (2.4) | 11.2 (3.8) | 11.0 (3.3) | 11.7 (6.5) | 0.82 |
M = mean, SD = standard deviation, AMD = Age-related Macular Degeneration
Mean sensitivity across zones 1 – 8.
N = 66
When functional outcomes were analyzed by quantitative structural SDOCT findings across the entire group, visual acuity was not correlated with SDOCT volumes, except for a borderline association between higher logMAR (signifying worse visual acuity) and decreased volume of the inner retina (Table 2, r=-0.21, p=0.05). Better cone-mediated sensitivity, however, was associated with greater RPE-drusen-complex volume (Table 2, r=0.34, p<0.001) and less RPE-drusen-complex abnormal thinning volume (Table 3, r=-0.31, p=0.003). No other retinal volume variables were related to cone-mediated sensitivity. Larger rod intercept times (signifying delayed rod-mediated dark adaptation) correlated with lower RPE-drusen-complex volume (Table 2, r=-0.34, p=0.005) and greater RPE-drusen-complex abnormal thinning volume (Table 3, r=0.28, p=0.02). No other retinal volume variables were related to rod-mediated dark adaptation.
Table 2.
Spearman correlations between visual functional measures and volumes of various macula layers, age-adjusted N = 91 eyes.
| Visual Function |
RPEDC Volume |
p- Value |
Outer Retina Volume |
p- Value |
Inner Retina Volume |
p- Value |
Retina Volume |
p- Value |
|---|---|---|---|---|---|---|---|---|
| Visual acuity | 0.069 | 0.516 | −0.013 | 0.906 | −0.206 | 0.052 | −0.151 | 0.154 |
| Cone-mediated sensitivitya | 0.344 | 0.0009 | −0.175 | 0.099 | 0.062 | 0.564 | 0.072 | 0.500 |
| Rod-mediated dark adaptationb | −0.342 | 0.005 | −0.053 | 0.674 | −0.065 | 0.608 | −0.045 | 0.722 |
Mean sensitivity across zones 1 – 8.
N = 66 eyes
Table 3.
Spearman correlations between drusen volume and retinal pigment epithelium-drusen-complex abnormal thinning volume indexed for visual acuity, cone-mediated sensitivity, and rod-intercept.
| Visual Function | Drusen Volume | p-Value | RAT Volume | p-Value |
|---|---|---|---|---|
| Visual Acuity | 0.017 | 0.876 | 0.017 | 0.875 |
|
| ||||
| Cone-mediated sensitivitya | ||||
| Mean | −0.045 | 0.671 | −0.312 | 0.003 |
| Minimum | −0.053 | 0.616 | −0.273 | 0.009 |
| Maximum | −0.050 | 0.639 | −0.328 | 0.002 |
|
| ||||
| Rod-mediated dark adaptationb | −0.003 | 0.979 | 0.280 | 0.023 |
RAT = retinal pigment epithelium-drusen-complex abnormal thinning,
Mean sensitivity across zones 1 – 8,
N = 66 eyes
For the purposes of analysis, cone-mediated sensitivity was defined per subject as the average sensitivity across the 8 test targets within a 6° (1.73 mm) diameter, and also the average of each eye’s lowest sensitivity target (minimum), and the average of the eye’s highest sensitivity points for each eye (maximum). Age-adjusted N = 91 eyes (unless otherwise noted).
When one considered the functional parameters relative to qualitative grading for presence of retinal SDOCT structures across the entire study group, visual acuity decreased in the presence of either vitreomacular attachment or epiretinal membrane (p = 0.02, p=0.0247 respectively), and larger rod-intercept times were associated with hyperreflective foci (p = 0.05). No other functional parameters were related to the qualitative grading of the retinal SDOCT structures across the group or by AMD group.
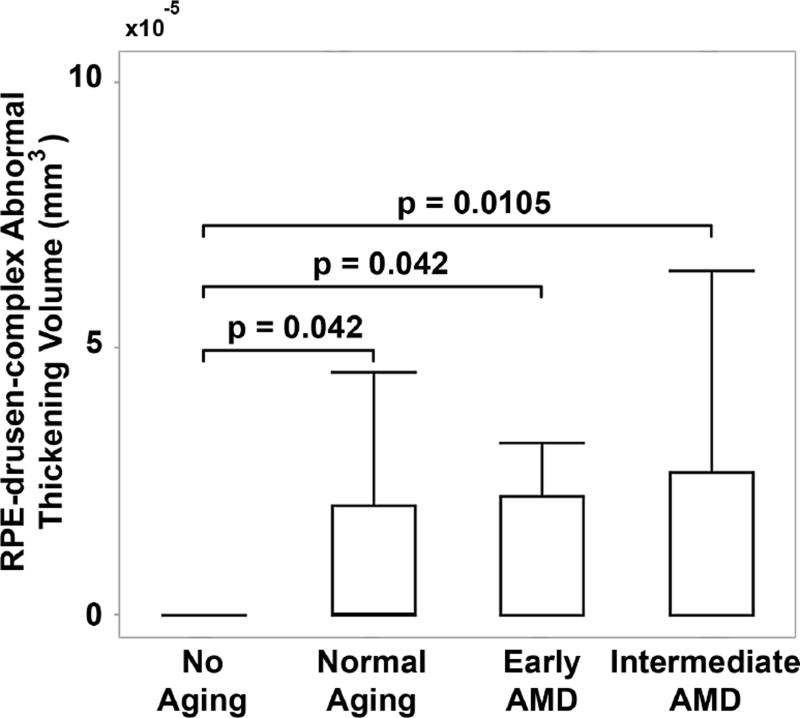
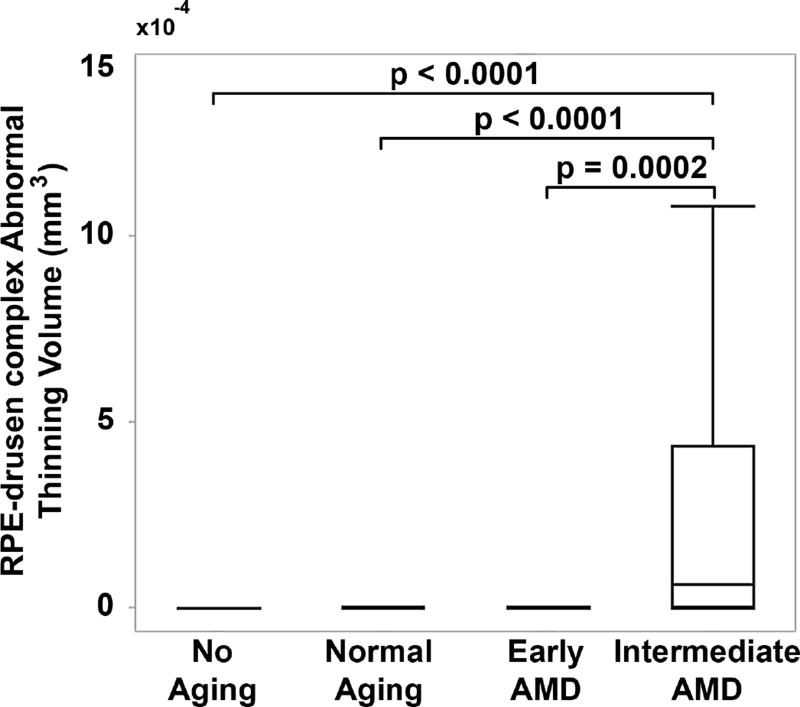
When evaluating quantitative SDOCT structural characteristics of the AMD groups, the RPE-drusen-complex volume, outer retina volume, inner retina volume, and retina volume were not significantly different among groups (Table 4). However, RPE-drusen-complex abnormal thickening volume and RPE-drusen-complex abnormal thinning volume were significantly different between AMD groups (Table 4, p=0.03, p<0.0001 respectively). Specifically, lower RPE-drusen-complex abnormal thickening volume differentiated the No Apparent Aging group from each of the other groups (all p<0.05, Figure 5), whereas greater RPE-drusen-complex abnormal thinning volume differentiated Intermediate AMD from each of the other groups (all p<0.05, Figure 6).
Table 4.
Retinal volumes by Beckman Age-related Macular Degeneration Classification.
| Parameter | Overall Sample (N = 91) |
No Aging (N = 15) |
Normal Aging (N = 15) |
Early AMD (N = 15) |
Intermediate AMD (N = 46) |
p-Value |
|---|---|---|---|---|---|---|
| RPEDC Volume mm3, M (SD) | 0.26 | 0.25 | 0.26 | 0.25 | 0.026 | 0.837 |
| (0.028) | (0.025) | (0.026) | (0.020) | (0.032) | ||
|
| ||||||
| Outer Retina Volume mm3, M (SD) | 1.42 | 1.42 | 1.42 | 1.44 | 1.42 | 0.411 |
| (0.072) | (0.072) | (0.03) | (0.08) | (0.08) | ||
|
| ||||||
| Inner Retina Volume mm3, M (SD) | 1.36 | 1.35 | 1.38 | 1.35 | 1.36 | 0.819 |
| (0.101) | (0.097) | (0.104) | (0.095) | (0.105) | ||
|
| ||||||
| Retina Volume mm3, M (SD) | 2.78 | 2.77 | 2.80 | 2.79 | 2.78 | 0.911 |
| (0.14) | (0.139) | (0.107) | (0.139) | (0.145) | ||
|
| ||||||
| Drusen Volume ×10−4 mm3, M (SD) | 1.64 | 3e-6 | 0.18 | 0.13 | 3.14 | 0.0315 |
| (12.43) | (1.161e-5) | (0.47) | (0.30) | (17.44) | ||
|
| ||||||
| RAT Volume ×10−4 mm3, M (SD) | 1.57 | 0.0507 | 0.10 | 0.119 | 3.00 | <0.0001 |
| (3.59) | (0.14) | (0.28) | (0.39) | (4.62) | ||
RPEDC = retinal pigment epithelium-drusen-complex, M = mean, SD = standard deviation, AMD = Age-related Macular Degeneration
Figure 5.
Drusen volume by age-related macular degeneration (AMD) classification group. Retinal pigment epithelium (RPE)-drusen-complex abnormal thickening volume was significantly differentiated between No Apparent Aging and each of the other groups, but not between the other groups (box delineates 25th and 75th percentile, whiskers the 95th percentile and bar the median).
Figure 6.
Retinal pigment epithelium (RPE)-drusen-complex abnormal thinning volume by age-related macular degeneration classification group. RPE-drusen-complex abnormal thinning volume was significantly differentiated between Intermediate AMD and each of the other groups, but not between the other groups (box delineates 25th and 75th percentile, whiskers the 95th percentile and bar the median).
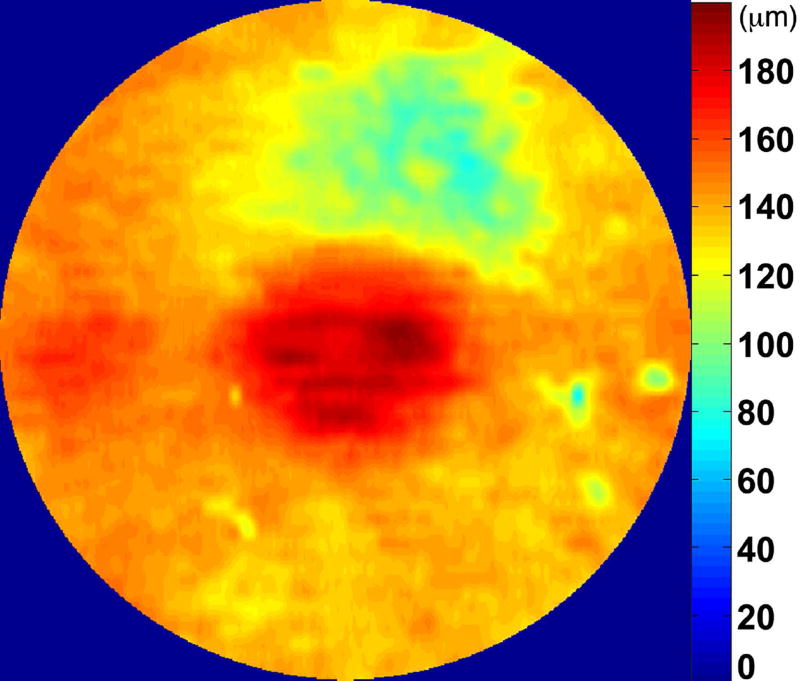
On qualitative grading, we did appreciate differences in SDOCT structures among the AMD groups. Notably, the interdigitation of outer segments and RPE apical processes was less apparent in the Early and Intermediate AMD groups than in the age-matched No Apparent Aging and Normal Aging groups (Figure 3). Atypical disease findings were identified on SDOCT that were not noted on clinical examination or fundus photographs. One eye in the Early AMD group had thinning of the retina along the upper arc of the SDOCT inner retinal thickness map (Figure 8 top row, fifth column) without visible abnormality on color fundus photograph (Figure 8 top row, first column). Furthermore, in an Intermediate AMD eye, a widespread pigment epithelial detachment on SDOCT was visible superior to the fovea as thickening, which is abnormal (Figure 8 middle row, second and third columns) and extends much further than the focal pigmentary change visible on a color fundus photograph (Figure 8 middle row, first column). This region matches the thinning of the outer retina (light blue area) visible in the outer thickness map (Figure 8 middle row, fourth column). In another participant with intermediate AMD, drusen are visible along the superior arcade as depicted in the total, abnormal, and outer retinal thickness maps (Figure 8 bottom row, second, third, and fourth columns), although they are not as readily seen on color fundus photograph and inner retinal thickness map in another participant with early AMD (Figure 8 top row, first and fifth columns).
Figure 8.
Color fundus photographs (Left column) versus spectral domain optical coherence tomography (SDOCT) quantitative maps of tissue volumes within the 12° (3.46 mm) central region (all other columns) demonstrate abnormalities revealed by SDOCT but not on color fundus photographs: Retinal pigment epithelium (RPE)-drusen-complex volume maps (Second column), RPE-drusen-complex abnormal thickening and thinning volume maps (Third column), outer retinal volume maps (Fourth column), and inner retinal volume maps (Fifth column). An eye with Early AMD (Top row), color fundus photograph showing normal and SDOCT quantitative maps showing minimum drusen. An eye with Intermediate AMD (Middle row), color fundus photograph showing normal and SDOCT quantitative maps showing large area of drusen. An eye with Intermediate AMD (Bottom row), color fundus photograph showing normal and SDOCT quantitative maps showing atrophy.
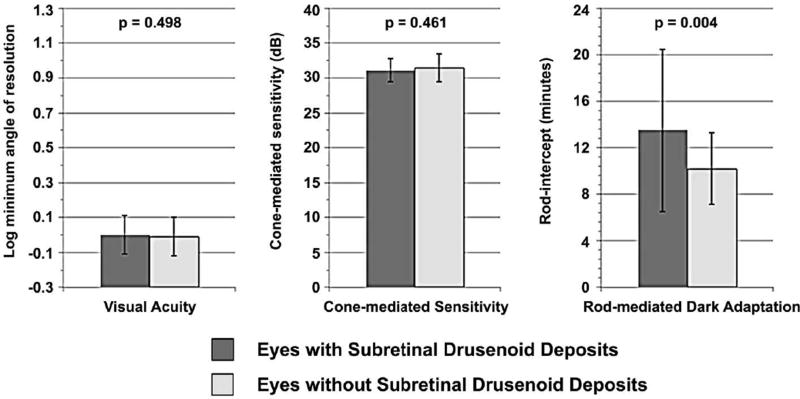
Between the 19 eyes with SDD and 47 eyes without, there was no difference in visual acuity and cone-mediated sensitivity (Figure 7). However, the rod-intercept differed significantly for eyes with SDD (mean 13.5, SD 7.0 minutes) versus those without deposits (mean 10.2, SD 3.1 minutes, p=0.004). For eyes with SDD, the RPE-drusen-complex volume was lower, RPE-drusen-complex abnormal thickening volume trended lower and there was greater RPE-drusen-complex abnormal thinning volume as compared to eyes without SDD (Table 5, p=0.03, p=0.0668, p<0.0001 respectively). Subretinal drusenoid deposits did not differentiate any other retinal volumes.
Figure 7.
Visual function in eyes with and without subretinal drusenoid deposits. Rod-mediated dark adaptation was significantly differentiated between eyes with and without subretinal drusenoid deposits, while visual acuity and cone-mediated sensitivity were comparable.
Table 5.
Volumes of retinal layers in eyes with and without subretinal drusenoid deposits.
| Parameter | Eyes with SDD (N = 29) |
Eyes without SDD (N = 62) |
Age- adjusted p-Value |
|---|---|---|---|
| RPEDC Volume mm3, M (SD) | 0.25 | 0.26 | 0.0322 |
| (0.022) | (0.030) | ||
|
| |||
| Outer Retina Volume mm3, M (SD) | 1.44 | 1.42 | 0.0901 |
| (0.089) | (0.061) | ||
|
| |||
| Inner Retina Volume mm3, M (SD) | 1.34 | 1.37 | 0.1317 |
| (0.109) | (0.096) | ||
|
| |||
| Retina Volume ×10−4 mm3, M (SD) | 2.78 | 2.79 | 0.9321 |
| (0.17) | (0.12) | ||
|
| |||
| Drusen Volume ×10−4 mm3, M (SD) | 0.71 | 2.07 | 0.0668 |
| (2.92) | (14.95) | ||
|
| |||
| RAT Volume, M (SD) | 4.2 | 0.357 | <0.0001 |
| (5.19) | (1.40) | ||
SDD = subretinal drusenoid deposits, RPEDC = retinal pigment epithelium-drusen-complex, M = mean, SD = standard deviation, RAT = retinal pigment epithelium-drusen-complex abnormal thinning
DISCUSSION
Currently, early and intermediate AMD are lacking in reliable functional markers to serve as endpoints for clinical trials. Since the early stages of AMD progress gradually, standard functional endpoints such as visual acuity are often unaffected for years after a patient is diagnosed with AMD. By the time visual acuity is affected, the pathology has significantly advanced.19
We examined the relationship between morphology and function in aging and early and intermediate AMD by correlating retinal structure on SDOCT imaging with macular function as characterized by visual acuity, cone-mediated perimetry and rod-mediated dark adaptation. The purpose of this study was to develop methods that reliably evaluate the relationship between AMD pathology and psychophysically measured cone- and rod-mediated function. Retinal imaging by SDOCT was utilized to identify key factors that can serve as useful markers of AMD stages.
Analysis of structural data revealed that abnormal volumes of RPE-drusen-complex were differentiated by Beckman AMD color fundus photography classification. RPE-drusen-complex abnormal thickening volume was significantly different between No Apparent Aging and each of the other groups, but there was no difference found between the other groups (Figure 5). When contrasted with the lack of functional difference between groups, it appears that SDOCT volumes may be more sensitive predictors of AMD onset compared to functional parameters (Table 1). It was notable that RPE-drusen-complex abnormal thinning volume was significantly different between Intermediate AMD and each of the other groups, but not between the other groups (Figure 6), suggesting that RPE-drusen-complex abnormal thinning volume may represent a useful structural marker for Intermediate AMD in contrast to color fundus photography. There was no significant difference among the four AMD study groups in RPE-drusen-complex, retinal volumes, or inner and outer retinal volumes. It is important to note that our data pertain to the very low end of drusen volume. A lack of differentiation may be due to the difficulty of precisely assessing smaller drusen loads from color fundus photography, but also may reflect the mismatch between the volume of drusen as determined by SDOCT in contrast to that ascertained by fundus photograph review.
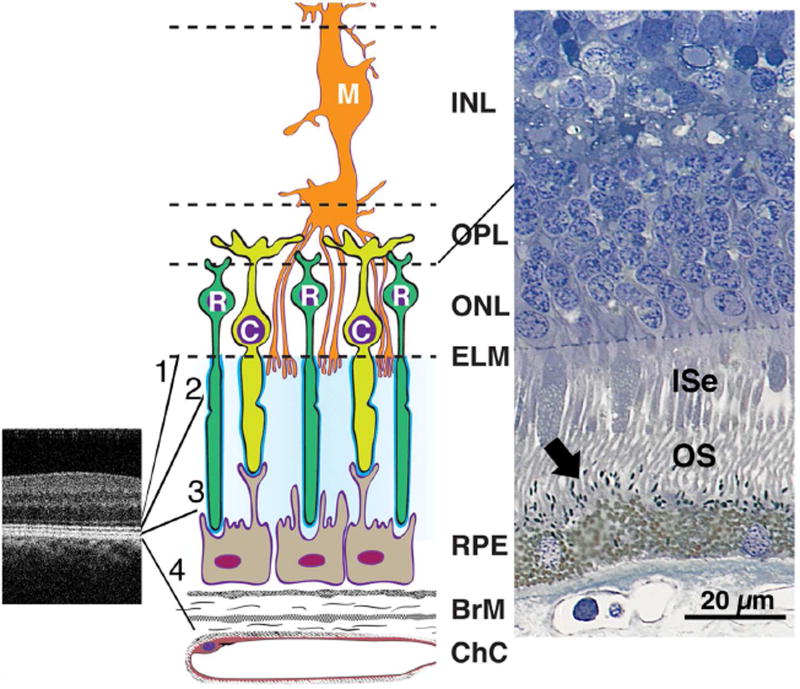
It was not surprising to find a lack of association between visual acuity and any AMD group, structural marker or other test of function in this study. In our study cohort, the thickness of outer retina also does not appear to be a predictor of letter acuity, cone or rod function in early AMD. In contrast, greater RPE-drusen-complex abnormal thinning volume appears to be associated with both worse cone and rod function in this population. The association of slowed dark adaptation with a thinned RPE-drusen-complex can be explained via two physiologic pathways: 1) structural differences appear in outer segments first,20–22 or 2) structural differences appear in the RPE and Bruch’s membrane (Bruch’s membrane) complex first.23–25 In the first pathway, changes in the outer segments lead to photoreceptor loss and atrophy, and over time adversely affect cone sensitivity and rod function. Our findings may be due to early photoreceptor degeneration and/or cell death over thinned RPE-drusen-complex, despite the lack of outer retinal thinning. This may be due to the earliest photoreceptor changes/loss involving the interdigitation zone, interdigitation of tips of cone and rod outer segments, their matrix sheaths and microvilli on the RPE apical surface (Figure 9 middle, right), anatomic structures which are subsumed in the RPE-drusen-complex. This segmentation delineation has been utilized for aged eyes, because in AMD eyes the interdigitation zone may be difficult to distinguish from the RPE on many OCT systems including in the presence of SDD. Figure 9 illustrates the cellular and extracellular constituents of four outer retinal hyper-reflective bands: external limiting membrane, ellipsoid zone, interdigitation zone and RPE. Outer segments and apical process melanosomes contribute reflectivity to the interdigitation zone.26 RPE apical processes also contain many proteins in retinoid processing pathways,27 and thus diminution of interdigitation zone anatomical substrates could negatively impact dark adaptation. The interdigitation zone is affected early in several outer retinal diseases, including AMD.28–31 The RPE-drusen-complex abnormal thinning volume found in this study could reflect a disease-associated change in interdigitation zone reflectivity. Such a change in reflectivity was identified in our qualitative SDOCT grading: the interdigitation zone was less apparent in the Early and Intermediate AMD groups compared to those with Normal or No Apparent Aging. This consideration could prompt development of methods suitable for further objectively quantifying the interdigitation zone.32 Although this interface is a strong candidate for a site of early functional losses, our current SDOCT data do not allow us to determine the relative contribution of the other layers in the RPE-drusen complex (SDD, RPE cell bodies, basal laminar deposit, and basal linear deposit/soft drusen).
Figure 9.
Outer retinal anatomy relevant to interpreting retinal pigment epithelium (RPE)-drusen-complex thinning in early AMD. Abbreviations: C, cone; ChC, choriocapillaris; ELM, external limiting membrane; EZ, ellipsoid zone; INL, inner nuclear layer; ISe, inner segment ellipsoid; IZ, interdigitation zone; M, Müller cell; ONL, outer nuclear layer; OPL, outer plexiform layer; OS, outer segment; R, rod; RPE, retinal pigment epithelium.
SDOCT image of the perifoveal region in a normal macula (Left). The four outer retinal hyperreflective bands (from inner to outer between the expansion lines) are 1, external limiting membrane (ELM), 2, ellipsoid zone (EZ), 3, interdigitation zone (IZ), and 4, RPE-Bruch’s membrane complex. Contributory anatomical structures are expanded (not to scale) and schematized in middle panel. Cellular and extracellular components of the four outer retinal hyper-reflective bands include cones, rods, Müller cells, RPE, and Bruch’s membrane (Middle). Surrounding the photoreceptor inner and outer segments is a proteinaceous interphotoreceptor matrix (pale blue). Each individual photoreceptor is ensheathed by specialized domains (bright blue). Histology of outer retina from a normal human eye (Right, http://projectmacula). In this specimen, spindle-shaped melanosomes (arrow) can be recognized within RPE apical processes, interdigitated with the OS.
In normal aging, Bruch’s membrane thickens and lipidizes, and basal laminar deposits accumulate in patches between the RPE and its basal lamina.23, 24 In addition the inner collagenous layer of Bruch’s membrane is even thicker in early AMD, thus compromising the diffusion of nutrients.33 A similar case for impaired transport could be made for SDD, which sit between RPE and photoreceptor outer segments.34 In a vascular insufficiency model of outer retinal aging, this thickening of Bruch’s membrane combines with changes in aging RPE and subretinal space to impair the translocation of retinoids to photoreceptors. This could lead to slowed dark adaptation by rods, which depend particularly on this supply route.25, 35, 36 For functional loss related to such deposits, a greater volume of deposits may have been required than was present in this group of aged and AMD eyes. For example, the RPE-drusen-complex abnormal thickening volume for the Intermediate AMD group in this study was 3.14 × 10⁻⁴ ± 17.44 × 10⁻⁴ mm3 for the central 12° (3.46 mm) diameter of the macula in contrast to 6.71 × 10⁻² ± 13.77 × 10⁻² mm3 in the Intermediate AMD group in the Age Related Eye Disease Study 2 Ancillary SDOCT Study.
The association of slowed dark adaptation and decreased cone sensitivity with a thinned RPE-drusen-complex could also be explained through a pathway of intracellular changes in the RPE as drusen material is removed and cells proceed into a less functional pre-atrophy stage.37 This explanation is plausible, given that SDD seem to confer an increased risk of progression to GA,38, 39 and this study found that eyes with SDD had greater RPE-drusen-complex abnormal thinning volume (Table 5). The diffusion of nutrients may be dysfunctional even without buildup of extracellular deposits, due to pathologic processes in the delicate balance of cell activity important for photoreceptor function.40
In this study, we found that decreased photoreceptor function relates to structural markers on SDOCT in aging eyes and early and intermediate AMD: worse cone-mediated sensitivity and slower rod-mediated dark adaptation were related to greater RPE-drusen-complex abnormal thinning volume. Eyes with slower rod-mediated dark adaptation were also more likely to have smaller RPE-drusen-complex volumes, while better cone-mediated sensitivity was associated with greater RPE-drusen-complex volume. Because RPE-drusen-complex includes the interdigitation of outer segments and RPE apical processes in healthy eyes and SDD in eyes with AMD along with the RPE and sub-RPE structures, worse visual function (slower rod-mediated dark adaptation and worse cone-mediated sensitivity) might be related to structural abnormalities at the RPE-photoreceptor interface.
This study is unique in having a patient cohort that is currently in good macular health, so that the earliest signs of AMD can be investigated. Ultimately, longer follow-up is warranted to accurately relate SDOCT biomarkers with AMD mechanisms, risk factors, and clinical progression. In order to investigate disease-related functional impairment in intermediate AMD, future studies can incorporate a larger patient cohort that spans a wider range of drusen volume to thoroughly assess the relationship between local microanatomy and function.
Supplementary Material
Acknowledgments
Funding/Support: This research was supported by: the Arnold and Mabel Beckman Initiative for Macular Research (Irvine, CA), Research to Prevent Blindness (New York, NY), the Ernest and Della Thome Foundation (Boston, MA), and the National Eye Institute (NIH EY06109; P30 EY003039) and the National Institute on Aging (R01AG04212). The funding organizations had no role in the design or conduct of this research.
The authors would like to thank Vincent Tai, MS (Department of Ophthalmology, Duke University Medical Center, Durham, NC) for assistance with image processing.
Footnotes
Publisher's Disclaimer: This is a PDF file of an unedited manuscript that has been accepted for publication. As a service to our customers we are providing this early version of the manuscript. The manuscript will undergo copyediting, typesetting, and review of the resulting proof before it is published in its final citable form. Please note that during the production process errors may be discovered which could affect the content, and all legal disclaimers that apply to the journal pertain.
Financial Disclosures:
Monica B. Sevilla: None. Gerald McGwin, Jr: None. Eleonora M. Lad: Through her University, Dr. Lad receives research support from Roche. Mark Clark: None. Eric L. Yuan: None. Sina Farsiu: US Patent #8,811,745. Christine A. Curcio: Through her University, Dr. Curcio receives research support through NIH EY06109, National Eye Institute P30 EY003039, Arnold and Mabel Beckman Initiative for Macular Research, International Retinal Research Foundation, Ernest and Della Thome Foundation, Research to Prevent Blindness, and EyeSight Foundation of Alabama. Cynthia Owsley: Through her University, Dr. Owsley receives research support through NIH R01AG04212, EyeSight Foundation of Alabama, Alfreda J. Schueler Trust, Research to Prevent Blindness, and is a patent holder on the apparatus used to measure dark adaptation in this study #20090153802; #20110007276; #20110141437. Cynthia A. Toth: Through her University, Dr. Toth receives research support from the Arnold and Mabel Beckman Initiative for Macular Research, Research to Prevent Blindness, NIH 1R01EY023039, Bioptigen, Genentech, and royalties from Alcon Laboratories.
References
- 1.Klein R, Chou CF, Klein BE, Zhang X, Meuer SM, Saaddine JB. Prevalence of age-related macular degeneration in the US population. Arch Ophthalmol. 2011;129(1):75–80. doi: 10.1001/archophthalmol.2010.318. [DOI] [PubMed] [Google Scholar]
- 2.Zweifel SA, Spaide RF, Curcio CA, Malek G, Imamura Y. Reticular pseudodrusen are subretinal drusenoid deposits. Ophthalmology. 2010;117(2):303–312.e301. doi: 10.1016/j.ophtha.2009.07.014. [DOI] [PubMed] [Google Scholar]
- 3.Dimitrov PN, Guymer RH, Zele AJ, Anderson AJ, Vingrys AJ. Measuring rod and cone dynamics in age-related maculopathy. Invest Ophthalmol Vis Sci. 2008;49(1):55–65. doi: 10.1167/iovs.06-1048. [DOI] [PubMed] [Google Scholar]
- 4.Owsley C, Jackson GR, Cideciyan AV, et al. Psychophysical evidence for rod vulnerability in age-related macular degeneration. Invest Ophthalmol Vis Sci. 2000;41(1):267–273. [PubMed] [Google Scholar]
- 5.Owsley C, Jackson GR, White M, Feist R, Edwards D. Delays in rod-mediated dark adaptation in early age-related maculopathy. Ophthalmology. 2001;108(7):1196–1202. doi: 10.1016/s0161-6420(01)00580-2. [DOI] [PubMed] [Google Scholar]
- 6.Owsley C, McGwin G, Jr, Clark ME, et al. Delayed Rod-Mediated Dark Adaptation Is a Functional Biomarker for Incident Early Age-Related Macular Degeneration. Ophthalmology. 2016;123(2):344–351. doi: 10.1016/j.ophtha.2015.09.041. [DOI] [PMC free article] [PubMed] [Google Scholar]
- 7.Ferris FL, 3rd, Wilkinson CP, Bird A, et al. Clinical classification of age-related macular degeneration. Ophthalmology. 2013;120(4):844–851. doi: 10.1016/j.ophtha.2012.10.036. [DOI] [PubMed] [Google Scholar]
- 8.Beck RW, Moke PS, Turpin AH, et al. A computerized method of visual acuity testing: adaptation of the early treatment of diabetic retinopathy study testing protocol. Am J Ophthalmol. 2003;135(2):194–205. doi: 10.1016/s0002-9394(02)01825-1. [DOI] [PubMed] [Google Scholar]
- 9.Jackson GR, Clark ME, Scott IU, Walter LE, Quillen DA, Brigell MG. Twelve-month natural history of dark adaptation in patients with AMD. Optom Vis Sci. 2014;91(8):925–931. doi: 10.1097/OPX.0000000000000247. [DOI] [PubMed] [Google Scholar]
- 10.Jackson GR, Edwards JG. A short-duration dark adaptation protocol for assessment of age-related maculopathy. J Ocul Biol Dis Infor. 2008;1(1):7–11. doi: 10.1007/s12177-008-9002-6. [DOI] [PMC free article] [PubMed] [Google Scholar]
- 11.Jackson GR, Scott IU, Kim IK, Quillen DA, Iannaccone A, Edwards JG. Diagnostic sensitivity and specificity of dark adaptometry for detection of age-related macular degeneration. Invest Ophthalmol Vis Sci. 2014;55(3):1427–1431. doi: 10.1167/iovs.13-13745. [DOI] [PMC free article] [PubMed] [Google Scholar]
- 12.Lamb TD, Pugh EN., Jr Dark adaptation and the retinoid cycle of vision. Prog Retin Eye Res. 2004;23(3):307–380. doi: 10.1016/j.preteyeres.2004.03.001. [DOI] [PubMed] [Google Scholar]
- 13.Spaide RF, Curcio CA. Anatomical correlates to the bands seen in the outer retina by optical coherence tomography: literature review and model. Retina. 2011;31(8):1609–1619. doi: 10.1097/IAE.0b013e3182247535. [DOI] [PMC free article] [PubMed] [Google Scholar]
- 14.Chiu SJ, Izatt JA, O'Connell RV, Winter KP, Toth CA, Farsiu S. Validated automatic segmentation of AMD pathology including drusen and geographic atrophy in SD-OCT images. Invest Ophthalmol Vis Sci. 2012;53(1):53–61. doi: 10.1167/iovs.11-7640. [DOI] [PubMed] [Google Scholar]
- 15.Chiu SJ, Li XT, Nicholas P, Toth CA, Izatt JA, Farsiu S. Automatic segmentation of seven retinal layers in SDOCT images congruent with expert manual segmentation. Opt Express. 2010;18(18):19413–19428. doi: 10.1364/OE.18.019413. [DOI] [PMC free article] [PubMed] [Google Scholar]
- 16.Farsiu S, Chiu SJ, O'Connell RV, et al. Quantitative classification of eyes with and without intermediate age-related macular degeneration using optical coherence tomography. Ophthalmology. 2014;121(1):162–172. doi: 10.1016/j.ophtha.2013.07.013. [DOI] [PMC free article] [PubMed] [Google Scholar]
- 17.Folgar FA, Yuan EL, Sevilla MB, et al. Drusen Volume and Retinal Pigment Epithelium Abnormal Thinning Volume Predict 2-Year Progression of Age-Related Macular Degeneration. Ophthalmology. 2016;123(1):39–50. e31. doi: 10.1016/j.ophtha.2015.09.016. [DOI] [PubMed] [Google Scholar]
- 18.Sadigh S, Cideciyan AV, Sumaroka A, et al. Abnormal thickening as well as thinning of the photoreceptor layer in intermediate age-related macular degeneration. Invest Ophthalmol Vis Sci. 2013;54(3):1603–1612. doi: 10.1167/iovs.12-11286. [DOI] [PubMed] [Google Scholar]
- 19.Wu Z, Ayton LN, Luu CD, Guymer RH. Relationship between retinal microstructures on optical coherence tomography and microperimetry in age-related macular degeneration. Ophthalmology. 2014;121(7):1445–1452. doi: 10.1016/j.ophtha.2014.01.025. [DOI] [PubMed] [Google Scholar]
- 20.Schuman SG, Koreishi AF, Farsiu S, Jung SH, Izatt JA, Toth CA. Photoreceptor layer thinning over drusen in eyes with age-related macular degeneration imaged in vivo with spectral-domain optical coherence tomography. Ophthalmology. 2009;116(3):488–496. e482. doi: 10.1016/j.ophtha.2008.10.006. [DOI] [PMC free article] [PubMed] [Google Scholar]
- 21.Curcio CA, Medeiros NE, Millican CL. Photoreceptor loss in age-related macular degeneration. Invest Ophthalmol Vis Sci. 1996;37(7):1236–1249. [PubMed] [Google Scholar]
- 22.Sarks JP, Sarks SH, Killingsworth MC. Evolution of geographic atrophy of the retinal pigment epithelium. Eye (Lond) 1988;2(Pt 5):552–577. doi: 10.1038/eye.1988.106. [DOI] [PubMed] [Google Scholar]
- 23.Sarks SH. Ageing and degeneration in the macular region: a clinico-pathological study. Br J Ophthalmol. 1976;60(5):324–341. doi: 10.1136/bjo.60.5.324. [DOI] [PMC free article] [PubMed] [Google Scholar]
- 24.Curcio CA, Johnson M, Rudolf M, Huang JD. The oil spill in ageing Bruch membrane. Br J Ophthalmol. 2011;95(12):1638–1645. doi: 10.1136/bjophthalmol-2011-300344. [DOI] [PMC free article] [PubMed] [Google Scholar]
- 25.Owsley C, McGwin G, Jackson GR, et al. Effect of short-term, high-dose retinol on dark adaptation in aging and early age-related maculopathy. Invest Ophthalmol Vis Sci. 2006;47(4):1310–1318. doi: 10.1167/iovs.05-1292. [DOI] [PubMed] [Google Scholar]
- 26.Zhang QX, Lu RW, Messinger JD, Curcio CA, Guarcello V, Yao XC. In vivo optical coherence tomography of light-driven melanosome translocation in retinal pigment epithelium. Sci Rep. 2013;3:2644. doi: 10.1038/srep02644. [DOI] [PMC free article] [PubMed] [Google Scholar]
- 27.Bonilha VL, Bhattacharya SK, West KA, et al. Support for a proposed retinoid-processing protein complex in apical retinal pigment epithelium. Exp Eye Res. 2004;79(3):419–422. doi: 10.1016/j.exer.2004.04.001. [DOI] [PubMed] [Google Scholar]
- 28.Fleckenstein M, Schmitz-Valckenberg S, Adrion C, et al. Tracking progression with spectral-domain optical coherence tomography in geographic atrophy caused by age-related macular degeneration. Invest Ophthalmol Vis Sci. 2010;51(8):3846–3852. doi: 10.1167/iovs.09-4533. [DOI] [PubMed] [Google Scholar]
- 29.Mitamura Y, Mitamura-Aizawa S, Katome T, et al. Photoreceptor impairment and restoration on optical coherence tomographic image. J Ophthalmol. 2013;2013:518170. doi: 10.1155/2013/518170. [DOI] [PMC free article] [PubMed] [Google Scholar]
- 30.Switzer DW, Jr, Mendonca LS, Saito M, Zweifel SA, Spaide RF. Segregation of ophthalmoscopic characteristics according to choroidal thickness in patients with early age-related macular degeneration. Retina. 2012;32(7):1265–1271. doi: 10.1097/IAE.0b013e31824453ac. [DOI] [PubMed] [Google Scholar]
- 31.Wolf-Schnurrbusch UE, Enzmann V, Brinkmann CK, Wolf S. Morphologic changes in patients with geographic atrophy assessed with a novel spectral OCT-SLO combination. Invest Ophthalmol Vis Sci. 2008;49(7):3095–3099. doi: 10.1167/iovs.07-1460. [DOI] [PubMed] [Google Scholar]
- 32.Ross DH, Clark ME, Godara P, et al. RefMoB, a Reflectivity Feature Model-Based Automated Method for Measuring Four Outer Retinal Hyperreflective Bands in Optical Coherence Tomography. Invest Ophthalmol Vis Sci. 2015;56(8):4166–4176. doi: 10.1167/iovs.14-15256. [DOI] [PMC free article] [PubMed] [Google Scholar]
- 33.Bressler SB, Bressler NM, Sarks SH, Sarks JP. Age-related macular degeneration: nonneovascular early AMD, intermediate AMD, geographic atrophy. In: Ryan SJ, editor. Retina. Fourth. St Louis: Mosby; 2006. pp. 1041–1074. [Google Scholar]
- 34.Curcio CA, Messinger JD, Sloan KR, McGwin G, Medeiros NE, Spaide RF. Subretinal drusenoid deposits in non-neovascular age-related macular degeneration: morphology, prevalence, topography, and biogenesis model. Retina. 2013;33(2):265–276. doi: 10.1097/IAE.0b013e31827e25e0. [DOI] [PMC free article] [PubMed] [Google Scholar]
- 35.Curcio CA, Owsley C, Jackson GR. Spare the rods, save the cones in aging and age-related maculopathy. Invest Ophthalmol Vis Sci. 2000;41(8):2015–2018. [PubMed] [Google Scholar]
- 36.Jackson GR, Owsley C, Curcio CA. Photoreceptor degeneration and dysfunction in aging and age-related maculopathy. Ageing Res Rev. 2002;1(3):381–396. doi: 10.1016/s1568-1637(02)00007-7. [DOI] [PubMed] [Google Scholar]
- 37.Smith RT, Sohrab MA, Pumariega N, et al. Dynamic soft drusen remodelling in age-related macular degeneration. Br J Ophthalmol. 2010;94(12):1618–1623. doi: 10.1136/bjo.2009.166843. [DOI] [PMC free article] [PubMed] [Google Scholar]
- 38.Finger RP, Wu Z, Luu CD, et al. Reticular pseudodrusen: a risk factor for geographic atrophy in fellow eyes of individuals with unilateral choroidal neovascularization. Ophthalmology. 2014;121(6):1252–1256. doi: 10.1016/j.ophtha.2013.12.034. [DOI] [PMC free article] [PubMed] [Google Scholar]
- 39.Xu L, Blonska AM, Pumariega NM, et al. Reticular macular disease is associated with multilobular geographic atrophy in age-related macular degeneration. Retina. 2013;33(9):1850–1862. doi: 10.1097/IAE.0b013e31828991b2. [DOI] [PMC free article] [PubMed] [Google Scholar]
- 40.Zhao C, Yasumura D, Li X, et al. mTOR-mediated dedifferentiation of the retinal pigment epithelium initiates photoreceptor degeneration in mice. J Clin Invest. 2011;121(1):369–383. doi: 10.1172/JCI44303. [DOI] [PMC free article] [PubMed] [Google Scholar]
Associated Data
This section collects any data citations, data availability statements, or supplementary materials included in this article.


