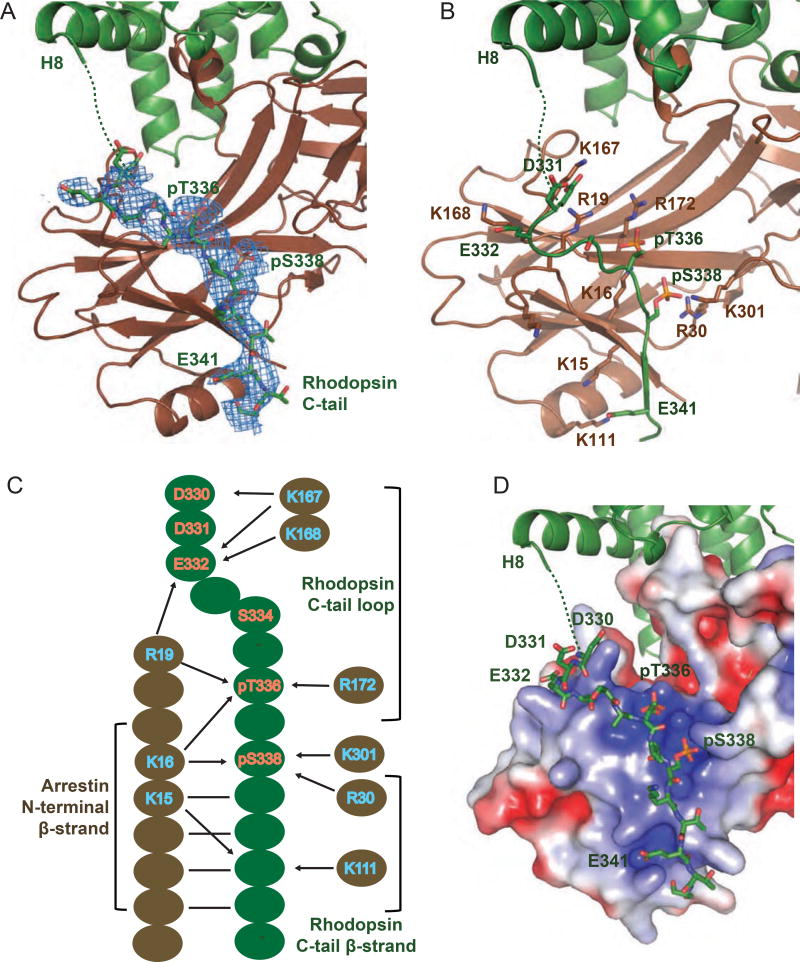
Figure 2.
Interface between rhodopsin C-terminal tail and arrestin N-terminal domain. See also Figures S1–2 and Table S3.
(A) The interface between rhodopsin C-tail and arrestin N-terminal domain with the rhodopsin C-tail covered with a 2mFo-DFc density map contoured at 1 σ. Rhodopsin is in green, and arrestin in brown. (B) Interface residues between rhodopsin C-tail and arrestin N-terminal domain, with rhodopsin residues colored green and arrestin residues brown. (C) A schematic diagram of the interactions between rhodopsin C-tail residues (green) and arrestin residues (brown). Solid lines and arrows indicate hydrogen bonds and salt bridges, respectively. (D) Charge-distribution surface of the arrestin N-terminal domain in the rhodopsin-arrestin complex with an electrostatic scale from −3 to +3 eV corresponding to red to blue colors. Labeled are the rhodopsin C-tail residues involved in the charge interaction network.

