

Uniparental disomy (UPD), in which an individual harbors a pair of homologous chromosomes originating from only one parent, is a frequent phenomenon linked to congenital disorders and to various cancers1,2. UPD is believed to result mostly from pre- or post-zygotic chromosome missegregation2. However, the factors that drive UPD remain unclear. Here we utilize the fission yeast Schizosaccharomyces pombe as a model to investigate UPD, and find that defects in RNAi machinery or in the YTH domain-containing RNA elimination factor Mmi1 cause a high incidence of UPD in vegetative diploid cells. This phenomenon is not due to defects in heterochromatin assembly at centromeres. Strikingly, we find that in cells lacking RNAi components or Mmi1, UPD is associated with the untimely expression of gametogenic genes. Deletion of the upregulated gene encoding the meiotic cohesin Rec8 or the cyclin Crs1 suppresses UPD in both RNAi and mmi1 mutants. Moreover, overexpression of Rec8 is sufficient to trigger UPD in wild type cells. Notably, Rec8 expressed in vegetative cells localizes to chromosomal arms and to the centromere core, where it is required for localization of the cohesin subunit Psc3. The centromeric localization of Rec8 and Psc3 promotes UPD by uniquely affecting chromosome segregation, causing a reductional segregation of one homolog. Our work is the first to identify untimely vegetative expression of gametogenic genes as a causative factor of UPD, and provides a solid foundation for understanding this phenomenon that is linked to diverse human diseases.
The genetic tractability and small karyotype of S. pombe provide an outstanding model for studying chromosome segregation. The three S. pombe chromosomes contain discrete blocks of facultative heterochromatin as well as constitutive heterochromatin domains such as at centromeres and telomeres3,4. RNAi–dependent and –independent mechanisms control gene expression and direct heterochromatin assembly. Heterochromatin HP1 proteins bound to methylated histone H3 lysine-9 (H3K9me) recruit effectors involved in gene silencing and proper chromosome segregation3. Indeed, cells lacking Clr4/Suv39h, HP1 or RNAi machinery show lagging chromosomes resulting from defects in heterochromatin-dependent cohesin localization at centromeres5–7.
Intriguingly, RNAi mutants also exhibit a distinct chromosome segregation defect. We found that RNAi mutant diploids consistently display asymmetric segregation of alleles, such that otherwise heterozygous diploids become homozygous for genetic markers mapping to one of the chromosomes, thus resulting in loss of heterozygosity (LOH)7. To further investigate this phenotype, we designed an assay to quantitatively measure LOH. Heterozygous diploids carrying markers distributed on different chromosomes were constructed by mating wild type (WT) or mutant haploid strains (Fig. 1a, b). Diploids maintained by selecting for markers on one chromosome were scored for LOH of markers on another chromosome (see Methods). Using our assay, we observed higher levels of LOH for the pericentromeric lys1 locus in diploids lacking RNAi components Dicer (dcr1), Argonaute (ago1) or the RNA-directed RNA polymerase (rdp1) as compared to WT (Fig. 1c). To further confirm LOH, we sporulated diploids and performed tetrad analysis and random spore analysis (Fig. 1d, right; Extended Data Fig. 1a, b). We also monitored the lys1 locus, which was tagged with lacO arrays labeled with LacI-GFP, through live cell imaging (Fig. 1d, left). Diploids lacking RNAi machinery frequently yielded asymmetric 4:0 or 0:4 segregation of genetic markers instead of the expected 2:2 segregation (Fig. 1d; Extended Data Fig. 1b), which is indicative of LOH occurring during the growth of diploid cells. Together, these results show a high incidence of LOH in RNAi mutant diploids.
Figure 1. Defective RNAi machinery triggers UPD.

a, b, Diagrams of LOH and UPD assays. Haploid S. pombe cells containing three chromosomes were mated to construct heterozygous diploids, which were assayed for homozygosis of individual chromosomes. Examples of homozygosis of ChrI or ChrIII are highlighted in yellow (a). Schematic showing markers used to assay LOH (b). Diploids maintained by selecting for ade6-210 and ade6-216 on ChrIII (i.e. ade+ phenotype resulting from interallelic complementation) were assayed for homozygosis of the lys1 locus on ChrI. c, LOH quantification. Each filled red circle represents the LOH frequency, calculated using the indicated formula, of an independent starting heterozygous diploid. d, LOH confirmation by live cell imaging and tetrad analysis. Left, distribution of lys1 decorated with lacO-GFP arrays in four spores of an ascus formed by either the heterozygous dcr1∆ diploid (AB, carrying ChrI alleles from both parents) or its homozygosed progeny (AA, carrying ChrI alleles only from parent A). Right, tetrad dissection of a ChrI homozygosed (AA) dcr1∆ diploid. Note the asymmetric (4:0/0:4) segregation of genetic markers mapping to ChrI, in contrast to the (2:2) segregations of ChrII and ChrIII. e, Schematic showing markers used to assay UPD. Diploids maintained by selecting for lys1+ and NATR markers on ChrI were scored for ChrIII UPD. Note homozygosis of markers on both arms of ChrIII for AA and BB. f, Quantification of UPD using assay A. UPD frequencies were calculated using the indicated formula. For c and f, >100 colonies were scored for each diploid. Bars and error bars denote mean and SD, respectively. ***P<0.001; ****P<0.0001 (Mann-Whitney U test)
We wondered whether the LOH phenotype resulted from UPD, in which an entire chromosome becomes homozygosed, presumably due to missegregation. To test this, we developed a quantitative assay based on visual scoring of colony color and monitoring of genetic markers (Fig. 1e and Extended Data Fig. 1c). This assay revealed UPD events in dcr1∆ since markers on both arms of chromosome III (ChrIII) were homozygosed (Fig. 1e). Our quantitative analysis confirmed significantly higher UPD frequencies in dcr1∆ than in WT (Fig. 1f). Moreover, we found that UPD can occur with either of the homologs, which we further confirmed by tetrad analysis (Extended Data Fig. 2a, b). The ability of diploids to undergo meiosis and sporulation was not critical for UPD, because non-sporulating dcr1∆ diploids obtained by either mating or protoplast fusion displayed higher frequencies of UPD than their WT counterpart (Extended Data Fig. 2c, d). These analyses show that defects in RNAi result in high levels of UPD.
Since RNAi is required for centromeric heterochromatin assembly, we wondered whether UPD is caused by defects in heterochromatin-dependent loading of cohesin at pericentromeric regions5,6,8. The loss of heterochromatin assembly factor Clr4 abolishes cohesin localization at centromeres (Extended Data Fig. 3a, b)9, but caused only a minor increase in LOH and UPD as compared to RNAi mutants (Fig. 1c, f). By contrast, dcr1∆ showed only a partial defect in cohesin localization at centromeres, but exhibited high levels of UPD (Fig. 1f and Extended Data Fig. 3a, b). Cells lacking Dcr1 showed no major changes in cohesin localization at other heterochromatic loci including telomeres (Extended Data Fig. 3c), and cohesin distribution on chromosomal arms was comparable between dcr1∆ and WT (Extended Data Fig. 3d). These results indicate that additional factors other than defects in heterochromatin-dependent cohesin loading at centromeres must be responsible for the UPD in RNAi mutants.
Independently of heterochromatin assembly, RNAi silences meiotic genes during vegetative growth10,11. The untimely expression of gametogenic genes, which has been found to occur in tumors in humans12,13 and to induce tumorigenesis in Drosophila14, might be linked to aneuploidy observed in cancer cells. However, the link between chromosome segregation defects and misregulation of gametogenic genes, including meiotic genes, has not been directly tested. To explore this scenario, we performed RNA-Seq analysis of RNAi mutants. Interestingly, among the loci upregulated in dcr1∆ and ago1∆, we found a preferential enrichment of meiotic genes (Fig. 2a), supporting the possibility that meiotic gene misregulation may underlie the UPD observed in RNAi mutants.
Figure 2. Untimely expression of gametogenic genes triggers UPD.

a, b, Gene expression analysis of RNA-Seq data. The mmi1∆ strain carries a previously described truncated non-functional allele of mei44, required to rescue the lethality observed upon the loss of Mmi115. For each mutant, the set of genes enriched greater than two-fold was compared to previously annotated meiotic genes (a). The overlap is represented by an area proportional Euler Venn diagram (b). The statistical significance of the overlap between the groups was assessed using the cumulative hypergeometric distribution test. c, Examples of mmi1∆ diploids exhibiting UPD. Diploids maintained by selecting for his2+ and ura4+ markers on ChrII were used to assay for UPD of ChrIII. Haploid parental and heterozygous diploid controls are shown. Note that the genetic markers on both arms of ChrIII were homozygosed. d, Distribution of resulting UPD diploids (AA and BB) for each starting mmi1∆ heterozygous diploid. e, f, Quantification of UPD in the indicated diploid strains using assay C (e) and A (f) (see Extended Data Fig. 1c). Each filled red circle represents the UPD frequency of an independent starting heterozygous diploid. >100 colonies were scored for each diploid. Bars and error bars denote mean values and SD, respectively. ***P<0.001; ****P<0.0001 (Mann-Whitney U test).
To explore this potential connection, we first tested whether well-characterized mutants known to exhibit untimely expression of meiotic genes during vegetative growth also display UPD. The YTH-family protein Mmi1 promotes degradation of meiotic gene transcripts by RNAi and the nuclear exosome10,11,15–18. Comparing the expression profiles of cells lacking RNAi components or Mmi1 revealed that a majority of the meiotic genes that were upregulated in ago1∆ or dcr1∆ RNAi mutants (85 out of 152) were also upregulated in mmi1∆ (Fig. 2b). We then asked whether loss of Mmi1 induces UPD, in a manner similar to RNAi mutants. Remarkably, we detected significantly higher UPD in mmi1∆ and mmi1-ts mutants than in WT diploids (Fig. 2c-f). These results reveal that mmi1 mutant cells, which show the untimely expression of gametogenic genes, phenocopy the high levels of UPD in RNAi mutants.
We next sought to identify factors responsible for UPD in mmi1∆ and RNAi mutants. Unlike RNAi mutants, cells lacking Mmi1 are not defective in centromeric heterochromatin assembly, but still show a high frequency of UPD and chromosome segregation defects such as minichromosome loss and sensitivity to spindle-poison drug thiabendazole (TBZ) (Fig. 3a and Extended Data Fig. 4). Therefore, we used mmi1∆ to specifically test the role of candidate factors in UPD without the caveats associated with defects in heterochromatin assembly at centromeres. We assembled a group of 27 candidate factors consisting of gametogenic genes, most of which are required for proper meiotic chromosome segregation and are upregulated in both mmi1∆ and RNAi mutants (Supplementary Table 1). Deletions of candidate genes were combined with mmi1∆ to assess the effect on chromosome segregation. Remarkably, among all of the tested candidate genes, only the deletion of rec8, which encodes meiotic cohesin19, or crs1, a meiosis-specific cyclin gene20, suppressed TBZ sensitivity and resulted in stable propagation of a minichromosome in mmi1∆ (Fig. 3b). Loss of either of these factors also suppressed UPD in mmi1∆ (Fig. 3c). Furthermore, rec8∆, and crs1∆ albeit to a lesser extent, suppressed UPD in dcr1∆ (Fig. 3d). Together, these results suggest that Rec8 and Crs1 contribute to UPD in both mmi1∆ and RNAi mutants.
Figure 3. Deletion of the meiotic gene encoding Rec8 or Crs1 suppresses UPD in cells lacking Mmi1 or RNAi machinery.

a, The minichromosome (Ch16) maintenance assay was performed in the indicated strains. clr4∆ is included as a control. Cells carrying the minichromosome become ade6+ by hetero-allelic complementation, and generate white colonies on adenine-limiting YE medium. Cells become ade6− upon minichromosome loss and generate red or sectored colonies (see Methods). >400 colonies were scored per strain. b, Examples of genes tested for suppression of pNBg minichromosome loss in mmi1∆. Dilution assays of the indicated strains grown for 3 days on the indicated rich media at 33°C. Stable maintenance of pNBg generates white colonies, while loss of pNBg results in red colonies. c, d, Quantification of UPD in the indicated diploids using assay C (c) or A (d) (see Extended Data Fig. 1c). The data for mei4 and mei4 mmi1∆ as well as data for WT and dcr1∆ were replotted from Fig. 2e and 1f, respectively. Each filled red circle represents the UPD frequency of an independent starting heterozygous diploid. Bars and error bars denote mean values and SD, respectively. **P<0.01; ****P<0.0001 (Mann-Whitney U test). e, f, Rec8 is overexpressed in mmi1∆ and RNAi mutants. Protein extracts from strains expressing GFP-tagged Rec8 were immunoblotted using GFP antibody. Cdc2 was monitored as a loading control. For gel source data, see Supplementary Figure 1.
To establish whether upregulation of rec8 resulted in increased protein expression, we determined Rec8 protein levels in mmi1∆ and RNAi mutant cells. As expected, Rec8 was barely detectable in WT (Fig. 3e, f). However, the loss of Mmi1 or RNAi factors (Ago1 or Dcr1) caused a major increase in Rec8 levels as compared to WT (Fig. 3e, f). Therefore, derepression of rec8 in mmi1∆ and RNAi mutants correlates with the elevated level of UPD that we observed.
We wondered whether Rec8 expression in vegetative cells promotes UPD by causing aberrant cohesin distribution. In vegetative cells, mitotic cohesin containing Rad21 and Psc3 is preferentially enriched across heterochromatin domains including at centromeres, and shows distinct peaks at specific sites on chromosomal arms5,6,9,21. As cells enter meiosis, Rec8-Rec11 replaces Rad21-Psc3 on arms, while Rec8 partners with Psc3 at centromeres22,23. Interestingly, we found that Rec8 and its interaction partner Rec11 were loaded onto chromosomal arms in mmi1∆ cells, at sites normally occupied by mitotic cohesin (Extended Data Fig. 5), and their localization correlated with a proportional decrease in both Rad21 and Psc3 at these sites (Extended Data Fig. 6 and 7). As in meiotic cells22, Rec11 was not detected at centromeres in mmi1∆ cells (Extended Data Fig. 5b, e). In contrast, Rec8 and Psc3 showed abnormal localization at centromeres and were highly enriched, particularly at the central core (Fig. 4a-c; Extended Data Fig. 5c and 6d), which is the site of kinetochore assembly3,24. This aberrant localization of Psc3 at the central core in vegetative cells requires Rec8, as Psc3 was not enriched at the central core in mmi1∆ rec8∆ cells (Fig. 4b, c). Taken together, our results reveal a composite pattern of cohesin distribution in mmi1∆ that shares features of both mitotic and meiotic cohesin localization at centromeres and chromosomal arms.
Figure 4. Rec8 associated with Psc3 at centromeres drives UPD.

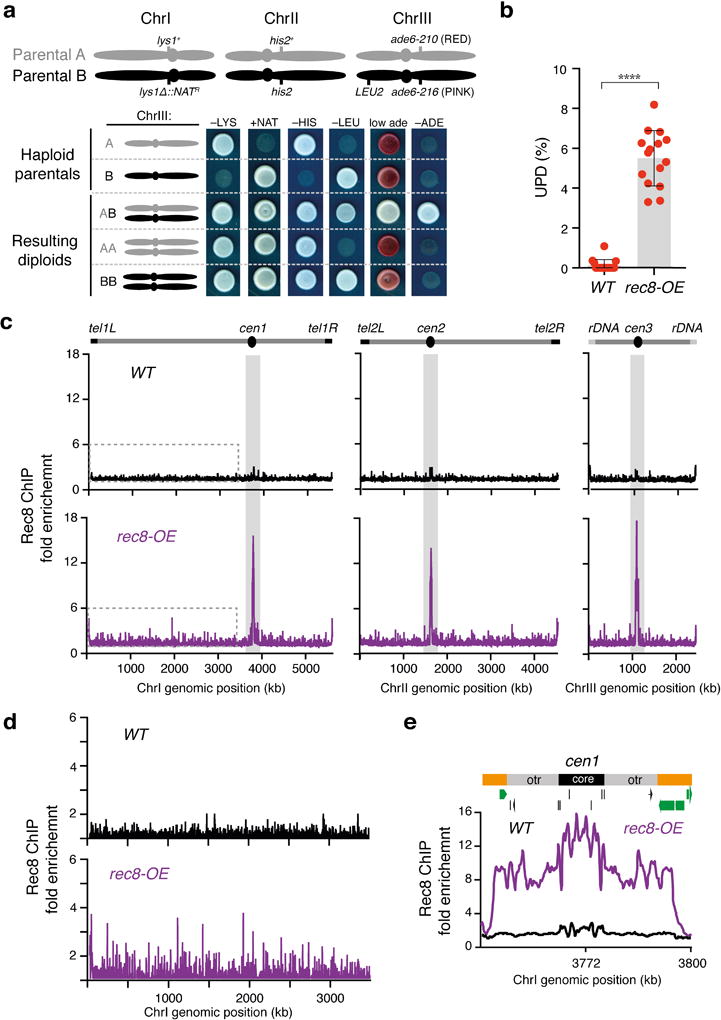
a, Rec8 enrichment at cen1 as determined by ChIP-chip is plotted. Central core (core) and pericentromeric repeats (otr) that are coated with heterochromatin (hetero) are indicated. b, c, Psc3 enrichments at cen1 as determined by ChIP-chip (b) and ChIP-qPCR (c). Note the abnormally high enrichment of Psc3 at the central core in mmi1∆ (blue arrow). d, Quantification of UPD in the indicated diploid strains using assay C. mei4 and mei4 mmi1∆ data were replotted from Fig. 2e. Bars and error bars denote mean values and SD, respectively. ****P<0.0001 (Mann-Whitney U test). e, Rec8-GFP expression, conducted as in Fig. 3 e, f, in the rec8 overexpressing (rec8-OE) strains. f, g, Quantification of UPD frequency (f) and rate (g) in the indicated diploid strains using assay B (see Methods). Bars and error bars denote mean values and SD, respectively. ***P<0.001 (Mann-Whitney U test). h, Rec8 and Psc3 enrichments at cen1 in the indicated strains were determined by ChIP-qPCR. i, Quantification of ChrII segregation in the indicated diploids. Each cen2 is marked with either lacO or tetO arrays labeled with lacI-GFP (cen2-GFP) or tetR-Tomato (cen2-Tomato), respectively. n=89 (WT), n=179 (rec8-OE).
We then asked whether it is Rec8 and its interaction partner Rec11 on chromosomal arms, and/or Rec8 and Psc3 at centromeres, that drive UPD in mmi1∆ cells. To address this, we combined mmi1∆ with rec11∆ or a temperature sensitive psc3-ts mutant that displayed reduced Psc3 at centromeres (Fig. 4c). Strikingly, loss of Rec11 had no effect on UPD (Fig. 4d). In contrast, UPD was suppressed in mmi1∆ psc3-ts (Fig. 4d), similar to mmi1∆ rec8∆. These results suggest that Rec8-Psc3 localization at centromeres is a critical factor driving UPD in mmi1∆ cells.
To test the significance of Rec8 as an important contributor to UPD, we asked whether the sole overexpression of Rec8 could trigger UPD in WT diploid cells. We used a strain in which rec8 expression is driven by the constitutive adh1 promoter, leading to elevated Rec8 levels (Fig. 4e). Unlike crs1 overexpression that arrests the cell cycle20, cells overexpressing rec8 (rec8-OE) are viable, as previously observed25, but show TBZ sensitivity (Extended Data Fig. 8a). Strikingly, we observed a high level of UPD in rec8-OE cells (Fig. 4f and Extended Data Fig. 8b), indicating that expression of Rec8 alone is sufficient to trigger UPD. Indeed, the rate of UPD was ~25-fold higher in rec8-OE (Fig. 4g). Tetrad analysis of rec8-OE diploids further confirmed UPD (Extended Data Fig. 8c, d). Similar results were obtained with rec8-OE non-sporulating diploids (Extended Data Fig. 9a, b). rec8-OE cells showed Rec8 localization at centromeres, as previously reported26, and on chromosomal arms (Extended Data Fig. 9c-e). Moreover, we found that rec8-OE cells showed aberrant enrichment of Psc3 at the centromere central core (Fig. 4h). Thus, Rec8 overexpression in vegetative cells causes altered cohesin distribution, similar to the pattern observed in mmi1∆.
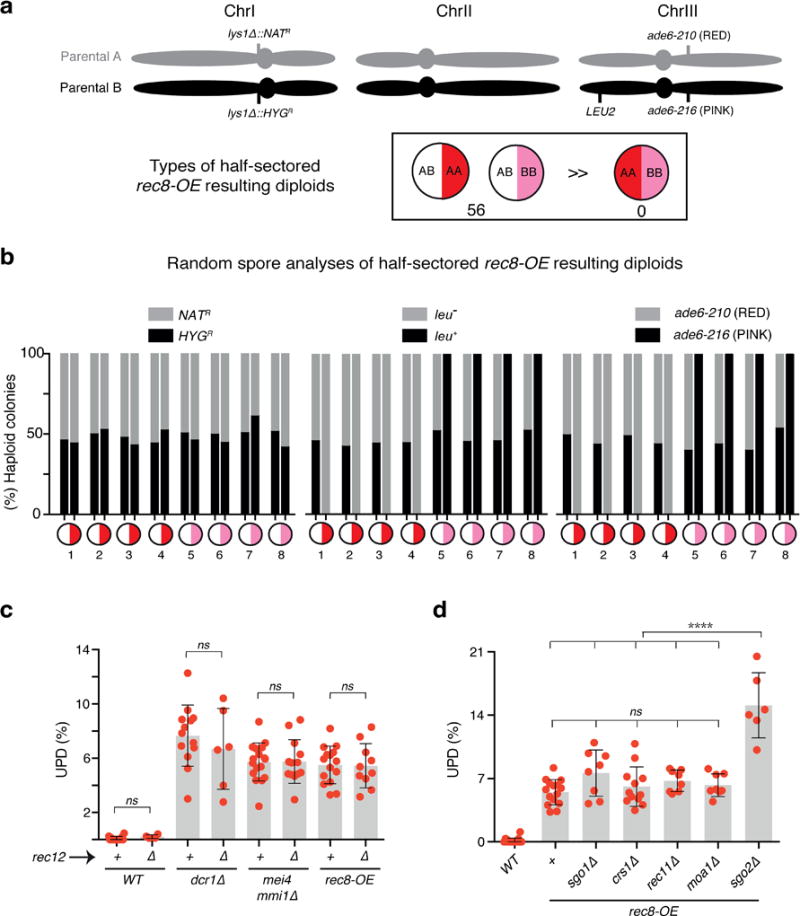
Since cohesin at the central core during meiosis is critical for cohesion and mono-orientation27, we wondered whether aberrant centromeric localization of Rec8-Psc3 in vegetative cells could promote stochastic “pseudomeiosis” events (e.g. reductional segregation of sister chromatids). To test this, we examined segregation events using two assays. In one assay, we visually monitored diploids in which cen2 of both homologs are marked: one with lacO-GFP and the other with tetO-Tomato. Additionally, we investigated UPD of both homologs of ChrIII, which each carried a distinct ade6 allele. One homolog was marked with ade6-210 (red) and the other with ade6-216 (pink), allowing segregation to be determined by scoring colony color. Coordinated UPD of both homologs would generate half-red and half-pink diploid colonies (meiosis I-like segregation), whereas half-white and half-red or pink colonies would be expected for a diploid undergoing UPD of only one homolog. Surprisingly, we found a high frequency of reductional segregation in rec8-OE, involving only one of the homologs per event in both assays (Fig. 4i; Extended Data Fig. 10a, b and Supplementary Video 1). Consistent with this result, homolog pairing and chiasmata, which are expected to be critical for reductional segregation of both homologs, seemed dispensable for UPD. Combining a deletion of the gene encoding Rec12SPO11, which abrogates double strand break formation and recombination, with either dcr1∆, mmi1∆ or rec8-OE did not suppress UPD (Extended Data Fig. 10c).
We also investigated the potential contribution of other factors associated with meiotic chromosome segregation in UPD. Shugoshin Sgo1, which prevents cleavage of centromeric Rec8 during meiosis I25, was not required for UPD in rec8-OE. While coexpression of Sgo1 and Rec8 was previously shown to induce chromosome missegregation25, we observed similar UPD frequencies in both rec8-OE and rec8-OE sgo1∆ (Extended Data Fig. 10d). Furthermore, we observed no effect on UPD in rec8-OE upon the loss of Moa1 (Extended Data Fig. 10d), which is required for mono-orientation of kinetochores during meiosis I28. By contrast, we observed increased UPD in rec8-OE cells lacking shugoshin Sgo2 (Extended Data Fig. 10d), which recruits the chromosome passenger complex to correct erroneous microtubule-kinetochore attachments29, indicating that missegregation events contribute to UPD. Taken together, these results strongly suggest that UPD originates from stochastic, abnormal reductional events that occur during mitosis rather than from programmed meiosis I segregations.
Our results uncover a novel mechanism contributing to chromosome segregation defects in RNAi mutants, and establish an unambiguous connection between the untimely expression of gametogenic genes and UPD. Specifically, we find that meiotic cohesin Rec8 promotes UPD in mmi1∆ and RNAi mutants. Additional factors such as Crs1 also affect UPD. However, its mode of action is likely distinct because Crs1 is not required for UPD caused by Rec8 expression (Extended Data Fig. 10d). In vegetative cells expressing Rec8, the aberrant localization of meiotic cohesin at the centromere core may promote mono-orientation of sister kinetochores or alternatively, Rec8-Psc3 could be inefficiently cleaved, thus triggering a stochastic reductional segregation of an individual homolog. Regardless of the exact mechanism, our findings have important implications for understanding UPD in humans, wherein constitutive and acquired UPD have been linked to various cancers2. The expression of germline genes, including some with roles in meiosis, is associated with cancer in somatic cells12, and we envision that aberrant activation of the meiotic program might induce UPD and cause aneuploidy in these cells. Finally, our results may advance the application of UPD as a “chromosome therapy” tool to correct chromosomal aberrations30, and lay the groundwork for further detailed study of this important phenomenon.
METHODS
Yeast strains and methods
Standard procedures were used for fission yeast cell culture and genetic manipulations31. S. pombe strains used in this study are listed in Supplementary Table 2. Strains bearing Rec8-GFP or Psc3-GFP were gifts from Y. Watanabe (University of Tokyo, Japan). Deletion strains for the genes summarized in Supplementary Table 1 were obtained from the Bioneer haploid deletion library version 4.0. The following arrays, gene fusions and mutant alleles were previously described: lacO at pericentromeric regions lys1 and cen2-D107 and lacI-GFP at his7 loci32, tetO at cen2 and tetR-Tomato adjacent to zfs1 (Z locus)27, Padh1-rec8+-3HA and Padh1-rec8+-GFP25, mei4∆C<NAT4, and rec12∆33. Deletion of mmi1 was performed in cells carrying a previously described truncated non-functional mei4 (mei4∆C<NAT) allele4 to alleviate growth defects caused by derepression of mei4 in mitotic cells15.
Construction of the HA-rec8 strain
HA tagging at the N-terminus of rec8 was performed by the pop-in/pop-out approach34. Briefly, the rec8 fragment (-496 to 509) was cloned into the EcoRI site of pST650, pBluescript SK(-) containing the ura4+ marker gene at its NaeI site35, and then the 3×HA tag was introduced by a PCR-based method. mmi1∆ cells were transformed with the resultant plasmid, pST650-3×HA-rec8, and transformants were selected on minimal media lacking uracil. After confirmation of the proper integration of the plasmid to the rec8+ locus, the transformants were subjected to Western blot analysis to test the 3×HA-Rec8 expression. Positive clones that expressed 3×HA-Rec8 were grown in rich media and then plated on counter-selective medium containing 5-FOA to select for cells in which the ura4+-containing plasmid had popped out, and clones retaining the 3×HA tag sequence were isolated. One of the 3×HA-rec8 mmi1∆ strains was crossed with a wild-type strain, and 3×HA-rec8 strains with or without mmi1+ were obtained. These strains were further tested by Western blotting to confirm 3×HA-Rec8 expression.
Minichromosome maintenance assays
Minichromosomes Ch16 and pNBg were previously described36,37. Briefly, the large linear Ch16 minichromosome (530 kb) contains the entire centromere 3 and harbors an ade6-M216 allele that complements the ade6-M210 allele in the host strain to yield an ade6+ phenotype. By contrast, the small circular pNBg minichromosome (27 kb) plasmid carries ura4+ and the opal suppressor tRNA sup3-5 selection systems. Cells without ura4+ cannot grow on –URA plates, while sup3-5 suppresses a premature stop in the chromosomal ade6-704 mutation, allowing growth on –ADE plates. For the experiments shown in Fig. 3, cells harboring Ch16 or pNBg were grown on PMG –ADE or PMG –URA –ADE, respectively, and subsequently plated on YE low adenine medium. Cells harboring minichromosomes generate white colonies whereas minichromosome loss results in red or sectored colonies. Screening for genes (Supplementary Table 1) that suppress minichromosome loss in mmi1∆ was performed as follows: a mat1M-smt0 mei4 mmi1∆ strain containing pNBg was crossed to the h+ strain harboring the gene deletion of interest. Random spores were germinated in minimal medium (PMG –URA –ADE) selective for minichromosome retention. Then, replica plating onto appropriate media was performed to assess the potential enhanced minichromosome stability in double mutants, as denoted by white/sectored colonies instead of red colonies that are observed in the mei4 mmi1∆ control.
LOH/UPD assays
LOH and UPD assays consist of several steps that are performed at 33°C unless otherwise stated. The total duration for each assay was approximately 3 weeks.
The growth media used for each assay is noted below:
| assay | “diploidizing” | “amplifying” | “testing” |
|---|---|---|---|
| LOH | AA –ADE +NAT | AA –ADE +NAT | AA –ADE |
| UPD assay A | AA –ADE +NAT | AA –ADE +NAT | PMG –LYS +NAT +low ADE |
| UPD assay B | YEA +NAT +HYG | AA –ADE | YE +NAT +HYG |
| UPD assay C | AA –ADE | PMG –HIS –URA –ADE | PMG –HIS –URA +low ADE |
Parental strains were mated on SPAS medium at 26°C for 24h, and then streaked onto “diploidizing” medium and grown for 4–6 days (15–20 generations). Starting heterozygous diploid colonies were picked and transferred onto “amplifying” medium and grown vegetatively for 2 days (20–25 accumulated generations). Diploid cells were then plated onto “testing” medium. Single diploid colonies were counted on day 7. Alternatively, h−/h− diploids were constructed by protoplast fusion38 and isolated in PMG –ADE +sorbitol and subsequently treated as described above. For the LOH assay, diploid colonies were replica plated onto YEA +NAT for scoring the NATS fraction, and onto EMM medium at 30°C to induce sporulation. For UPD assays, UPD candidates (i.e. red and pink diploid colonies) were genotyped on appropriate media and UPD frequencies were adjusted according to validation coefficients (i.e. the fraction of candidates exhibiting the expected homozygous markers on both arms of ChrIII, Supplementary Table 3). In all assays, diploids were maintained by selecting for heterozygosis at a particular chromosome, while another chromosome was used as a reporter for homozygosis (see Fig. 1b and Extended Data Fig. 1c). >100 diploid colonies were counted per independent starting heterozygous diploid. The UPD rate per cell division was estimated by scoring the number of half-sectored colonies divided over the total number of colonies, excluding the entirely red (ade6-210) or pink (ade6-216) colonies. Live cell imaging of azygotic asci (Fig. 1d) and nonsporulating diploids (Fig. 4i and Supplementary Video 1) was performed on a DeltaVision Elite microscope (Applied Precision, GE Healthcare) with 100× 1.35 NA oil lens (Olympus).
Chromatin immunoprecipitation (ChIP)
ChIP and ChIP-chip experiments were performed as previously described39. Anti-HA (12CA5, Roche), anti-HA (16B12, BioLegend), anti-GFP (ab290, Abcam) or anti-H3K9me2 (ab1220, Abcam) antibodies were used for immunoprecipitation. Oligonucleotides used for ChIP-qPCR at central core (cc1/3), act1 and fbp1 were previously described40, whereas the following oligos were used for arm locations ChrI 1.92Mb (ACACATGAGCAAGGTGAACG and AGGAACAGGAGGATCAAGAGC), ChrII 3.50Mb (CGCATTATGCTCTTTGATCC and CAATCAAGAAATCGCTCGTG) and ChrIII 0.36Mb (TAGCTTCGGAAGGATGGAAC and TTTCGGTACGCGACACTCTC). DNA isolated from immunoprecipitated chromatin or from whole-cell extracts was labeled with Cy5/Cy3 for microarray-based ChIP-chip analyses using a custom 4×44K oligonucleotide array (Agilent).
Western blotting
The sample preparation for Western blotting was performed using an alkaline protein extraction method41. Anti-GFP (7.1 and 13.1, Roche), anti-HA (16B12, BioLegend) or anti-Cdc2 (Y100.4, Santa Cruz) antibodies were used for probing Rec8-GFP, HA-Rec8 and Cdc2, respectively.
RNA-Seq library construction and analyses
RNA-Seq library preparation, sequencing, and data analysis were performed as previously described42. Briefly, the MasterPure Yeast RNA Purification Kit (Epicentre) was used to purify RNA for the construction of the RNA-Seq library from exponentially growing cells. rRNA was removed using the Ribo-Zero rRNA Removal Magnetic Kit (Epicentre) before library construction using the ScriptSeq v2 RNA-Seq Library Preparation Kit (Epicentre). Libraries were analyzed using an Agilent 2100 BioAnalyzer and sequenced on the Illumina MiSeq platform. TopHat was used to align sequenced reads to the referenced S. pombe (ASM294v2) genome. Cufflinks was used to assemble mapped reads into the final transcriptome and to calculate Fragments Per Kilobase of transcript per Million (FPKM) mapped reads. Genes were classified as either meiotic or non-meiotic43. The Area proportional Euler Venn diagram for meiotic gene overlap was constructed using EulerAPE.
Data availability statement
The microarray and sequencing data that support the findings of this study are available at the NCBI Gene Expression Omnibus (GEO) repository under the accession number GSE77050. Uncropped blots and unprocessed data from LOH and UPD assays are provided as source data files.
Extended Data
Extended Data Figure 1. Additional validation of LOH and schematic of UPD assays.
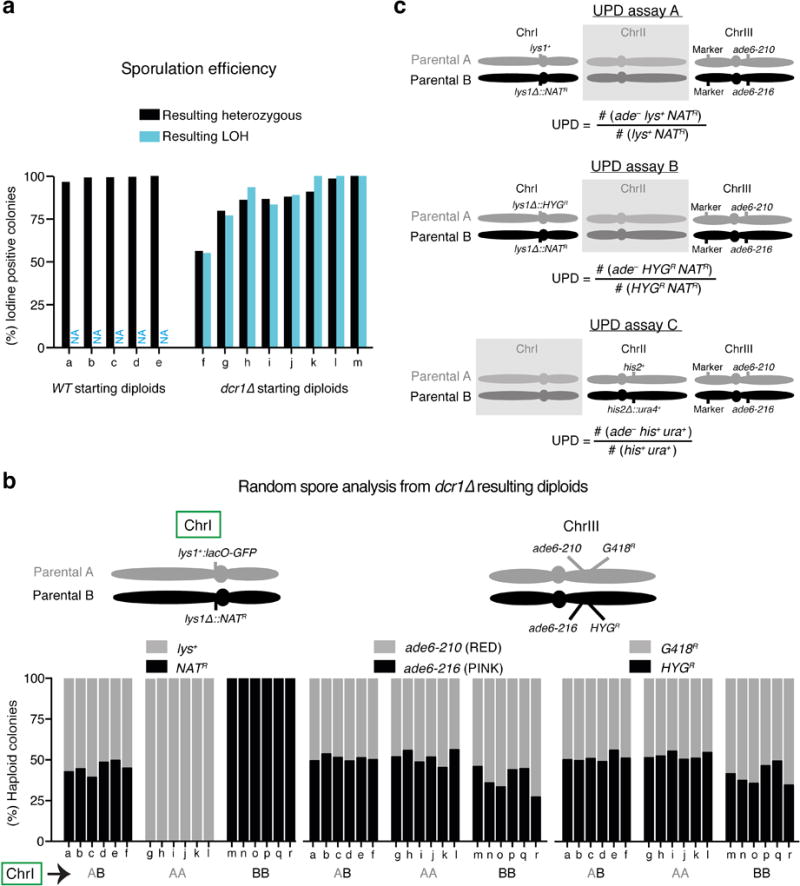
a, Sporulation efficiency of the resulting diploid colonies from LOH assays. Resulting diploid colonies from starting heterozygous diploids were scored for sporulation by iodine staining (iodine stains the starch-like compound produced by sporulating cells). Note that for each dcr1∆ diploid the fraction of iodine positive colonies is similar in both the resulting LOH and heterozygous diploid populations, indicating that meiosis efficiency is independent of LOH (resulting heterozygous diploids n>100; resulting LOH diploids n≥7). b, Resulting dcr1∆ diploids heterozygous (AB) or homozygosed for ChrI (AA and BB) were obtained from LOH assays and subjected to random spore analysis. Six diploids from each class were sporulated and plated onto rich medium for germination. Subsequently, colonies were genotyped by replica plating. Note that markers on ChrI are homozygosed in LOH diploids while markers on ChrIII show normal segregation. ≥80 haploid colonies were counted per diploid. c, Haploid parental S. pombe chromosomes showing relevant markers for UPD assays. Starting heterozygous diploids obtained by mating or fusing parental strains A and B were used to quantify UPD frequency. Diploids were maintained by selecting for heterozygosis of ChrI (assays A and B) or ChrII (assay C), while ChrIII was used as a reporter for UPD. The chromosome harboring no relevant markers for the respective assay is shaded. UPD frequencies were calculated using the indicated formula and were adjusted using the validation coefficient (i.e. the fraction of candidates exhibiting the expected homozygous markers on both arms of ChrIII; see Supplementary Table 3). Marker denotes various genetic markers at ura4 and mmi1 loci for assays A-B and C, respectively. Detailed information is provided in the Methods.
Extended Data Figure 2. Characterization and additional validation of UPD in dcr1∆ mutants.
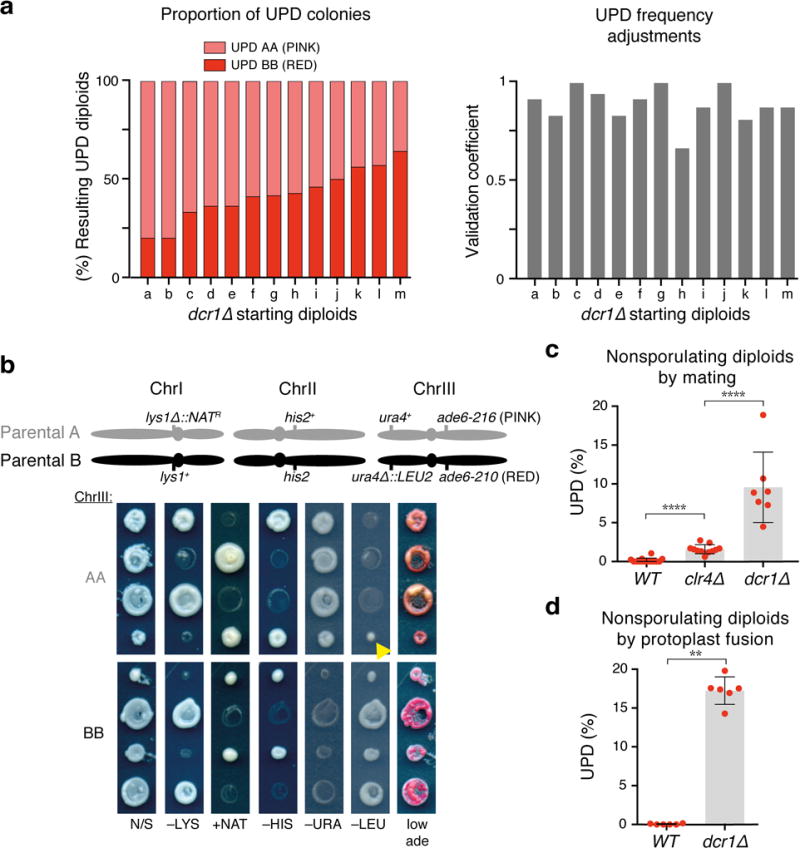
a, Left, distribution of resulting UPD diploids homozygosed for ChrIII (AA and BB) per starting heterozygous sporulating diploid. Right, validation coefficients per single starting diploid used for adjustment of UPD frequencies. ≥12 UPD candidates from each starting diploid were validated. b, Tetrad dissection analyses of dcr1∆ diploids (AA and BB) homozygosed for ChrIII, obtained from UPD assays. A schematic of the S. pombe chromosomes in the haploid parental strains A and B, indicating the location of the relevant markers, is depicted on top. N/S, non-selective media. Note the asymmetric (4:0 or 0:4) segregation at ChrIII, in contrast to the (2:2) segregation at ChrI and ChrII. The yellow arrowhead denotes dead cells carried over from the master plate during replica plating. c, d, Quantification of UPD in the indicated mat2-102/mat1M-smt0 (c) and h-/h-(d) nonsporulating diploids obtained by mating and protoplast fusion, respectively. Note that clr4∆ caused only a modest increase in UPD compared to RNAi mutants as observed in Fig. 1c, f. These results are explained by the fact that RNAi mutants show more penetrance than clr4∆ in meiotic gene misregulation. Each filled red circle represents the UPD frequency of an independent starting heterozygous diploid. >100 colonies were scored for each diploid. Bars and error bars denote mean values and SD, respectively. ** P< 0.01; **** P< 0.0001 (Mann-Whitney U test).
Extended Data Figure 3. Pericentromeric cohesin is reduced but not abolished in the dcr1∆ mutant.
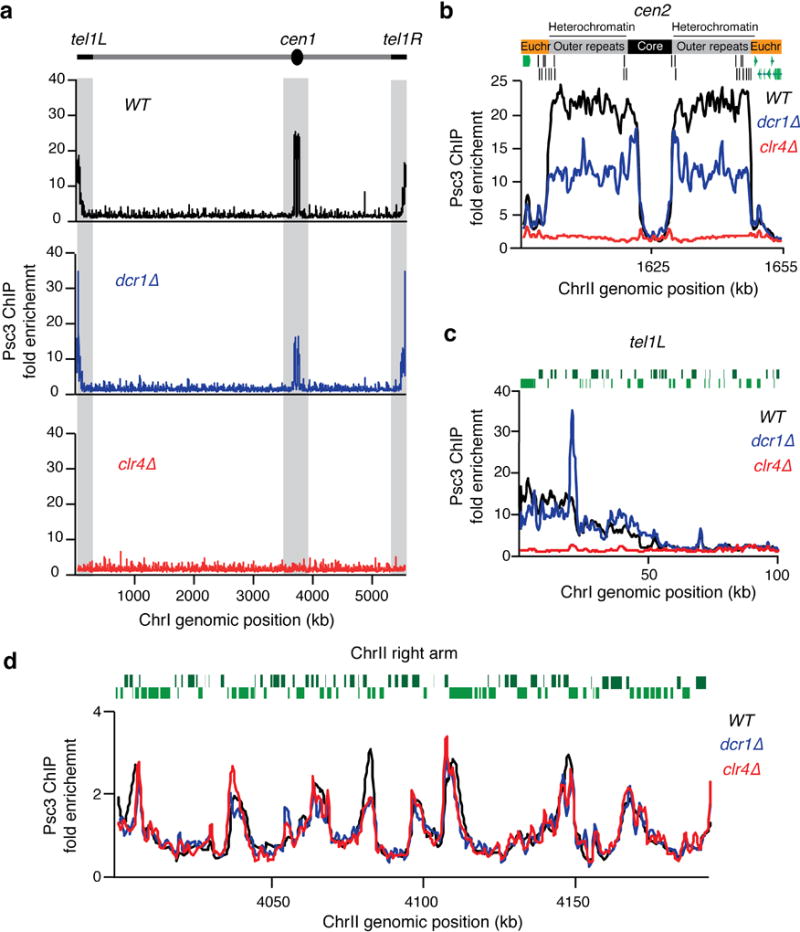
a, Distribution of the Psc3 subunit of cohesin as determined by ChIP-chip. Psc3-GFP localization along ChrI is shown for the indicated strains. Note that Psc3 localization in clr4∆ was specifically affected at heterochromatic regions (grey shaded), but not at chromosome arm regions. On the other hand, Psc3 centromeric localization was reduced but not abolished in dcr1∆. b, c, Psc3-GFP localization to heterochromatin coated centromere 2 (b) and to telomere 1 left (c). d, Psc3-GFP localization to euchromatic chromosome arm regions. Enrichments along a 200kb region of the right arm of ChrII are shown. Green bars represent open reading frames according to the 2007 S. pombe genome assembly. The fold enrichment of Psc3-GFP (y axis) is plotted at the indicated chromosome position (x axis).
Extended Data Figure 4. Centromeric heterochromatin is maintained in mmi1∆.
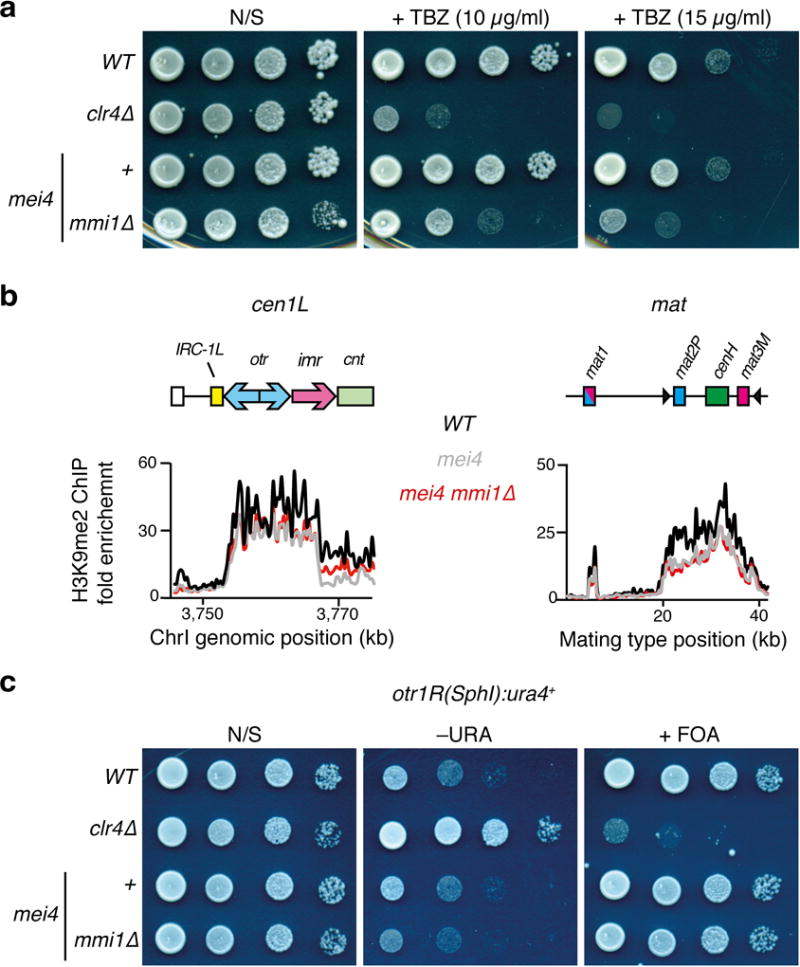
a, Ten-fold serial dilutions of each strain were plated on YEA rich media containing the indicated concentrations of the spindle poison TBZ, and were grown at 33°C. b, H3K9me2 enrichments in the indicated strains were determined by ChIP-chip analysis. The fold enrichment of H3K9me2 (y axis) is plotted at the indicated chromosome position (shown at top). H3K9me2 distribution at the mat locus is shown in addition to cen1L. c, Ten-fold serial dilutions of strains harboring a ura4+ insertion at the outer repeats of centromere 1 were plated on the indicated PMG minimal media and grown at 33°C. Note that mmi1∆ is lethal but can be rescued by loss of function of Mei4, a meiotic transcription factor. mei4 mmi∆ is compared to appropriate mei4 and WT controls.
Extended Data Figure 5. Rec8 is enriched at centromeres and colocalizes with Rec11 on chromosome arms in mmi1∆.
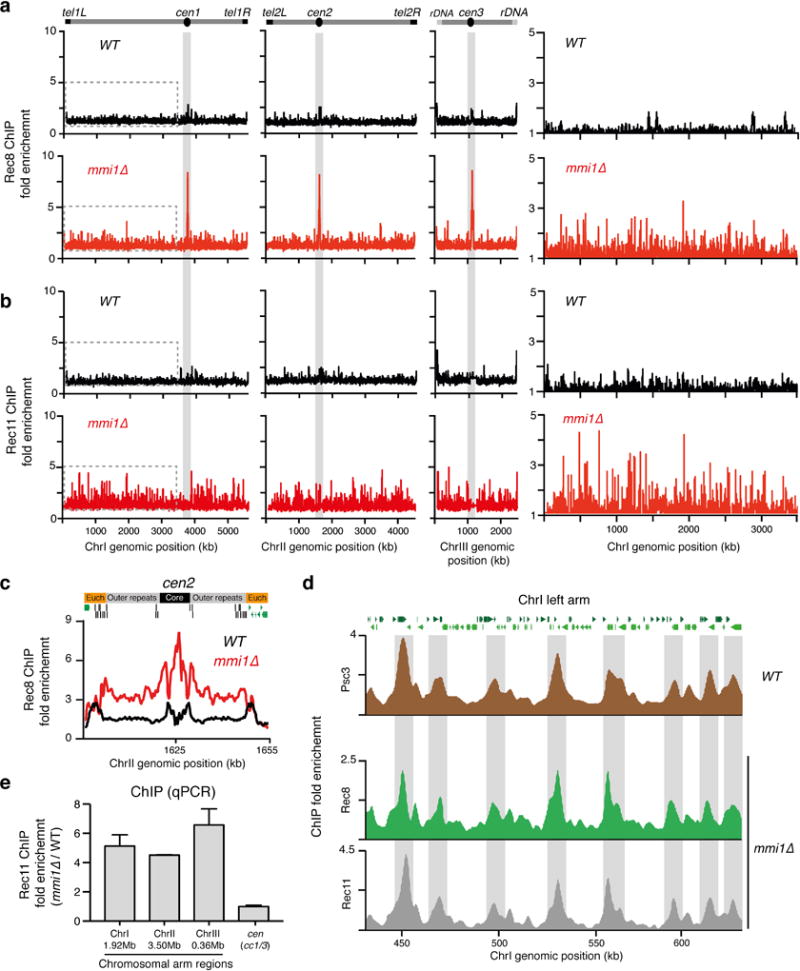
a-c, Distribution of the Rec8 and Rec11 subunits of cohesin as determined by ChIP-chip. HA-Rec8 and Rec11-GFP localization along the S. pombe genome (a,b) and centromere 2 (cen2) (c) is shown for the indicated strains. Note that Rec8 localization is highly enriched at centromeres (shaded grey) and colocalizes with Rec11 at chromosomal arms in mmi1∆. An enhanced view of the left arm of ChrI (indicated by the dotted lines) is shown. d, Increased localization of Rec8 and Rec11 to chromosomal arms correlates with known mitotic cohesin peaks. Rec8, Rec11 and Psc3 enrichment along a 200-kb region of the left arm of ChrI is shown. ChIP-chip analysis of Psc3 (brown), Rec8 (green) and Rec11 (grey) was performed in WT or mmi1∆ strains as indicated. The fold enrichment of Psc3-GFP, HA-Rec8 and Rec11-GFP (y axis) is plotted at the indicated chromosome position (x axis). Note that the regions displaying higher enrichment of Rec8 (shaded grey) are correspondingly enriched for Rec11 and Psc3. e, Rec11 enrichment at the indicated chromosomal arm locations and centromere central core (cc1/3) were determined by ChIP-qPCR. The mmi1∆ strain used in this study carries a truncated non-functional allele of mei4.
Extended Data Figure 6. Chromosomal localization of Psc3 and Rad21 in mmi1∆.
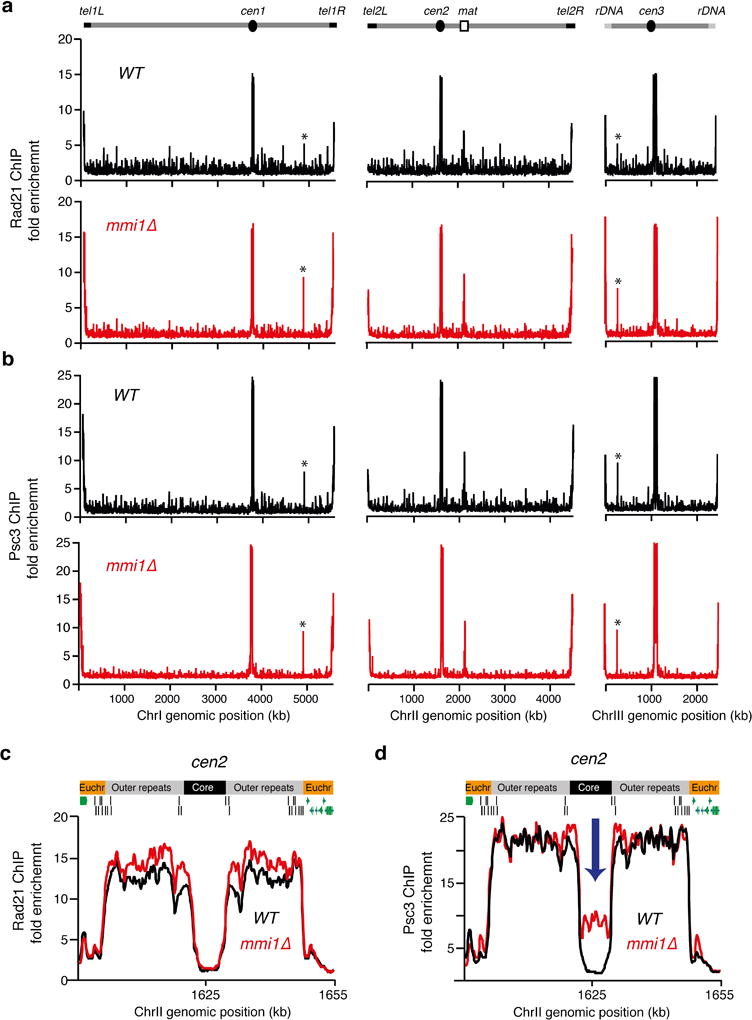
a, b, Distribution of Rad21 and the Psc3 subunit of cohesin as determined by ChIP-chip. Rad21-GFP (a) or Psc3-GFP (b) localization along the S. pombe genome is shown for the indicated strains. Enrichments at mae1 and mae2, marked by asterisks, reflect cross-hybridization of these loci to subtelomeric sequences. c, d, Rad21 (c) or Psc3 (d) localization to centromere 2 (cen2). The fold enrichment of Rad21-GFP or Psc3-GFP (y axis) is plotted at the indicated chromosome position (x axis). Note the abnormally high enrichment of Psc3 but not Rad21 at the central core in mmi1∆ (blue arrow). The mmi1∆ strain used in this study carries a truncated non-functional allele of mei4.
Extended Data Figure 7. Increased localization of Rec8 and Rec11 to chromosomal arms results in decreased Psc3 and Rad21.
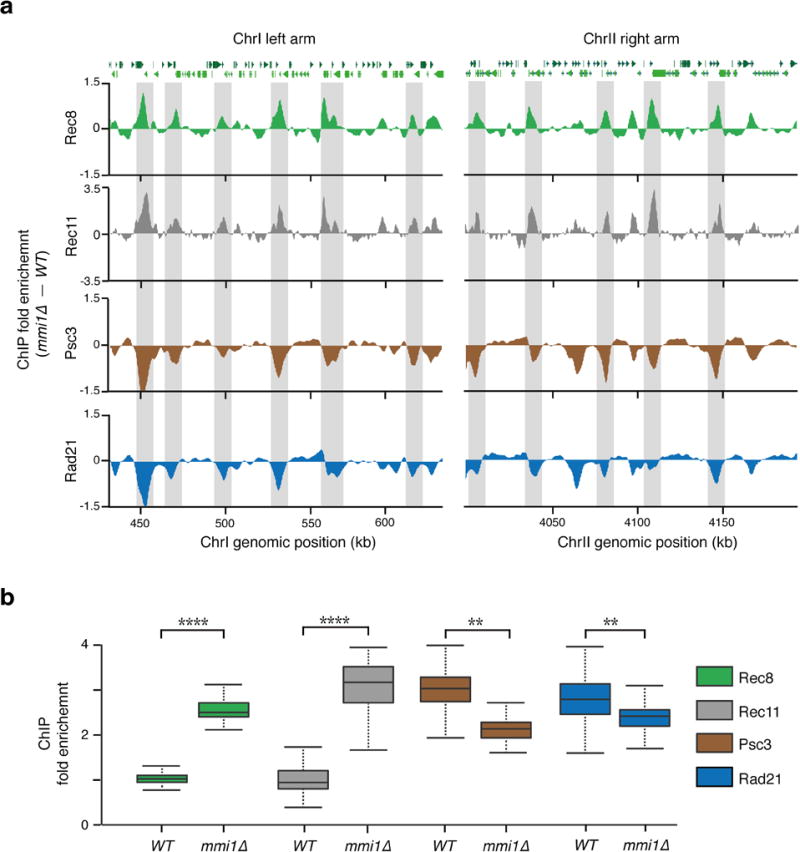
a, Distribution of Rec8 (green), Rec11 (grey), Psc3 (brown) and Rad21 (blue) subunits of cohesin as determined by ChIP-chip in mmi1∆ and WT strains. Enrichments along two 200-kb regions of ChrI (left arm) and ChrII (right arm) are shown. The fold enrichment of the indicated proteins in mmi1∆, calculated by subtraction of WT, is plotted (y axis) at the indicated chromosome position (x axis). Note that the regions showing high Rec8 enrichment in mmi1∆ (shaded grey) are also enriched for Rec11, but are depleted of Psc3 and Rad21. b, Boxplots showing ChIP enrichments of the indicated proteins at 133 Rec8 enriched chromosomal arm locations in WT and mmi1∆ strains. **P< 0.01; ****P< 0.0001 (One-way Anova plus Bonferroni post-tests). The mmi1∆ strain used in this study carries a truncated non-functional allele of mei4.
Extended Data Figure 8. Additional characterization of rec8-OE diploids from UPD assays.
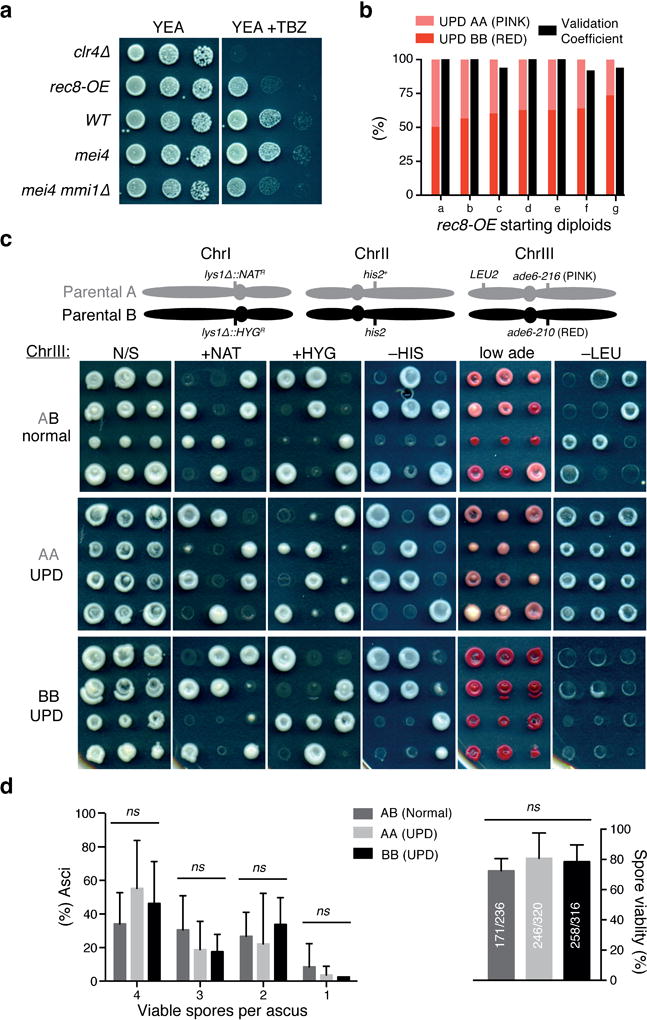
a, Serial dilution growth assay of the indicated strains. Ten-fold serial dilutions were spotted. Cells were grown for 3 days at 32°C in YEA rich medium with or without TBZ (15μg/ml). Note that like mei4 mmi1∆, rec8-OE exhibits TBZ sensitivity. b, Distribution of resulting UPD diploids (AA and BB) and validation coefficients used for adjustment of UPD frequencies in rec8-OE diploids. ≥12 UPD candidates per starting diploid were validated. c, Tetrad dissection analyses were performed with rec8-OE diploids obtained from UPD assays that were heterozygous (AB) or homozygosed for ChrIII (AA and BB). A schematic of the S. pombe chromosomes in haploid parental strains A and B, indicating the location of the relevant markers, is depicted on top. N/S, non-selective media. Note the asymmetric (4:0 or 0:4) segregations observed for ChrIII, in contrast to normal (2:2) segregations observed for ChrI and ChrII. d, Left, quantification of asci based on the number of viable spores. Right, spore viability quantified by tetrad dissection analysis of rec8-OE diploids shown in c. In each set, data correspond to a total of ≥59 asci from ≥7 independent diploids. ns, P>0.1 (Multiple t-tests).
Extended Data Figure 9. Overexpression of Rec8 (rec8-OE) in wild-type cells phenocopies mmi1∆.
a, Examples of UPD in rec8-OE strains. Schematic of fission yeast chromosomes of haploid parental strains A and B, indicating the locations of the relevant markers, is depicted on top. Haploid parental and the indicated diploid strains are shown. Note that the genetic markers on both arms of ChrIII were homozygosed in AA and BB diploids, which indicates UPD. b, Quantification of UPD in the indicated mat2-102/mat1M-smt0 nonsporulating diploid strains as depicted in Extended Data Fig. 1c (assay A). The data for WT was replotted from Extended Data Fig. 2c. Each filled red circle represents the UPD frequency of an independent starting heterozygous diploid. >100 colonies were scored for each diploid. Bars and error bars denote mean values and SD, respectively. **** P< 0.0001 (Mann-Whitney U test) c, d, Distribution of the Rec8 subunit of cohesin along the S. pombe genome (c) as determined by HA-Rec8 ChIP-chip. Note that Rec8 is highly enriched at centromeres (shaded grey) and at chromosome arms in rec8-OE. An enhanced view of the left arm of ChrI (indicated by the dotted lines) is also shown (d). e, Rec8 localization to centromere 1 (cen1) is shown for the indicated strains. The fold enrichment of HA-Rec8 is plotted (y axis) at the indicated chromosome position (x axis). Green bars represent open reading frames according to the 2007 S. pombe genome assembly.
Extended Data Figure 10. UPD is likely to be caused by a reductional event affecting one homolog, while the other segregates equationally.
a, Schematic of fission yeast chromosomes of haploid parental strains A and B, indicating the locations of relevant markers (top). Quantification of rec8-OE half-sectored resulting diploids from UPD assays shown in Fig. 4f, g. b, Random spore analysis of half-sectored resulting diploids. Eight half-sectored diploids, white/red (1–4) and white/pink (5–8), were sporulated. Note that colonies formed by spores from the white sectors show normal distribution of markers, spores from red or pink sectors show normal segregation of ChrI-based markers but homozygosis of ChrIII-based markers. >50 haploid colonies were counted per sectored diploid. c, d, Quantification of UPD in the indicated diploid strains as depicted in Extended Data Fig. 1c. Note that, as observed in mmi1∆ (Fig. 4d), rec11∆ does not suppress UPD in rec8-OE confirming that the Rec8 along with interaction partner Psc3 at centromeres is the main driver of UPD. The data for WT and dcr1∆, mei4 mmi1∆ and rec8-OE were replotted from 1f, 2e and Extended Data Fig. 9b, respectively. Each filled red circle represents the UPD frequency of an independent starting heterozygous diploid. >100 colonies were scored for each diploid. Bars and error bars denote mean values and SD, respectively. **** P< 0.0001 (Mann-Whitney U test).
Supplementary Material
Acknowledgments
We thank Yoshinori Watanabe (University of Tokyo, Japan), Masayuki Yamamoto (National Institute for Basic Biology, Japan), Yasushi Hiraoka (Osaka University, Japan), Fuyuki Ishikawa (Kyoto University, Japan), Gerald Smith (FHCRC, Seattle) and the National BioResource Project (NBRP) Japan for reagents, Jemima Barrowman for editing the manuscript, Nitika Taneja and Alfonso Fernandez-Alvarez for technical assistance and members of the Laboratory of Biochemistry and Molecular Biology, in particular Grewal Laboratory, for discussions. This work was supported by the Intramural Research Program of the National Institutes of Health, National Cancer Institute.
Footnotes
Supplementary Information is available in the online version of the paper.
Author Contributions H.D.F. and S.I.S.G. conceived the project and designed experiments. H.D.F. performed live cell imaging, UPD and other genetic assays, V.C. and H.D.F. conducted ChIP-chip and ChIP-qPCR, T.S. performed Western blots, G.T. conducted bioinformatics analyses, M.Z. and V.C. performed RNA-seq, V.B., J.D., H.D.F., T.S and T.M. constructed strains. All authors contributed to data interpretation. H.D.F. and S.I.S.G. wrote the manuscript with input from all authors.
The authors declare no competing financial interests.
References
- 1.Andersen SL, Petes TD. Reciprocal uniparental disomy in yeast. Proc. Natl. Acad. Sci. U. S. A. 2012;109:9947–9952. doi: 10.1073/pnas.1207736109. [DOI] [PMC free article] [PubMed] [Google Scholar]
- 2.Tuna M, Knuutila S, Mills GB. Uniparental disomy in cancer. Trends Mol. Med. 2009;15:120–128. doi: 10.1016/j.molmed.2009.01.005. [DOI] [PubMed] [Google Scholar]
- 3.Grewal SI, Jia S. Heterochromatin revisited. Nat. Rev. Genet. 2007;8:35–46. doi: 10.1038/nrg2008. [DOI] [PubMed] [Google Scholar]
- 4.Zofall M, et al. RNA elimination machinery targeting meiotic mRNAs promotes facultative heterochromatin formation. Science. 2012;335:96–100. doi: 10.1126/science.1211651. [DOI] [PMC free article] [PubMed] [Google Scholar]
- 5.Bernard P, et al. Requirement of heterochromatin for cohesion at centromeres. Science. 2001;294:2539–2542. doi: 10.1126/science.1064027. [DOI] [PubMed] [Google Scholar]
- 6.Nonaka N, et al. Recruitment of cohesin to heterochromatic regions by Swi6/HP1 in fission yeast. Nat. Cell Biol. 2002;4:89–93. doi: 10.1038/ncb739. [DOI] [PubMed] [Google Scholar]
- 7.Hall IM, Noma K, Grewal SI. RNA interference machinery regulates chromosome dynamics during mitosis and meiosis in fission yeast. Proc. Natl. Acad. Sci. U. S. A. 2003;100:193–198. doi: 10.1073/pnas.232688099. [DOI] [PMC free article] [PubMed] [Google Scholar]
- 8.Onn I, Heidinger-Pauli JM, Guacci V, Unal E, Koshland DE. Sister chromatid cohesion: a simple concept with a complex reality. Annu. Rev. Cell Dev. Biol. 2008;24:105–129. doi: 10.1146/annurev.cellbio.24.110707.175350. [DOI] [PubMed] [Google Scholar]
- 9.Mizuguchi T, et al. Cohesin-dependent globules and heterochromatin shape 3D genome architecture in S. pombe. Nature. 2014;516:432–435. doi: 10.1038/nature13833. [DOI] [PMC free article] [PubMed] [Google Scholar]
- 10.Hiriart E, et al. Mmi1 RNA surveillance machinery directs RNAi complex RITS to specific meiotic genes in fission yeast. EMBO J. 2012;31:2296–2308. doi: 10.1038/emboj.2012.105. [DOI] [PMC free article] [PubMed] [Google Scholar]
- 11.Yamanaka S, et al. RNAi triggered by specialized machinery silences developmental genes and retrotransposons. Nature. 2013;493:557–560. doi: 10.1038/nature11716. [DOI] [PMC free article] [PubMed] [Google Scholar]
- 12.Whitehurst AW. Cause and consequence of cancer/testis antigen activation in cancer. Annu. Rev. Pharmacol. Toxicol. 2014;54:251–272. doi: 10.1146/annurev-pharmtox-011112-140326. [DOI] [PubMed] [Google Scholar]
- 13.Simpson AJ, Caballero OL, Jungbluth A, Chen YT, Old LJ. Cancer/testis antigens, gametogenesis and cancer. Nat. Rev. Cancer. 2005;5:615–625. doi: 10.1038/nrc1669. [DOI] [PubMed] [Google Scholar]
- 14.Janic A, Mendizabal L, Llamazares S, Rossell D, Gonzalez C. Ectopic expression of germline genes drives malignant brain tumor growth in Drosophila. Science. 2010;330:1824–1827. doi: 10.1126/science.1195481. [DOI] [PubMed] [Google Scholar]
- 15.Harigaya Y, et al. Selective elimination of messenger RNA prevents an incidence of untimely meiosis. Nature. 2006;442:45–50. doi: 10.1038/nature04881. [DOI] [PubMed] [Google Scholar]
- 16.Chen HM, Futcher B, Leatherwood J. The fission yeast RNA binding protein Mmi1 regulates meiotic genes by controlling intron specific splicing and polyadenylation coupled RNA turnover. PLoS One. 2011;6:e26804. doi: 10.1371/journal.pone.0026804. [DOI] [PMC free article] [PubMed] [Google Scholar]
- 17.Lee NN, et al. Mtr4-like protein coordinates nuclear RNA processing for heterochromatin assembly and for telomere maintenance. Cell. 2013;155:1061–1074. doi: 10.1016/j.cell.2013.10.027. [DOI] [PMC free article] [PubMed] [Google Scholar]
- 18.Sugiyama T, et al. Enhancer of rudimentary cooperates with conserved RNA-processing factors to promote meiotic mRNA decay and facultative heterochromatin assembly. Mol. Cell. 2016;61:747–759. doi: 10.1016/j.molcel.2016.01.029. [DOI] [PMC free article] [PubMed] [Google Scholar]
- 19.Watanabe Y, Nurse P. Cohesin Rec8 is required for reductional chromosome segregation at meiosis. Nature. 1999;400:461–464. doi: 10.1038/22774. [DOI] [PubMed] [Google Scholar]
- 20.Averbeck N, Sunder S, Sample N, Wise JA, Leatherwood J. Negative control contributes to an extensive program of meiotic splicing in fission yeast. Mol. Cell. 2005;18:491–498. doi: 10.1016/j.molcel.2005.04.007. [DOI] [PubMed] [Google Scholar]
- 21.Schmidt CK, Brookes N, Uhlmann F. Conserved features of cohesin binding along fission yeast chromosomes. Genome Biol. 2009;10:R52. doi: 10.1186/gb-2009-10-5-r52. [DOI] [PMC free article] [PubMed] [Google Scholar]
- 22.Kitajima TS, Yokobayashi S, Yamamoto M, Watanabe Y. Distinct cohesin complexes organize meiotic chromosome domains. Science. 2003;300:1152–1155. doi: 10.1126/science.1083634. [DOI] [PubMed] [Google Scholar]
- 23.Ding DQ, et al. Meiotic cohesins modulate chromosome compaction during meiotic prophase in fission yeast. J. Cell Biol. 2006;174:499–508. doi: 10.1083/jcb.200605074. [DOI] [PMC free article] [PubMed] [Google Scholar]
- 24.Verdaasdonk JS, Bloom K. Centromeres: unique chromatin structures that drive chromosome segregation. Nat. Rev. Mol. Cell Biol. 2011;12:320–332. doi: 10.1038/nrm3107. [DOI] [PMC free article] [PubMed] [Google Scholar]
- 25.Kitajima TS, Kawashima SA, Watanabe Y. The conserved kinetochore protein shugoshin protects centromeric cohesion during meiosis. Nature. 2004;427:510–517. doi: 10.1038/nature02312. [DOI] [PubMed] [Google Scholar]
- 26.Yokobayashi S, Yamamoto M, Watanabe Y. Cohesins determine the attachment manner of kinetochores to spindle microtubules at meiosis I in fission yeast. Mol. Cell. Biol. 2003;23:3965–3973. doi: 10.1128/MCB.23.11.3965-3973.2003. [DOI] [PMC free article] [PubMed] [Google Scholar]
- 27.Sakuno T, Tada K, Watanabe Y. Kinetochore geometry defined by cohesion within the centromere. Nature. 2009;458:852–858. doi: 10.1038/nature07876. [DOI] [PubMed] [Google Scholar]
- 28.Yokobayashi S, Watanabe Y. The kinetochore protein Moa1 enables cohesion-mediated monopolar attachment at meiosis I. Cell. 2005;123:803–817. doi: 10.1016/j.cell.2005.09.013. [DOI] [PubMed] [Google Scholar]
- 29.Vanoosthuyse V, Prykhozhij S, Hardwick KG. Shugoshin 2 regulates localization of the chromosomal passenger proteins in fission yeast mitosis. Mol. Biol. Cell. 2007;18:1657–1669. doi: 10.1091/mbc.E06-10-0890. [DOI] [PMC free article] [PubMed] [Google Scholar]
- 30.Bershteyn M, et al. Cell-autonomous correction of ring chromosomes in human induced pluripotent stem cells. Nature. 2014;507:99–103. doi: 10.1038/nature12923. [DOI] [PMC free article] [PubMed] [Google Scholar]
- 31.Sabatinos SA, Forsburg SL. Molecular genetics of Schizosaccharomyces pombe. Methods Enzymol. 2010;470:759–795. doi: 10.1016/S0076-6879(10)70032-X. [DOI] [PubMed] [Google Scholar]
- 32.Nabeshima K, et al. Dynamics of centromeres during metaphase-anaphase transition in fission yeast: Dis1 is implicated in force balance in metaphase bipolar spindle. Mol. Biol. Cell. 1998;9:3211–3225. doi: 10.1091/mbc.9.11.3211. [DOI] [PMC free article] [PubMed] [Google Scholar]
- 33.Lin Y, Smith GR. Transient, meiosis-induced expression of the rec6 and rec12 genes of Schizosaccharomyces pombe. Genetics. 1994;136:769–779. doi: 10.1093/genetics/136.3.769. [DOI] [PMC free article] [PubMed] [Google Scholar]
- 34.Gao J, et al. Rapid, efficient and precise allele replacement in the fission yeast Schizosaccharomyces pombe. Curr. Genet. 2014;60:109–119. doi: 10.1007/s00294-013-0406-x. [DOI] [PMC free article] [PubMed] [Google Scholar]
- 35.Tashiro S, Asano T, Kanoh J, Ishikawa F. Transcription-induced chromatin association of RNA surveillance factors mediates facultative heterochromatin formation in fission yeast. Genes Cells. 2013;18:327–339. doi: 10.1111/gtc.12038. [DOI] [PubMed] [Google Scholar]
- 36.Niwa O, Matsumoto T, Yanagida M. Construction of a mini-chromosome by deletion and its mitotic and meiotic behaviour in fission yeast. Mol. Gen. Genet. 1986;203:397–405. [Google Scholar]
- 37.Steiner NC, Clarke L. A novel epigenetic effect can alter centromere function in fission yeast. Cell. 1994;79:865–874. doi: 10.1016/0092-8674(94)90075-2. [DOI] [PubMed] [Google Scholar]
- 38.Flor-Parra I, Zhurinsky J, Bernal M, Gallardo P, Daga RR. A Lallzyme MMX-based rapid method for fission yeast protoplast preparation. Yeast. 2014;31:61–66. doi: 10.1002/yea.2994. [DOI] [PubMed] [Google Scholar]
- 39.Cam HP, et al. Comprehensive analysis of heterochromatin- and RNAi-mediated epigenetic control of the fission yeast genome. Nat. Genet. 2005;37:809–819. doi: 10.1038/ng1602. [DOI] [PubMed] [Google Scholar]
- 40.Folco HD, et al. The CENP-A N-tail confers epigenetic stability to centromeres via the CENP-T branch of the CCAN in fission yeast. Curr. Biol. 2015;25:348–356. doi: 10.1016/j.cub.2014.11.060. [DOI] [PMC free article] [PubMed] [Google Scholar]
- 41.Matsuo Y, Asakawa K, Toda T, Katayama S. A rapid method for protein extraction from fission yeast. Biosci. Biotechnol. Biochem. 2006;70:1992–1994. doi: 10.1271/bbb.60087. [DOI] [PubMed] [Google Scholar]
- 42.Chalamcharla VR, Folco HD, Dhakshnamoorthy J, Grewal SI. Conserved factor Dhp1/Rat1/Xrn2 triggers premature transcription termination and nucleates heterochromatin to promote gene silencing. Proc. Natl. Acad. Sci. U. S. A. 2015 doi: 10.1073/pnas.1522127112. [DOI] [PMC free article] [PubMed] [Google Scholar]
- 43.Mata J, Lyne R, Burns G, Bahler J. The transcriptional program of meiosis and sporulation in fission yeast. Nat. Genet. 2002;32:143–147. doi: 10.1038/ng951. [DOI] [PubMed] [Google Scholar]
Associated Data
This section collects any data citations, data availability statements, or supplementary materials included in this article.
Supplementary Materials
Data Availability Statement
The microarray and sequencing data that support the findings of this study are available at the NCBI Gene Expression Omnibus (GEO) repository under the accession number GSE77050. Uncropped blots and unprocessed data from LOH and UPD assays are provided as source data files.