

Summary Paragraph
While microorganisms are often studied as populations, the behavior of single, individual cells can have profound consequences. For example, tuberculosis, caused by the bacterial pathogen Mycobacterium tuberculosis, requires months of antibiotic therapy even though the bulk of the bacterial population rapidly dies. Shorter courses lead to high rates of relapse because subpopulations of bacilli can survive despite being genetically identical to those that are easily killed 1. In fact, mycobacteria create variability every time a cell divides, producing daughter cells with different sizes and growth rates 2, 3. The mechanism(s) that underlie this high-frequency variation and how variability relates to survival of the population are unknown. Here we show that mycobacteria actively create heterogeneity. Using a fluorescent reporter and a FACS-based transposon screen, we find that deletion of lamA, a gene of previously unknown function, decreases the amount of heterogeneity in the population by decreasing asymmetric polar growth. LamA has no known homologs in other organisms, but is highly conserved across mycobacterial species. We find that LamA is a member of the mycobacterial division complex (“the divisome”). It inhibits growth at nascent new poles, creating asymmetry in polar growth. The kinetics of killing individual cells that lack lamA are more uniform and more rapid with rifampicin and certain drugs that target the cell wall. Our results show that mycobacteria encode a non-conserved protein that controls the pattern of cell growth, resulting in a population that is both heterogeneous and better able to survive antibiotic pressure.
Main Text
In order to identify genetic determinants of single-cell heterogeneity, we first identified a reporter of heterogeneity that was relevant to antibiotic efficacy appropriate for a genetic screen. Calcein AM is a non-fluorescent hydrophobic molecule that enters cells through passive diffusion. Once inside, calcein AM is cleaved by esterases to produce calcein, a charged fluorescent molecule that is trapped in the cytoplasm unless exported through active mechanisms 4. Both molecules are substrates for ABC transporters in eukaryotic cells 5, 6. Therefore, we hypothesized that: 1) cells would not stain uniformly because of differences in uptake, esterase activity, and efflux and 2) these differences between cells would account, in part, for differences in antibiotic susceptibility. When we stained a population of Mycobacterium smegmatis (Msm) cells we saw heterogeneous fluorescence by flow cytometry spanning two orders of magnitude (Fig. 1a). By time-lapse microscopy we found that much of this heterogeneity appeared to begin at the time of cell division (Supplementary Video 1). Daughter cells accumulated calcein unevenly, even though the calcein intensity before division was uniform throughout the mother cell. The daughter cell that inherited the new pole from the previous round of division was consistently brighter than its sister cell, which inherited the old pole (Fig. 1b). To test if heterogeneity in calcein accumulation could explain the variation in response to certain drugs we used time-lapse microscopy and microfluidics to determine if calcein fluorescence of individual cells before drug treatment correlated to survival after treatment with the antibiotic rifampicin, a first-line drug for tuberculosis (Fig. 1c). Strikingly, we found bright cells were less likely to divide following antibiotic treatment than dim cells (Fig. 1d). Thus, calcein accumulation predicts susceptibility to rifampicin on a single cell level.
Figure 1. Heterogeneity is important for survival in rifampicin.

a, Flow cytometry of calcein-stained Msm cells (Coefficient of Variation (CV) = standard deviation/mean*100). b, Wild type cells are imaged over time in a microfluidic device while calcein AM is continuously added. At the time of cell division, the average calcein intensity of each daughter cell is measured. For 58 sister cell pairs the ratio of the average calcein intensity of the new pole sister to the average calcein intensity of the old pole sister is calculated. c,d, Using the experiment outlined in c the fluorescence of 96 individual cells is measured and compared to the number of progeny that same cell produced during and after rifampicin treatment, shown in d.
To determine the mechanism underlying the variability in calcein staining, we designed a genetic screen to find transposon mutants with altered calcein accumulation. We hypothesized that there could be two different types of mutations – those that altered the average behavior of the population and those that changed the variation of the population. To detect each of these, we designed a Fluorescence-Activated Cell Sorting (FACS)-based screen that would identify alterations in both the median and distribution of calcein staining in Msm transposon mutants 7 (Fig. 2a). After staining with calcein, we used FACS to sort cells into eight bins, each representing ~12.5% of the population (Fig. 2b) and used deep sequencing to quantify transposon insertions per gene in each bin (Fig. 2c). Using the total insertions in the entire population, we calculated the effective fluorescence distribution for each gene as compared to wild type (Fig. 2d).
Figure 2. Screen for mutants altered in calcein distribution.

a, An Msm transposon library is stained with calcein AM b, and 1,200,000 cells are sorted into 8 bins by FACS, with each bin representing 12.5% of the population. c, Each of these binned libraries is deep sequenced and d, distributions are made for each gene that represents the fraction of reads in each bin for that gene. Below are cartoons of potential distributions that are analogous to an effective fluorescent distribution for a single mutant. e, For each gene or intergenic region the mean of the effective fluorescent distribution is determined and plotted against a Mann-Whitney U p-value, which is derived from comparing each gene’s distribution to a calculated wild type distribution. We picked 9 genes (shown in red) and made 8 gene deletions strains (Supplementary Table 2).
We found many mutations that affected the average fluorescence (Fig. 2e, Supplementary Table 1). Several of these were in genes involved in transport/permeability across the membrane. For example, among those with higher fluorescence, we found insertions in an operon that encodes two putative efflux pumps (msmeg5660-5659) and enzymes required for the modification of mycolic acids that constitute a major portion of the cell wall (umaA). Likewise, we found that insertions in mspA, a gene that encodes a well-characterized porin known to permit entry of molecules through the Msm cell wall resulted in lower median fluorescence 8. We constructed targeted deletions 9 for several genes (Supplementary Table 2) and found that all had the predicted phenotypes (Fig. 3a, Extended Data Fig. 1a).
Figure 3. Validation of mutants from screen and identification of lamA.

Each of the 8 gene deletion strains is stained with calcein and 3 biological replicates are analyzed by flow cytometry. a, The mean ratio of the median calcein fluorescence for each mutant compared to wild type. b, The mean ratio of the mutant CV compared to wild type CV. (for a,b: **p<0.01; *p<0.05, calculated by a two-sided student’s t-test in comparison to WT; error bars represent s.d. assuming independence in the measurements of WT and mutant). c, An illustrative summary of two potential mutants. In WT, a subpopulation of cells can grow at drug concentrations that stop growth of the majority of the population. In a less variable mutant, this population represents much less of the total population, and cells exhibit a more “all or nothing” phenotype. In a mutant that is altered in the average behavior, but maintains WT-level variability, the growing subpopulation continues to exist, although it stops growing at lower concentrations that WT. The MIC (purple arrow) is lower in either case. d, Cell density in the presence of a range of rifampicin concentrations compared to a no drug control for three strains (n=2 biological replicates): WT, ΔlamA, and ΔumaA. The solid line represents the fit of the data to a sigmoid function. s is the best-fit value for the slope. e, The slope shown in panel d is correlated to the CV shown in panel b. (y-axis error bars represent range, x-axis represent s.d.) f, The ratio of calcein accumulation between sister cells is measured for WT and for ΔlamA cells (n=58 sister pairs for WT (grey); n=49 sister pairs for ΔlamA (blue); dark black lines represent medians; ***p<0.001; calculated by two-sided student’s t-test with Welch’s correction in comparison to WT).
We expected some, but not all, mutants would have altered killing by rifampicin. Indeed, we found mutations that might alter rifampicin accumulation significantly changed antibiotic susceptibility, either positively (ΔumaA, ΔtetR, ΔmmpS3) or negatively (ΔmspA, ΔlepA), while others, that encode predicted esterases, enzymes that may cleave calcein AM (Δmsmeg_2500 and ΔcaeA), did not alter rifampicin killing in the predicted fashion (Extended Data Fig. 1b). Thus, our mutational data strongly suggest that calcein AM fluorescence correlates with the single-cell accumulation of rifampicin.
In addition to having an altered average fluorescence, several of the gene deletion strains also had a different degree of cell-to-cell variation (Fig. 3b). The most striking was ΔmspA, which had a fluorescent distribution that was both broader and decreased in average. In contrast, two others - ΔmmpS3 and Δmsmeg5660-5659 - produced both an increase in fluorescence and a narrowing of the distribution by both flow (Fig. 3b) and microscopy (for ΔmmpS3) (Extended Data Fig. 1c).
Heterogeneity in drug susceptibility has typically been studied in subpopulations of non-growing cells that are refractory to antibiotic treatment 10. In time-kill curves this manifests as a biphasic curve, indicating two distinct subpopulations 11. We hypothesized that the loss of heterogeneity in calcein (and, by proxy, drug) accumulation, would also lead to a difference in killing of the population. Indeed, by time-lapse microscopy, we observed that at drug concentrations close to the Minimum Inhibitory Concentration (MIC) (Extended Data Table 1), some cells stopped growing or died while others continued to grow in the presence of drug. The growing subpopulation itself produced variable daughters: those that grew and those that did not, indicating a lack of heritability (Extended Data Fig. 2a, Supplementary Video 2).
Thus, we hypothesized that in a wild type population of Msm cells there were multiple subpopulations, each with a different effective MIC. Furthermore, a less variable mutant population would result in a more “all or nothing” phenotype in response to different concentrations of drug (Fig. 3c). To test this, we measured cell growth at different sub-MICwt drug concentrations (Extended Data Figure 2b). We reasoned that the growth of the bulk population at a fixed time is proportional to the percentage of growing cells in the population and their individual growth rates. To assess variability in the population, we fit the data to a sigmoid curve and calculated the slope: a steeper slope is associated with less variability. We compared two mutants – ΔmmpS3 and ΔumaA. Both accumulated approximately twice the average amount of calcein as a wild type population (Fig. 3a), but one varied less (ΔmmpS3), and the other (ΔumaA) more as compared to wild type (Fig. 3b). Consistent with our hypothesis, the slope was steeper for ΔmmpS3 than wild type and shallower than WT for ΔumaA (Fig. 3d) and correlated extremely well with the measured calcein CV for the three strains we tested (R2=0.999) (Fig. 3e). Consistently, by time-lapse microscopy, nearly all ΔmmpS3 cells stopped growing at drug concentrations that allowed for growth of a subpopulation of wild type cells (Supplementary Video 2). Likewise, at drug concentrations normalized to the average calcein accumulation of each strain to correct for the intracellular accumulation of rifampicin, the ΔmmpS3 had decreased survival while the more variable ΔumaA strain survived better than wild type. (Extended Data Fig. 2c). Together, these data suggest that ΔmmpS3 both accumulates drug more homogenously and is more uniformly susceptible to rifampicin than a wild type population. We renamed mmpS3 lamA, for Loss of Asymmetry Mutant A.
lamA is a previously uncharacterized gene. While its protein product shares limited homology to the four other mmpS genes in the Mtb genome (Extended Data Fig. 3a), it is distinctly different from the others (Extended Data Fig. 3b). It is over two-fold larger and is the only mmpS homolog that is not in an operon with an mmpL gene. lamA homologues are found across mycobacterial species 12, including in the minimal genome of Mycobacterium leprae, but not in other organisms.
How does lamA create and maintain heterogeneity in a population of genetically identical Msm cells? Consistent with our observation in Figure 1b, at the time of division, the asymmetry in daughter cell accumulation of calcein in ΔlamA cells was much reduced (by ~60%) (Fig. 3f, Supplementary Video 3). As a result, we hypothesized that LamA was involved in some aspect of mycobacterial cell growth and/or division.
In contrast to rod shaped bacteria that insert cell wall material along their sidewalls, mycobacteria insert new cell wall at or near their poles 13. Under our growth conditions, polar growth is asymmetric: for a single cell, the new pole grows less over the course of the division cycle, than the old pole 2. Surprisingly, loss of lamA changes this pattern of growth. In ΔlamA cells, new cell wall material is added at much more similar rates between the old and new poles (Fig. 4a, Extended Data Figs. 4a–b), even though the overall amount of growth of individual cells (Extended Data Figs. 4a, 4c–d) and the population (Extended Data Figs. 4e–f) is the same as wild type cells. Thus, lamA is at least partially responsible for asymmetric polar growth in mycobacteria.
Figure 4. LamA creates asymmetry in polar growth and is a member of the divisome.
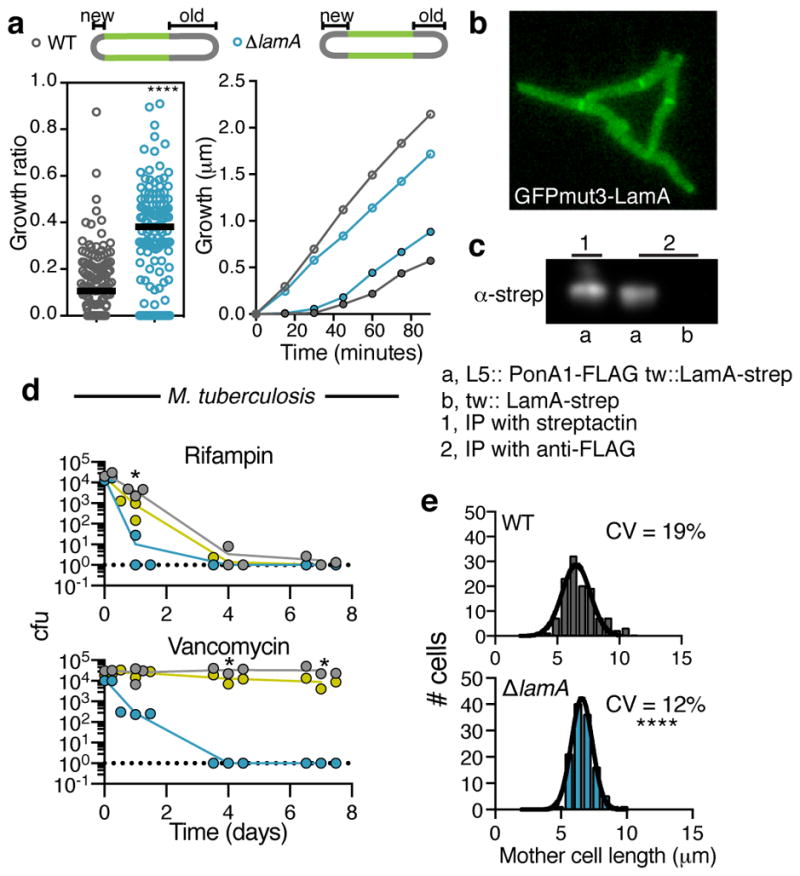
a, Using a pulse-chase experiment with an amine reactive dye as described in ref. 2 the amount of growth at the new and old poles is measured over the duration of the cell cycle. left panel: The ratio of growth (new pole/old pole) for single cells (n=137 cell for WT; n=125 cells for ΔlamA; dark black lines represent medians; the absolute values are shown in Extended Data Fig 6a). right panel: Using the same pulse chase experiment, growth is followed after septation at finer time increments. Time refers to the time after septation. (Old pole= open circles; New pole = closed circles; points represent averages of 20 cells). b, A representative image at a single time point of GFPmut3-LamA in WT Msm cells. Data was recorded for ~100 cell at t=0. c, α-strep western blot of immune-precipitates by indicated method (streptactin or anti-FLAG). Pull-down with α-FLAG was performed twice and LamA-strep was seen both times. a,b are different strains with ponA1-FLAG or lamA-strep integrated at the indicated phage sites (L5 or tweety (tw)). d, Survival of WT Mtb (grey), ΔlamA (blue), and complemented strain (yellow) is measured over time in the presence of 0.3 μg/ml rifampicin or 4 μg/ml vancomycin for 3 biological replicates. (Dotted line represents limit of detection; *p<0.05 by student’s t-test in comparison to WT) e, The distribution for the length of cells just prior to division (mother cells) for WT (n=120) and ΔlamA (n=120) cell. (For a,e **** p<0.0001; by a two-sided student’s t-test with Welch’s correction to compare either mean (a) or variation (e)).
The molecular details of cell growth and division in mycobacteria are poorly understood as compared to other rod-shaped bacteria. Mycobacteria do not encode obvious homologues of many cell elongation and division factors. 13 Therefore, to further understand lamA-mediated asymmetric growth, we visualized the two best-characterized factors in the division and elongation complexes, FtsZ and Wag31 (DivIVA), in wild type and mutant cells. These proteins localize early to the site of division or elongation, respectively, and recruit other factors into active complexes. In cells that expressed FtsZ-mCherry2B and GFP-Wag31, by time-lapse microscopy, we observed dynamic changes in the localization of each of these proteins in the absence of lamA during the transition between division and growth at the new pole. The division complex, as defined by FtsZ-mCherry, more rapidly decreased at the end of the cell cycle (Extended Data Fig. 5a–d Supplementary Videos 4 and 5), while the elongation complex, as defined by GFP-Wag31, was recruited more rapidly to the site of division and, thus, to the site of the new pole (Extended Data Fig. 5a, 5c–d, Supplementary Videos 6 and 7). These data suggest that LamA functions at the site of division, during the switch between division and elongation. Indeed, a GFPmut3-LamA fusion protein localizes to the septum (Fig. 4b) at the same time FtsZ-mCherry2B becomes stabilized in wild type cells (Extended Data Figs. 5a–b, Supplementary Video 8).
Therefore, we hypothesized that LamA is a member of the mycobacterial division complex (“the divisome”) that inhibits polar growth at the nascent new pole. To test if LamA is a member of the division complex, we immunoprecipitated an epitope-tagged LamA and identified co-precipitating proteins using mass spectrometry. We found three unique peptides corresponding to PonA1, while none were present in a control sample that lacked the epitope tag (Supplementary Table 5). PonA1 is the major peptidoglycan-synthesizing enzyme in mycobacteria and is known to be a member of the division complex and an early member of the elongation complex 14. To verify this interaction we constructed a strain that expressed lamA and ponA1, each tagged with a distinct epitope. We found that LamA could be precipitated with an antibody directed against the PonA1 epitope (Fig. 4c) only in the presence of epitope-tagged PonA1.
Does LamA inhibit cell wall synthesis? To test this we overexpressed LamA using an inducible promoter on a multi-copy plasmid. Almost immediately after induction, we observed that, on average, cells added less cell wall material between successive generations (Extended Data Fig. 6a, Supplementary Video 9) suggesting that, indeed, LamA inhibits cell wall synthesis. Furthermore, as we followed individual cells over several generations, we observed that not all induced cells behaved the same. Those cells with the oldest poles – poles that were established before inducer was added - were almost unaffected by the addition of the inducer, while those cells with the newest poles – poles that were assembled in the presence of inducer - were the smallest in the later generations (Extended Data Fig. 6b). These data support the hypothesis that LamA is a member of the mycobacterial divisome and inhibits cell wall synthesis at the nascent new pole.
If cells have decreased size and growth rate heterogeneity, we hypothesized that they should be killed at a more uniform rate by drugs that target the cell wall. Indeed, ΔlamA Msm cells bound fluorescently conjugated vancomycin much more uniformly (Extended Data Fig. 7a), and were killed more rapidly by vancomycin, teicoplanin and certain β-lactams (Extended Data Fig. 7b–e). As with rifampicin, a subpopulation of wild type Msm cells was able to grow and divide in the presence of vancomycin. In fact, wild type Msm cells were able to grow even at vancomycin concentrations above the MIC (Supplementary Video 10) and, thus, as has been previously observed with other antibiotics in mycobacteria, 15 the bacterial number in the presence of drug, as measured by outgrowth on agar plates, reflects a balance of growing and non-growing or dead cells. In a ΔlamA strain, this heterogeneity is dramatically reduced as measured by growth of the population as a function of drug concentration (Extended Data Fig. 7f) and by time-lapse microscopy (Supplementary Video 10). Thus, LamA may be an attractive drug target for pathogenic mycobacterial species. In fact, M. tuberculosis cells that lacked lamA were killed more rapidly than wild type or complemented cells by vancomycin and rifampicin (Fig. 4d).
How does the amount of LamA-mediated heterogeneity compare to other organisms? We measured the length of cells just prior to division. We found that the amount of variation in wild type Msm cells (19%) is much higher than ΔlamA Msm cells (12%) (Fig. 4e) and other rod-shaped bacteria,16, 17 including Corynebacterium glutamicum (Extended Data Fig. 8), a close relative of mycobacteria with similar cell wall architecture and polar elongation but that does not encode LamA. Importantly, this loss of heterogeneity could be restored in ΔlamA cells by complementation with lamA (Extended Data Fig. 9).
Together, these data show that LamA is a member of the mycobacterial division complex. It functions to inhibit cell wall synthesis at the new pole during the switch between division and elongation. Consequently, asymmetric growth is established between the new and old poles, which, in turn leads to a more heterogeneous population of cells. Reducing heterogeneity in pathogen populations could decrease the rate of treatment failure. For example, some compounds subvert variability in HIV populations. 18. In M. tuberculosis, targeting LamA could lead to synergistic therapies that shorten treatment duration and increase the rate of cure.
Materials and Methods
Bacterial strains and culture conditions
Mycobacterium smegmatis mc2155 was grown in 7H9 salts (Becto-Dickinson) supplemented with: 5 g/L albumin, 2 g/L dextrose, 0.85 g/L NaCl, 0.003 g/L catalase, 0.2% glycerol and 0.05% Tween80, or plated on LB agar. M. tuberculosis H37Rv was cultured in Middlebrook 7H9 salts supplemented with OADC (oleic acid, albumin, dextrose, catalase [BD Biosciences, Franklin Lakes, NJ]), 0.25% glycerol, and 0.05% Tween-80 or plated on 7H10 agar. E. coli DH5α was used for cloning. Antibiotic concentrations for M. smegmatis and M.tuberculosis were: 25 μg/ml kanamycin, 20 μg/ml zeocin, 50 μg/ml hygromycin. Antibiotic concentrations for E. coli were: 50 μg/ml kanamycin, 100 μg/ml hygromycin. All strains were grown at 37°C. Coryne glutamicum was grown in Brain-Heart Infusion Broth.
Strain construction
All knockouts were made using recombineering 9. In Msm the genes in Supplementary Table 2 were replaced with a zeocin resistance cassette, surrounded by loxP sites. Constructs were designed to be assembled into a pUC57 vector by isothermal assembly. Primers are are listed in Supplementary Table 3: homology to Msm genome shown in lowercase; homology to pUC57 vector (upper primer for each gene) and zeocin resistence cassette (lower primer for each gene) shown in uppercase. For the Mtb KO, a construct was synthesized comprised of 500 bp of homology (shown in Supplementary Table 3) surrounding a HygR cassette and loxP sites. For genes in operons, internal-gene deletions were made. The complementing strains were made by amplifying lamA (MSMEG_4265 or Rv2198c) with 300 basepairs of sequence upstream of the gene (Primers listed in Supplementary Table 4) to capture the native promoter. These were assembled into a KanR plasmid and integrated in single copy at the L5 phage integration side. The fluorescent protein fusions: ftsZ-mcherry2B, egfp-wag31 were expressed under a medium-strength promoter (“ptb21”); gfpmut3-lamA was constructed using the pUV15 promoter. Each was integrated into the Msm chromosome at phage integration sites (L5 for egfp-wag31, and gfpmut3-lamA; tweety(tw) for ftsZ-mcherry2B) (Lewis and Hatfull, 2003)) as merodiploids. To test the interaction between PonA1 and LamA constructs were made in which lamA and/or ponA1, both under the pUV15 promoter, were integrated onto the chromosome at different phage integrate sites (L5 for ponA1 14, tweety for lamA). To make the inducible overexpression strain, LamA was sub-cloned into a multi-copy, episomal vector carrying both the tet operator and the tet repressor.
Flow cytometry
Mid log-phase cultures were stained with 0.5 μg/ml calcein for 1 hour and then filtered through a 10-μm filter. These cells were then analyzed by flow cytometry (MACSQuant VYB Excitation: 488nm; Emission filter: 525/50). To determine appropriate gates for single cells, a pilot experiment was initially done in which an equal number RFP and GFP expressing cells were grown together overnight. This mixed population, as well as the single colour expressing strains, were taken to the flow cytometer and the settings for FSC, SSC, and cell density were adjusted to minimize the dual RFP/GFP population. After adjustment and gating the dual population accounted for ~1% of the population. These setting and gates was then used for all subsequent experiments.
Time-lapse fluorescence microscopy
For all experiments, except that shown in Figure 1c, time-lapse fluorescence microscopy was performed on an inverted Nikon TI-E microscope equipped with an environmental chamber that was maintained at 37°C. Cells were imaged every 15 min for 15–20 hours in a B04A Microfluidic bacteria plate (CellASIC) continuously perfused with 7H9 medium. At the appropriate time 7H9 media with 1 μg/ml calcein was added automatically by the CellASIC system. For the experiment shown in Figure 1b, imaging and microfluidics was done as described in ref 2.
Image Analysis
To measure single-cell calcein intensity, progeny, and cell length, images were annotated manually using FIJI 19. To assess polar growth an amine-reactive dye was used for pulse-chase experiments as described in 2. The analysis of these images was done in a semi-automated fashion: First single cells were identified manually on the phase image and marked using a segmented line that was drawn consistently from the new pole to the old pole. Then, a custom FIJI script was run to measure and save the corresponding fluorescence line profile. These profiles were imported into MATLAB where the minimum, maximum, and half-maximum fluorescence intensity was determined. The half-maximum intensity was used as the consistent measurement to determine where the amine-reactive dye was in relation to the tip of the pole. Finally, these measurements were used to determine polar and total growth over the course of a cell cycle. In all experiments division/septation was determined by a visible invagination on the phase image
FACS transposon screen
An Msm transposon was thawed, grown overnight to mid-log phase, and then stained with 0.5 μg/ml calcein for 1.5 hours. This was then centrifuged and half the supernatant was taken out and discarded. The re-suspended pellet was passed through a 10-μm filter and taken to the FACS instrument (FACSAria; Excitation: 488nm; Emission filter: 530/30) where 8 bins were drawn across the population, each representing 10% of the population. 150,000 cells per bin were sorted into 7H9 and then directly plated on LB Agar containing kanamycin.
Transposon Sequencing and Mapping and Counting Transposon Insertions and Analysis
Genomic DNA (gDNA) was harvested from the transposon libraries and prepared for PCR amplification as described in 20. PCR-amplified transposon–gDNA junctions were then subjected to high-throughput sequencing using the MiSeq platform per manufacturers instructions.
Genomic DNA-transposon junctions were mapped on the M.smegmatis genome and counted as described in 20. The reads at each TA site for each bin where then imported into Matlab where they were processed by a custom Matlab program. The reads were normalized in a number of ways. First, they were normalized to the total number of reads in each sequenced library. Then, the data was normalized to a normal distribution, which was necessary since each bin represented 10% of the total population and therefore represented a different area under a normal distribution curve (refer to Fig. 2b). We then created an effective fluorescent distribution for each gene by normalizing the reads for each bin for a particular gene to the total number of pre-normalized reads for that gene. Lastly to determine significance we used the fact that we knew how many cells we had sorted, and therefore approximately how many cells N we had sorted which had a transposon in a particular gene. We “lightly simulated” N number of cells to have the effective distribution for each gene we calculated above and compared this distribution to an effective wild type distribution that we created from the median values across all genes for both N and fluorescence using a Mann-Whitney test (to determine if the median was significantly different).
Immunoprecipitation and Western blotting
100mL of Msm culture was grown to mid-log phase, washed twice with PBS +0.05% tween (PBS-T), and re-suspended in 1mL of PBS-T. The crosslinker SDAD was added to the cells for a final concentration of 2mM and incubated at room temperature for 10min. 11μL of 1M Tris was added to stop the reaction, and incubated 5 min at RT. 333μL of culture was then added to a well in a 6-well glass bottomed plate, and irradiated with UV light (365nm) for 15minutes. The cells were then recovered from the well, spun down and resupsended in 1mL of Buffer W (100mM Tris pH 8.0, 150mM NaCl, 1mM EDTA) + protease inhibitors. This was then split between two tubes with glass beads and bead beated 8 times for 1 min each, icing in between. For pulldowns using Strep-tactin, SDS was added to the lysate (final concentration of 1%), and then was pre-cleared of endogenously biotinylated proteins using avidin agarose for 1 hour at room temperature. This was then spun down and the supernatant was added to beads coated with Strep-tactin, and incubated for 30 minutes at RT. The beads were washed three times with Buffer W +1% SDS, and eluted using 50μL buffer containing 10mM biotin. For experiments using anti-FLAG beads, all steps were the same except for the addition of SDS, the pre-clearing with avidin, and the elution was carried out with FLAG peptide.
Survival measurements
Strains were grown to mid-log phase, diluted to OD 0.05 in triplicate, and treated with the indicated antibiotic in 7H9 and incubated with shaking at 37°C. Drugs were added once at the beginning of the experiment. Cultures were treated in culture tubes or ink wells. A small volume of cells was taken out at the specified time point, serially diluted, and plated for survivors by colony-forming units. Each of the Msm kill curves was done at least twice, each time in triplicate, with similar results. The rifampicin kill curve in Mtb was done twice – once in duplicate and then again in triplicate (this one is shown) - with similar results, while the Mtb vancomycin kill curve was done twice at two different vancomycin concentrations with similar results.
OD600nm measurements
Strains were grown to mid-log phase, diluted to OD 0.2 in triplicate (or duplicate for Fig 3c so as to measure all three stains on the same 96 well plate). Water was added to the outermost wells of a 96 well plate. Two fold serial dilutions of the appropriate drug were added to inner wells of the plate. Both a no bacteria control, and a no drug control were included. Cells were added for a final OD of 0.1. This was incubated at 37°C with shaking in a Tecan 200 plate reader, and optical density measurements at 600-nm were measured automatically every 30 minutes for approximately 18 hours. The optical density of the wells exposed to drug were background subtracted and divided by the no drug control.
MIC determination
The MIC of Msm and Mtb strains were performed using the Alamar Blue assay as described in ref. 14.
Statistical Analysis
All experiments were performed at least twice, unless otherwise noted. Means were compared using a two-sided student’s t-test. In the cases where sample variances differed we used Welch’s correction, which does not assume equal variances, to compare the average and/or variation of two samples. For the data shown in Fig 2e, we used a non-parametric test (Mann-Whitney), as some genes displayed non-normal distributions. p<0.05 was considered significant. For most microscopy experiments, roughly 100 cells were analyzed (or 50 sister cell pairs). For those experiments that followed cells over finer time increments, ~20 cells were analyzed. For ratios, as in Figure 3 and Extended Data Figure 1, error in the ratio (in terms of standard deviation) was calculated assuming independence in the two measurements. No statistical methods were used to pre-determine sample size, and the researchers were not blinded to sample identity.
Data Availability
Source data for Figs 2e, 1a, 1b, 4c, and Extended Data 1a, b are provided with the paper. All other data that support the findings of this study are available from the corresponding author(s) upon reasonable request.
Extended Data
Extended Data Figure 1. Validation of screen and identification of mutant with decreased heterogeneity.

a, The average of 3 biological replicates of the 8 gene deletion strains is stained with calcein and analyzed by flow cytometry. The median of the each strain’s distribution (in units of wild type standard deviation) is compared to the value expected from the screen (slope = 1; R2 = 0.95; error bars represent s.d. assuming independence in the measurements of WT and mutant). b, Survival of 3 biological replicates of each strain is measured by plating and counting survivors after 42 hours in rifampicin treatment and compared to wild type (**p<0.01; *p<0.05, calculated by a two-sided student’s t-test in comparison to WT). c, The average fluorescence value of calcein-stained Msm cells measured by microscopy (n=147 for WT; n=174 for ΔlamA).
Extended Data Figure 2. Loss of lamA results in a more homogenous response to drug.

a, Two examples of growing lineages of WT Msm cells exposed to 5 μg /ml rifampicin. Blue indicate growing cells, pink indicates non-growing cells. The thick dotted line indicates the time rifampicin was added. Thin dotted lines represent division events. Data for ~100 of cells were recorded. The behavior of single cells was highly variable: many cells stopped growing immediately while others were able to grow and divide in a non-heritable manner. Bulk measurements were recorded in Figure 3d as a way of quantifying the variability over many more cells (~1M cells). b, The geometric mean of two biological replicates for WT and mutant Msm cells growing in sub-MIC concentrations of rifampicin. c, The mean survival of 4 biological replicates at 40 hours in rifampicin at normalized drug concentrations: WT=10 μg /ml; ΔlamA=5 μg /ml; ΔumaA =5 μg /ml.
Extended Data Figure 3. mmpS3 is different than the other mmpS genes.

a, A clustal omega alignment of all the mycobacterial membrane protein, small (mmpS) genes in the Mtb genomes. b, The percent identity of the mmpS genes are compared to the others.
Extended Data Figure 4. Growth properties of ΔlamA cells compared to WT.

a, Using a pulse chase experiment as in Figure 4a, the amount of growth at the new and old poles (total growth = new pole + old pole) over the duration of a cell cycle is measured for both WT (grey, n=137) and ΔlamA (blue, n=125) cells. Dark black lines represent medians. b, Slopes were fitted to the data displayed in Fig. 4a. A p-value was calculated using a t-test to compare the slopes of WT and ΔlamA. Growth of WT (grey), ΔlamA (blue), and complement (yellow) as measured by c, elongation rate (n=49 for WT; n=71 for ΔlamA); d, cell cycle time (n=49 for WT; n=71 for ΔlamA). Dark black lines represent medians. c, colony forming units; and d, optical density are measured over time for 3 biological replicates.
Extended Data Figure 5. LamA functions during the switch between division and elongation.

a, The maximum values of FtsZ-mCherry2B, eGFP-Wag31, and GFPmut3-LamA in the middle of the cell are measured as a function of cell cycle time in both wild type and ΔlamA cells. Shaded areas represent standard deviations across 20 cells for each strain. b,c For each phase indicated in a, the data were fit to a line and the slope was calculated the averaged data are shown in b, while slopes for individual cells are ploted in c. d, An example of the time lapse images that were quantified for panel a. Each panel is 15min apart. Arrows, point to the appearance of either FtsZ or LamA at the septum. Data was recorded ~100 cells, and 20 cells were used for fine quantification shown as shown in panel a. Scale bar: 5μm.
Extended Data Figure 6. Overexpression of LamA inhibits growth at the new pole.
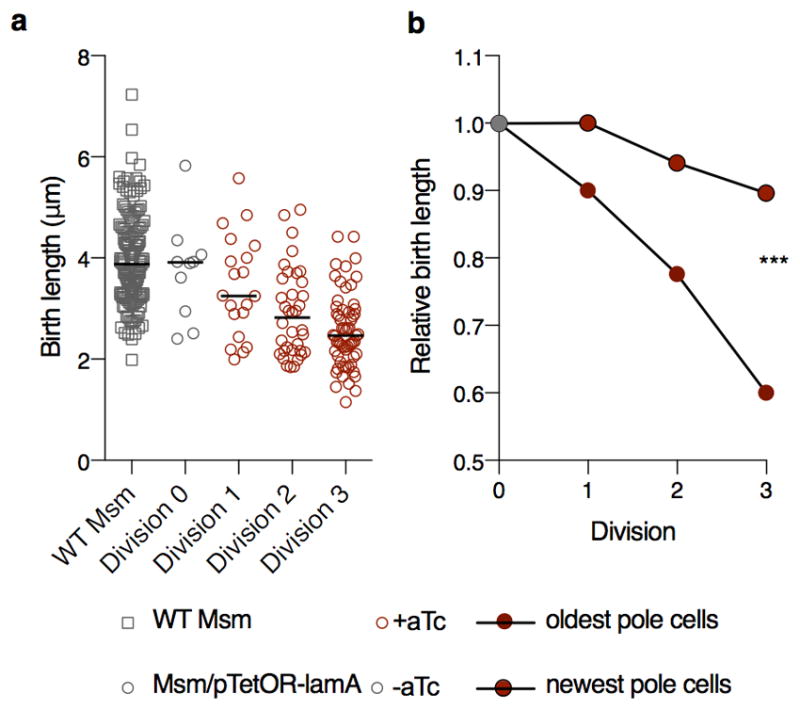
a, The birth length of a strain carrying a replicating plasmid with LamA under in inducible promoter, pTetOR, (circles) is compared to WT (squares, n=142) in the presence (red) or absence (grey) of inducer (aTc) over many division cycles (n=10 Division 0; n=20 Division 1; n=36 Division 2; n= 60 Division 3). b, Average birth length of 10 cells as a function of birth length before inducer is measured for individual cells overexpressing LamA. Oldest pole cells are cells whose poles were established before inducer was added. Newest pole cells are those whose poles are the newest in the presence of inducer. (***p<0.001 by a two-sided student’s t-test.with Welch’s correction).
Extended Data Figure 7. Loss of lamA leads to more uniform drug response for a variety of antibiotics.

a, Single-cell intensity of fluorescent-vancomycin stained cells (n=151 WT; n=140 ΔlamA; n=126 ΔlamA L5::lamA). Black lines represent fit of the data to a Guassian curve. Survival over time for WT Msm (grey), ΔlamA (blue), and the complemented strain (yellow) are measured using colony-forming units (n=3 biological replicates): b, Rifampicin 20 μg/ml; c, Teicoplanin 100 μg/ml; d, Ceftrioxone 50 μg/ml with 5 μg/ml clavulanate; e, Vancomycin 3 μg/ml. (*p<0.05 by a two-sided student’s t-test in comparison to WT, dotted line represents limit of detection). f, Cell density of 3 biological replicates in the presence of a range of vancomycin concentrations compared to a no drug control for two strains: WT Msm, and ΔlamA. The solid line represents the fit of the data to a sigmoid function. s is the best-fit value for the slope,
Extended Data Figure 8. The variation in a lamA deletion population is similar to the variation seen in other rod-shaped bacteria.
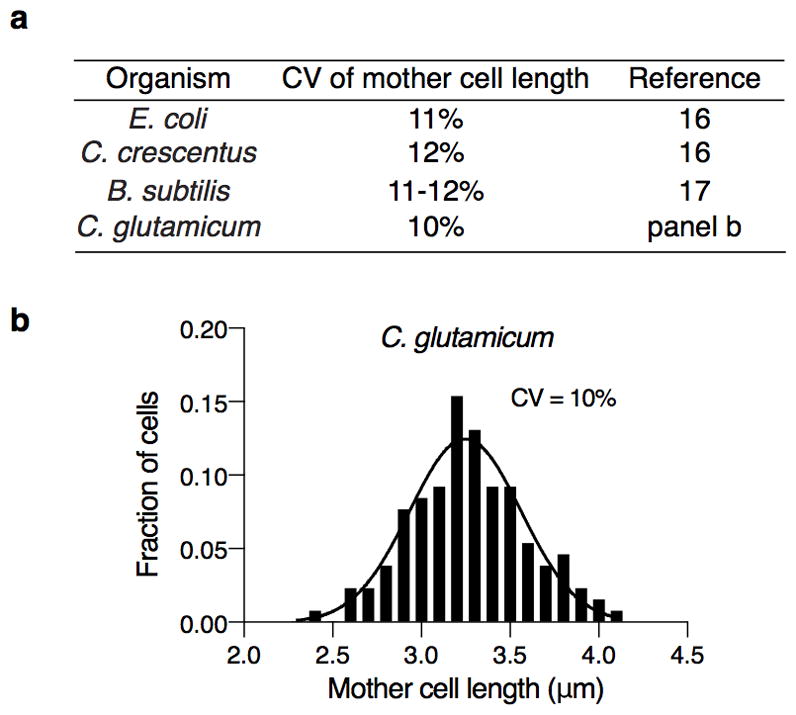
a, The variation in length of cells at the time of division (mother cells) for a variety of rod-shaped bacteria b, Length of 130 C. glutamicum cells prior to division. Black line represents the fit of the data to a Guassian function.
Extended Data Figure 9. The addition of a copy of lamA onto the chromosome under the native promoter complements all phenotypes and restores heterogeneity.
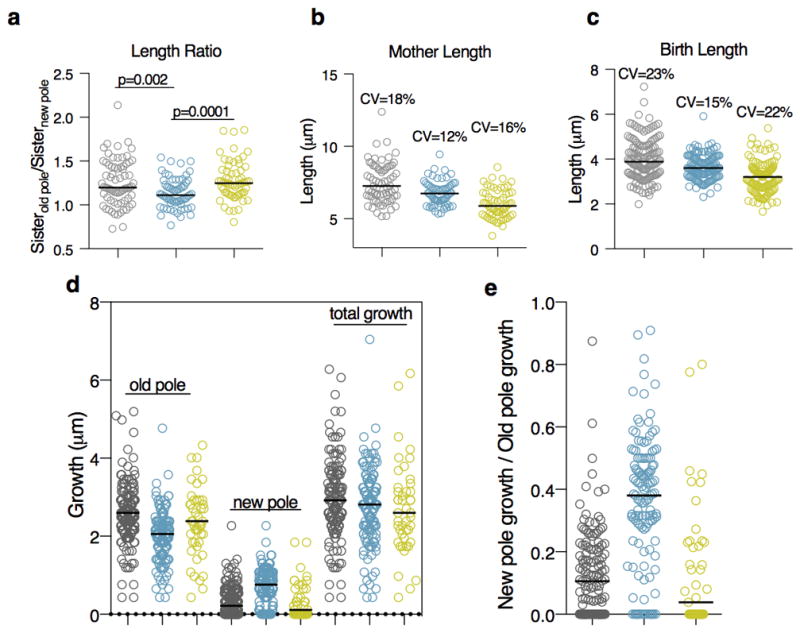
WT (grey), ΔlamA (blue), and complement (yellow). a, Ratio of daughter cells at the time of division (n = 71 sister cell pairs for WT; n=63 sister cell pairs for ΔlamA; n=60 sister cell pairs for complement). The length of cells at the time of b, division (n = 71 cells for WT; n=63 cells for ΔlamA; n=60 cells for complement) and c, birth (n = 142 cells for WT; n=126 cells for ΔlamA; n=120 cells for complement). Using a pulse chase experiment as in Figure 4a and Extended Data 6a, growth at the poles is measured. The absolute values are shown in d, while the ratio of new pole growth to old pole growth is shown in e. (n = 137 cells for WT; n=125 cells for ΔlamA; n=45 cells for complement. Dark black lines represent medians.)
Extended Data Table 1.
MICs of various strains. The MIC (minimum inhibitory concentration) of Msm and Mtb strains used in this study exposed to either vancomycin or rifampicin.
| Strain | Drug | MIC |
|---|---|---|
| Msm (WT) | Rifampicin | 2.5 μg/ml |
| Msm ΔlamA | Rifampicin | 0.625 μg/ml |
| Msm ΔumaA | Rifampicin | 2.5 μg/ml |
| Msm (WT) | Vancomycin | 2.5 μg/ml |
| Msm ΔlamA | Vancomycin | 0.3125 μg/ml |
| Mtb (WT) | Vancomycin | 4.5 μg/ml |
| Mtb ΔlamA | Vancomycin | 0.56 μg/ml |
Supplementary Material
Acknowledgments
We thank B. Glick and I. Fitzgerald (U. Chicago) for the gift of mCherry2B which is a variant of mCherry with modified N- and C-termini, C. Boutte for use of ftsZ-mCherry2B and thoughtful discussion, M. Dragset for the Msm transposon library, C. Araneo and the MBIB flow cytometry facility for assistance with FACS, B. Aldridge, and S. Fortune for help with preliminary microscopy experiments, D. Rudner and T. Bernhardt for access to their microscope, E. Garner, C. Sassetti, and C. Boutte for critical reading of the manuscript, and members of the Rubin lab for helpful suggestions and support. EHR holds a Career Award at the Scientific Interface from BWF. Research reported in this publication was supported by NIAID of the National Institutes of Health under award numbers F32AI104287 to EHR and U19 AI107774 to EJR. The content is solely the responsibility of the authors and does not necessarily represent the official views of the National Institutes of Health.
Footnotes
Supplementary Information is available in the online version of the paper.
Author Contributions: EHR and EJR designed experiments, analysed data, and wrote the paper. EHR performed all microscopy experiments, flow cytometry experiments, the transposon screen, and the immunoprecipitation experiments. REA generated the Mtb strains and performed all Mtb experiments. EHR and REA performed the Msm kill curves. EHR developed all analysis tools including the image analysis tools and the transposon screen analysis. EJR supervised the project.
The authors declare no competing financial interests.
References
- 1.Mitchison DA. Role of individual drugs in the chemotherapy of tuberculosis. The International Journal of Tuberculosis and Lung Disease. 2000;4:796–806. [PubMed] [Google Scholar]
- 2.Aldridge BB, et al. Asymmetry and aging of mycobacterial cells leads to variable growth and antibiotic susceptibility. Science. 2012;335:100–104. doi: 10.1126/science.1216166. [DOI] [PMC free article] [PubMed] [Google Scholar]
- 3.Santi I, Dhar N, Bousbaine D, Wakamoto Y, McKinney JD. Single-cell dynamics of the chromosome replication and cell division cycles in mycobacteria. Nature communications. 2013;4:2470. doi: 10.1038/ncomms3470. [DOI] [PubMed] [Google Scholar]
- 4.Chiu VC, Haynes DH. High and low affinity Ca2+ binding to the sarcoplasmic reticulum: use of a high-affinity fluorescent calcium indicator. Biophysical Journal. 1977;18:3–22. doi: 10.1016/S0006-3495(77)85592-6. [DOI] [PMC free article] [PubMed] [Google Scholar]
- 5.Tiberghien F, Loor F. Ranking of P-glycoprotein substrates and inhibitors by a calcein-AM fluorometry screening assay. Anti-Cancer Drugs. 1996;7:568–578. doi: 10.1097/00001813-199607000-00012. [DOI] [PubMed] [Google Scholar]
- 6.Legrand O, Simonin G, Perrot J, Zittoun R, Marie J. Pgp and MRP Activities Using Calcein-AM Are Prognostic Factors in Adult Acute Myeloid Leukemia Patients. Blood. 1998;91:4480. [PubMed] [Google Scholar]
- 7.Rubin EJ, et al. In vivo Transposition of mariner-Based Elements in Enteric Bacteria and Mycobacteria. Proceedings of the National Academy of Sciences of the United States of America. 1999;96:1645–1650. doi: 10.1073/pnas.96.4.1645. [DOI] [PMC free article] [PubMed] [Google Scholar]
- 8.Niederweis M, et al. Cloning of the mspA gene encoding a porin from Mycobacterium smegmatis. Molecular Microbiology. 1999;33:933–945. doi: 10.1046/j.1365-2958.1999.01472.x. [DOI] [PubMed] [Google Scholar]
- 9.van Kessel JC, Hatfull GF. Recombineering in Mycobacterium tuberculosis. Nature Methods. 2007;4:147–152. doi: 10.1038/nmeth996. [DOI] [PubMed] [Google Scholar]
- 10.Balaban NQ, Merrin J, Chait R, Kowalik L, Leibler S. Bacterial Persistence as a Phenotypic Switch. Science. 2004;305:1622–1625. doi: 10.1126/science.1099390. [DOI] [PubMed] [Google Scholar]
- 11.Brauner A, Fridman O, Gefen O, Balaban NQ. Distinguishing between resistance, tolerance and persistence to antibiotic treatment. Nat Rev Micro. 2016;14:320–330. doi: 10.1038/nrmicro.2016.34. [DOI] [PubMed] [Google Scholar]
- 12.Marmiesse M, et al. Macro-array and bioinformatic analyses reveal mycobacterial ‘core’ genes, variation in the ESAT-6 gene family and new phylogenetic markers for the Mycobacterium tuberculosis complex. Microbiology. 2004;150:483–496. doi: 10.1099/mic.0.26662-0. [DOI] [PubMed] [Google Scholar]
- 13.Kieser KJ, Rubin EJ. How sisters grow apart: mycobacterial growth and division. Nat Rev Micro. 2014;12:550–562. doi: 10.1038/nrmicro3299. [DOI] [PMC free article] [PubMed] [Google Scholar]
- 14.Kieser KJ, et al. Phosphorylation of the Peptidoglycan Synthase PonA1 Governs the Rate of Polar Elongation in Mycobacteria. PLoS pathogens. 2015;11:e1005010. doi: 10.1371/journal.ppat.1005010. [DOI] [PMC free article] [PubMed] [Google Scholar]
- 15.Wakamoto, et al. Dynamic Persistence of Antibiotic-Stressed Mycobacteria. Science. 2013;339:91–95. doi: 10.1126/science.1229858. [DOI] [PubMed] [Google Scholar]
- 16.Campos M, et al. A constant size extension drives bacterial cell size homeostasis. Cell. 2014;159:1433–1446. doi: 10.1016/j.cell.2014.11.022. [DOI] [PMC free article] [PubMed] [Google Scholar]
- 17.Taheri-Araghi S, et al. Cell-size control and homeostasis in bacteria. Current biology : CB. 2015;25:385–391. doi: 10.1016/j.cub.2014.12.009. [DOI] [PMC free article] [PubMed] [Google Scholar]
- 18.Dar Roy D, Hosmane Nina N, Arkin Michelle R, Siliciano Robert F, Weinberger Leor S. Screening for noise in gene expression identifies drug synergies. Science. 2014;344:1392–1396. doi: 10.1126/science.1250220. [DOI] [PMC free article] [PubMed] [Google Scholar]
- 19.Schindelin, et al. Fiji: an open-source platform for biological-image analysis. Nature Methods. 2012;9:676–682. doi: 10.1038/nmeth.2019. [DOI] [PMC free article] [PubMed] [Google Scholar]
- 20.Kieser KJ, et al. Peptidoglycan synthesis in Mycobacterium tuberculosis is organized into networks with varying drug susceptibility. Proceedings of the National Academy of Sciences. 2015;112:13087. doi: 10.1073/pnas.1514135112. [DOI] [PMC free article] [PubMed] [Google Scholar]
Associated Data
This section collects any data citations, data availability statements, or supplementary materials included in this article.
Supplementary Materials
Data Availability Statement
Source data for Figs 2e, 1a, 1b, 4c, and Extended Data 1a, b are provided with the paper. All other data that support the findings of this study are available from the corresponding author(s) upon reasonable request.