

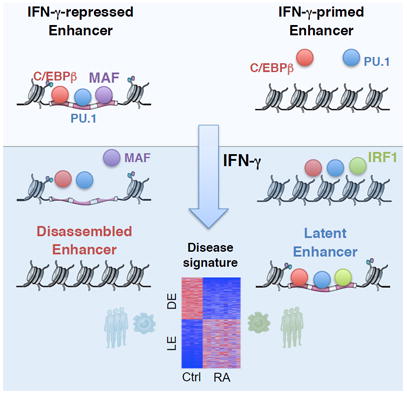
SUMMARY
Mechanisms by which interferon (IFN)-γ activates genes to promote macrophage activation are well studied, but little is known about mechanisms and functions of IFN-γ-mediated gene repression. We used an integrated transcriptomic and epigenomic approach to analyze chromatin accessibility, histone modifications, transcription factor binding, and gene expression in IFN-γ-primed human macrophages. IFN-γ suppressed basal expression of genes corresponding to an ‘M2’-like homeostatic and reparative phenotype. IFN-γ repressed genes by suppressing the function of enhancers enriched for binding by transcription factor MAF. Mechanistically, IFN-γ disassembled a subset of enhancers by inducing coordinate suppression of binding by MAF, lineage-determining transcription factors, and chromatin accessibility. Genes associated with MAF-binding enhancers were suppressed in macrophages isolated from rheumatoid arthritis patients, revealing a disease-associated signature of IFN-γ–mediated repression. These results identify enhancer inactivation and disassembly as a mechanism of IFN-γ-mediated gene repression, and reveal MAF as a regulator of the macrophage enhancer landscape that is suppressed by IFN-γ to augment macrophage activation.
Graphical abstract
INTRODUCTION
Interferon (IFN)-γ enhances host defense and innate immune responses by activation of inflammatory ‘M1’ macrophages via the Jak-STAT1 signaling pathway, which induces expression of various interferon-stimulated genes (ISGs), including chemokines and antigen-presenting, antimicrobial, and antiviral molecules (Hu and Ivashkiv, 2009; Stark and Darnell Jr, 2012). In addition, IFN-γ can prime macrophages for enhanced inflammatory responses by modulating chromatin at cis-regulatory regions of inflammatory genes (Chen and Ivashkiv, 2010), metabolic reprogramming (Cheng et al., 2016; Su et al., 2015), modulation of mRNA translation (Su et al., 2015), and antagonism of interleukin (IL)-4 (Piccolo et al., 2017). In contrast to IFN-γ-induced gene activation, mechanisms of IFN-γ- mediated suppression of gene expression and its functional consequences are poorly understood.
Recent breakthroughs in epigenomic research have enabled the identification of enhancers, distal regulatory elements that control gene expression in a tissue-specific manner (Buecker and Wysocka, 2012). Between 104-105 tissue-specific enhancers are established during development and cell differentiation by lineage-defining ‘master’ or ‘pioneer’ transcription factors that maintain an open chromatin environment and enable enhancer activity either constitutively or in response to environmental cues (Calo and Wysocka, 2013; Glass and Natoli, 2016). Allelic variants associated with autoimmune disease are often found in enhancer regions, supporting the importance of enhancers in gene regulation in disease states (Bernstein et al., 2012; Farh et al., 2015; Maurano et al., 2012). One limitation has been that enhancers have been identified mostly in cell lines or resting primary cells (Bernstein et al., 2012; Maurano et al., 2012; Okada et al., 2014), whereas the function of a substantial proportion of immune cell enhancers (and the allelic variants that they harbor) becomes apparent only after cell activation, including in monocytes and macrophages (Fairfax et al., 2014; Lee et al., 2014). Thus, identification and analysis of stimulus-dependent dynamic changes in enhancers is important for understanding regulation of gene expression in immune cells and the pathogenesis of immune-mediated diseases (Amit et al., 2016; Liddiard and Taylor, 2015; Shalova et al., 2015).
The macrophage enhancer repertoire, or epigenomic landscape, is determined during differentiation predominantly by the lineage-determining transcription factors (LDTFs) PU.1 and C/EBP that open chromatin at enhancer sites (Ghisletti et al., 2010; Glass and Natoli, 2016; Natoli, 2010). Early ideas that a stable, core enhancer repertoire determines macrophage responses to environmental stimuli have been modified by recent findings that subsets of macrophage enhancers are tissue-specific and can be induced de novo by environmental stimuli (Kaikkonen et al., 2013; Ostuni et al., 2013). Tissue-specific macrophage enhancers are generated by cooperation of PU.1 and/or C/EBP with various transcription factors induced by distinct tissue environmental stimuli (Gosselin et al., 2014; Lavin et al., 2014; Okabe and Medzhitov, 2014). Tissue-specific macrophage enhancers exhibit plasticity and are remodeled upon changes in the environment in association with tissue-specific changes in expression of associated genes (Gosselin et al., 2014; Lavin et al., 2014; Okabe and Medzhitov, 2016). Similarly, stimulation of macrophages with activating stimuli can induce de novo formation of a small number (typically < 1000) of latent enhancers mediated by cooperation between LDTFs and stimulus-regulated transcription factors (SRTFs). These stimulation-induced changes in enhancer landscape can be stable and are associated with epigenetic, memory-like phenomena in innate immune cells termed ‘trained immunity’ (Saeed et al., 2014) or ‘short-term memory’ (Monticelli and Natoli, 2013). In contrast to the induction of enhancers, little is known about the deactivation of enhancers and associated changes in gene expression.
In this study, we wished to investigate mechanisms by which IFN-γ represses gene expression and the functions of such genes. We chose to examine IFN-γ-mediated repression in primary human macrophages given the central role of these cells in human inflammatory diseases, including rheumatoid arthritis (RA). We used a genome-wide approach that integrated analysis of chromatin accessibility, histone modifications, transcription factor binding, and gene expression. We found that IFN-γ suppresses expression of genes related to an ‘M2’-like homeostatic and reparative phenotype. Decreased expression of these genes was associated with deactivation of enhancers. IFN-γ-repressed enhancers were enriched for binding sites for the transcription factor MAF, and at a subset of these enhancers IFN-γ induced a coordinate suppression of binding of MAF, lineage-determining transcription factors and chromatin accessibility, a process we term enhancer disassembly. MAF and its M2-like target genes were suppressed in RA synovial macrophages, revealing a disease-associated signature of IFN-γ-mediated repression. Thus, IFN-γ disassembles enhancers to suppress expression of M2-related homeostatic and reparative genes, with MAF emerging as an important regulator of the macrophage enhancer landscape and a mediator of M2 gene expression that is targeted by IFN-γ to augment macrophage activation.
RESULTS
IFN-γ Decreases the Expression of Genes Involved in Homeostatic and Suppressive Functions in Human Macrophages
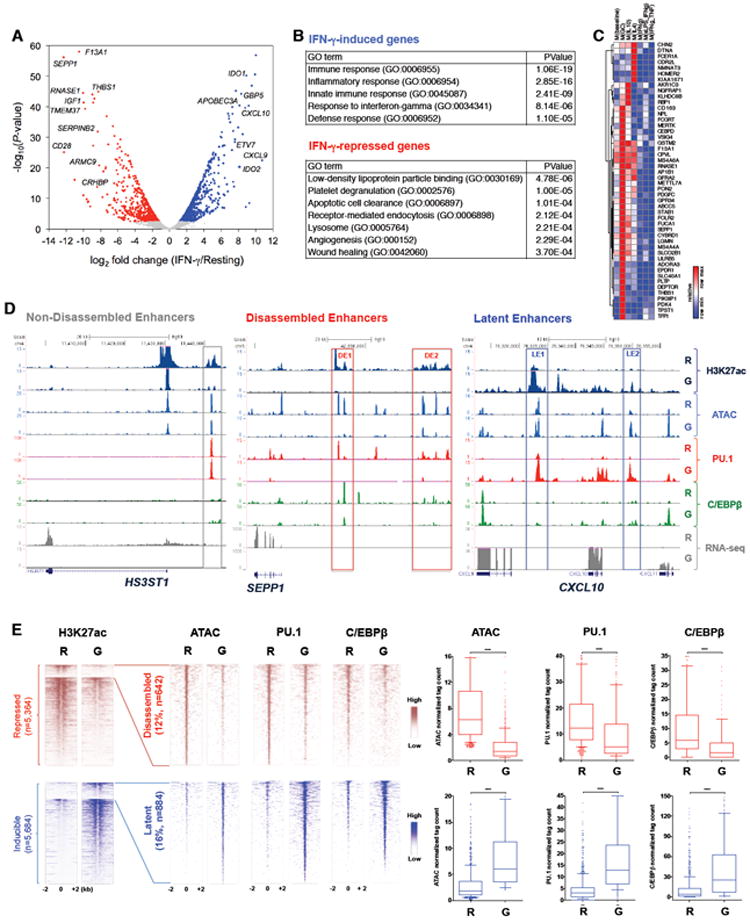
To analyze suppression of gene expression by IFN-γ in depth, we performed RNA sequencing (RNA-seq) analysis of primary human macrophages treated with or without IFN-γ for 48 hr. IFN-γ induced expression of 863 genes (adjusted p < 0.05, >2-fold increase) that corresponded to a classical IFN-γ signature including well known targets of the transcription factors STAT1 and IRF (Figure 1A); gene ontology (GO) and gene set enrichment analysis (GSEA) recovered the well known functions of IFN-γ in immunity and inflammation (Figure 1B and S1A). IFN-γ suppressed the expression of 658 genes (adjusted p < 0.05, >2-fold decrease) (Figure 1A). Bioinformatic analysis revealed that IFN-γ repressed genes with homeostatic and reparative functions related to the M2 macrophage phenotype, and pathways that have anti-inflammatory properties, such as apoptotic cell clearance and PPAR signaling (Figure 1B and S1B). In addition, IFN-γ repressed basal expression of genes that are known to be inducible by the anti-inflammatory factors glucocorticoids (GCs) and IL-10, and to a lesser extent genes inducible by canonical M2/‘alternative activation’ stimulus IL-4 (Xue et al., 2014) (Figure 1C), suggesting that IFN-γ counteracts the induction of these genes. These results indicate that IFN-γ suppresses genes important for homeostatic M2-like macrophage functions, and are supportive of our model (Hu and Ivashkiv, 2009) that inactivation of suppressive pathways by IFN-γ contributes to macrophage priming or activation.
Figure 1. IFN-γ Disassembles Enhancers to Suppress Gene Expression.
Primary human monocytes were cultured in the absence or presence of IFN-γ (100 U/ml) for 2 days.
(A) Volcano plot of transcriptomic changes between resting and IFN-γ-stimulated macrophages; colored dots correspond to genes with significant (FDR-adjusted p < 0.05) and greater than two-fold expression changes.
(B) Gene Ontology (GO) analysis using DAVID 6.8 (Huang et al., 2008).
(C) Heat map showing IFN-γ-repressed genes identified in (A) (rows) that are inducible by the M2-stimuli glucocorticoids, IL-10, and IL-4 based on (Xue et al., 2014) (columns 1-4).
(D) Representative UCSC Genome Browser tracks displaying normalized tag density profiles at enhancers of HS3ST1, SEPP1, and CXCL10 in resting (R) and IFN-γ-primed (G) macrophages. Boxes enclose non-disassembled enhancer (non-DE, left), disassembled enhancers (DEs, middle), and latent enhancers (LEs, right).
(E) Heat maps of H3K27ac, ATAC-seq, PU.1 and C/EBPβ ChIP-seq signals at enhancers that are suppressed (upper panels) or induced (lower panels) by IFN-γ. Left-most heat maps show all enhancers with > 2-fold change in H3K27ac (see also Figure S1E). The right 3 heat maps show the subset of enhancers with > 2-fold change of normalized tag counts for ATAC-seq, PU.1 and/or C/EBPβ signals between resting (R) and IFN-γ-primed (G) macrophages, corresponding to disassembled enhancers (DEs, top) and latent enhancers (LEs, bottom). The box plots indicate normalized tag counts at DEs (upper right panels) and LEs (lower right panels). ****P < 0.0001, paired-samples Wilcoxon signed-rank test.
Data (A-E) is representative of two biological replicates. In D-E each replicate used pooled samples from independent experiments with different donors as described in Figure SI. See also Figure S1.
IFN-γ-mediated Repression of Target Genes is Associated with Enhancer Disassembly
Previous work from our laboratory showed that IFN-γ suppresses acetylation of histone 3 at lysine 27 (H3K27-Ac) at over 7,000 genomic locations (Qiao et al., 2013). H3K27-Ac marks active promoters and enhancers. We therefore tested the hypothesis that IFN-γ suppresses gene expression by acting on enhancers. Following standard practice (Calo and Wysocka, 2013), we defined enhancers as regions of open chromatin (peaks detected by ATAC-seq) that were located more than 1 kb away from transcriptional start sites (TSSs) and bound macrophage lineage-determining factors PU.1 and/or C/EBP in either resting or IFN-γ-stimulated macrophages as determined by ChIP-seq. This analysis identified 21,998 enhancers at which H3K27-Ac peaks were detected in primary human macrophages; these peaks showed strong concordance with DNase-seq peaks (96%, 21,044/21,998) for CD14-positive monocytes identified by the ENCODE project (Figure S1C). They were also concordant with the presence of histone 3 monomethylated at lysine 4 (H3K4me1, an enhancer mark) (97%, 21,293/21,998). Out of this enhancer set, H3K27-Ac tag counts decreased by greater than two-fold after IFN-γ treatment at 5,364 enhancers, increased at 5,684 enhancers, and changed less than two-fold at 10,950 enhancers (Figure S1D). Genome-wide, changes in the amounts of H3K27-Ac on enhancers were closely correlated with changes in IFN-γ-mediated changes in expression of associated genes (Figure S1E). These results suggested that IFN-γ suppresses enhancer activity to decrease gene expression.
We further investigated how IFN-γ deactivates enhancers. The majority (88%) of enhancers with diminished H3K27-Ac after IFN-γ stimulation showed intact PU.1 and C/EBP binding and at least partially preserved open chromatin as assessed by ATAC-seq (Figure S1F, upper panels and S1G); gene tracks for a representative gene HS3ST1 are shown in Figure 1D, left panel. However, a subset (12%) of these enhancers exhibited decreased ATAC-seq tag counts and decreased PU.1 and/or C/EBP binding (Figure 1E, upper panels; gene tracks for representative gene SEPP1 are shown in Figure 1D, middle panel). Results for individual genes were confirmed by FAIRE (Figure 2G and S2J) and ChIP-qPCR assays (data not shown). As expected and serving as positive controls, IFN-γ induced de novo formation of a small number of latent enhancers (Figure 1D and 1E, bottom panels). These results suggest that IFN-γ induces the loss of enhancers associated with loss of binding by LDTFs and closing of chromatin; hereafter we refer to these regions as “disassembled” enhancers (DEs). DEs showed minimally lower basal H3K27-Ac relative to non-DEs, but both enhancer types showed a comparable decrease in amounts of H3K27-Ac after IFN-γ stimulation (Figure S1H).
Figure 2. IFN-γ Suppresses Function of Enhancers Associated with M2 genes.
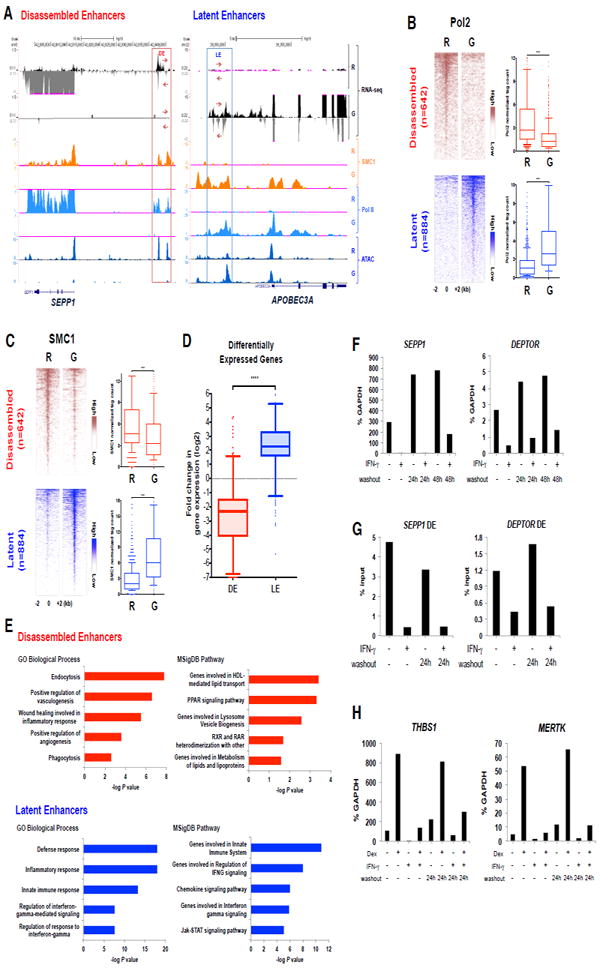
(A) Representative Genome Browser tracks showing strand-specific RNA transcripts, cohesin (SMC1) occupancy, RNA polymerase II (Pol II) occupancy, and open chromatin (ATAC) at enhancers of SEPP1 and APOBE. Boxes enclose disassembled enhancer (DE, left) and latent enhancer (LE, right). Data are representative of one donor (RNA-seq), two replicates (SMC1, ATAC-seq), and pooled data from two donors (Pol II).
(B and C) Heat maps of normalized tag densities for Pol II (B) and SMC1 (C) ChIP-seq at disassembled enhancers and latent enhancers in resting (R) and IFN-γ-primed (G) macrophages. ****P < 0.0001, paired-samples Wilcoxon signed-rank test. Data are representative of (B) pooled data from two donors and (C) two replicates.
(D) Box plots of the fold change in gene expression after IFN-γ treatment for the nearest differentially expressed genes (within 100 kb) from disassembled (DE) or latent (LE) enhancers. ****P < 0.0001 by Welch’s t-test.
(E) Functionally enriched Gene Ontology (GO) and MSigDB pathway categories of genes assigned to disassembled enhancers (upper panel) or latent enhancers (lower panel).
(F) RT-qPCR analysis of the DE-associated genes SEPP1 and DEPTOR in macrophages cultured with or without IFN-γ for 48 hr, followed by washout and incubation in fresh medium for 24 hr or 48hr.
(G) FAIRE analysis of disassembled enhancers in macrophages cultured as in (F).
(H) RT-qPCR analysis of the DE-associated, GC-inducible genes THBS1 and MERTK. Cells were cultured as in (F), except dexamethasone (Dex) was added 3 hr prior to harvesting.
Data (F – H) are representative of two experiments. See also Figure S2 and Table S1-S2.
IFN-γ Suppresses the Function of Enhancers Associated with M2 genes
Functional activity of enhancers is associated with RNA polymerase II (Pol II)-mediated transcription of enhancer RNA (eRNA), interaction of enhancers with gene promoters via DNA loops, and transcription of associated genes. IFN-γ suppressed eRNA expression concomitantly with suppression of mRNA transcripts in the associated gene body at representative IFN-γ-inhibited genes (Figure 2A, left panel, tracks 1 and 2). This pattern of eRNA regulation was confirmed for select genes by qPCR (data not shown). Given weak eRNA signals relative to background, we were not able to perform genome-wide eRNA analysis; instead we used the alternative approach of measuring Pol II occupancy at enhancers using ChIP-seq. IFN-γ suppressed Pol II occupancy at disassembled enhancers, while increasing Pol II occupancy at latent enhancers (Figure 2A, tracks 5,6, and 2B). Similar results were obtained when only intergenic enhancers, > 2 kb upstream from TSSs, were analyzed (Figure S2A). A growing body of evidence supports that cohesin is recruited to active enhancers to mediate looping with promoters, and cohesin occupancy can serve as a surrogate for active enhancers engaged with gene promoters (Kagey et al., 2010). We found that IFN-γ reduced occupancy of the cohesin subunit SMC1 at disassembled enhancers, while increasing SMC1 occupancy at induced latent enhancers (Figure 2A and 2C); results at select genes were confirmed by ChIP-qPCR (data not shown). In contrast to disassembled enhancers, SMC1 occupancy was not substantially altered at the vast majority of enhancers where H3K27-Ac and Pol II signals decreased but PU.1/C/EBP binding remained intact, suggesting that significant reduction of cohesin binding is a feature of disassembled enhancers (Figure S2B - S2D). Collectively, the results indicated that enhancers that are disassembled after IFN-γ treatment (Figure 1E) are functionally deactivated (Figure 2A-2C), and suggested that expression of associated genes would be decreased by IFN-γ. Indeed, expression of genes associated with disassembled enhancers was decreased comparably to the increased expression of genes associated with IFN-γ-induced latent enhancers (Figure 2D; gene lists are provided in Table S1 and S2). Genes associated with DEs were more strongly suppressed than genes associated with non-DEs (Figure S2E). We also found that 23% of DE genes, 7.5% of non-DE genes and 1.9% of genes not associated with these enhancers are repressed by IFN-γ, further linking the regulation of these enhancers with repression. As expected, Genomic Regions Enrichment of Annotations Tool (GREAT) and GO analysis (McLean et al., 2010) of genes associated with induced latent enhancers showed enrichment for genes involved in classic IFN-γ functions, such as host defense, inflammation, and innate immunity (Figure 2E). In contrast, genes associated with DEs showed enrichment for homeostatic and reparative functions related to M2 phenotypes, and for suppressive pathways such as PPAR signaling (Figure 2E, upper panels, and S2F). Although the mechanisms of enhancer suppression differed, non-DE genes were similarly enriched in M2-related functions (Figure S2G). 80% (80/100) of DE genes also were associated with a non-DE (Figure S2H), suggesting that IFN-γ can repress genes by targeting more than one gene-associated enhancer by distinct mechanisms.
We next tested whether enhancer disassembly had a role in the epigenetic, ‘short term memory’ that maintains IFN-γ-mediated gene repression or confers refractoriness to induction by suppressive stimuli. IFN-γ-induced gene repression was stably maintained for at least 24-48 hr after removal of IFN-γ (Figure 2F and S2I). In accord, closing of chromatin at DEs, as assessed by FAIRE, was also stably maintained after IFN-γ removal (Figure 2G and S2J). Finally, several GC-inducible genes that were repressed by IFN-γ were refractory to induction by the GC dexamethasone, including after IFN-γ removal (Figure 2H and S2K). These results provide support for the concept of ‘short term memory’ in the regulation of DE-associated genes.
Promoters of Genes Repressed by IFN-γ Maintain Open Chromatin
Promoters can maintain an open chromatin architecture across different cell types and activation states, whereas enhancers are more cell-type specific. Thus, we wished to compare the effects of IFN-γ on enhancers and promoters of IFN-γ-suppressed genes to determine whether IFN-γ preferentially targets enhancers. Despite a decrease in expression (Figure 2D), there was only a modest change in chromatin accessibility at the promoters of genes suppressed by IFN-γ via enhancer disassembly, as assessed by ATAC-seq (Figure 3A) and minimal change in binding of PU.1 and C/EBPβ (Figure 3B). Consistent with decreased gene expression, there was a modest decrease in Pol II occupancy but the H3K27-Ac and H3K4me3 marks that are associated with open chromatin were maintained after IFN-γ treatment (Figure 3C and S3A); H3K4me3 is present preferentially at promoters relative to enhancers. Moreover, in contrast to disassembled enhancers, SMC1 occupancy at DE-associated promoters was maintained after IFN-γ stimulation (Figure S3B). Representative gene tracks of DE-associated promoters are shown in Figure 3D and S3C. We then extended our analysis to all IFN-γ-repressed promoters, using the same approach as described above for enhancers. Out of 658 repressed genes, only 3 promoters satisfied the full criteria for disassembly, as defined by loss of H-Ac, LDTFs, and chromatin accessibility (Figure 3E). However, 9% of promoters of repressed genes met the relaxed criteria of decreased H3K27-Ac amounts and chromatin accessibility as assessed by ATAC-seq tag counts, while PU.1 and C/EBP binding were preserved, a category we term “partially closed” (Figure 3E and 3F). Expression of genes associated with partially closed promoters was decreased as compared to that of genes that maintained promoter accessibility (Figure S3E); 24% (15/62) of genes associated with partially closed promoters were associated with DEs. These results are consistent with differential regulation of enhancers and promoters by IFN-γ.
Figure 3. Promoters of Genes Repressed by IFN-γ Maintain Open Chromatin.

(A) Distribution of average ATAC-seq signal at DE-associated promoters (red, upper panel) or LE-associated promoters (blue, lower panel) in resting (R, dotted line) and IFN-γ-stimulated (G, solid line) macrophages.
(B) Distribution of average ChIP-seq signal of PU.1 (left) and C/EBPβ (right) at DE-associated promoters (red, upper panels) or LE-associated promoters (blue, lower panels).
(C) Distribution of average ChIP-seq signal of H3K27ac (left) and H3K4me3 (right) at DE-associated promoters (red, upper panels) or LE-associated promoters (blue, lower panels).
(D) Representative UCSC Genome Browser tracks showing normalized read tag density. Boxes enclose promoters of genes associated with disassembled enhancer (DE, left) and latent enhancer (LE, right).
(E) Schematic for defining partially closed and disassembled promoters based on H3K27ac, PU.1 and C/EBPβ ChIP-seq, and ATAC-seq.
(F) Heat maps of normalized tag densities for H3K27ac ChIP-seq (left) and ATAC-seq (right) at promoters of IFN-γ-repressed genes. Promoters with > 2-fold decreases are shown at top (red). Quantitation of fold change in normalized H3K27ac tag counts is shown below (green). ****P < 0.0001, paired-samples Wilcoxon signed-rank test.
Data (B-F) are representative of two replicates. Each replicate used pooled samples from independent experiments with different donors. See also Figure S3.
Identification of Candidate TFs that Regulate Disassembled Enhancers
TF repertoires change dynamically during differentiation or upon stimulation, and changes in their expression have an important role in remodeling of the enhancer landscape (Saeed et al., 2014; Tsankov et al., 2015). In macrophages, TFs induced by environmental cues cooperate with PU.1 and C/EBP to induce de novo enhancer formation. We therefore hypothesized that IFN-γ disassembles enhancers by suppressing TFs that are required to cooperate with PU.1 and/or C/EBP to form these enhancers. To identify candidate TFs, we combined analysis of IFN-γ-induced changes in primary human macrophage TF repertoire with identification of TF binding motifs enriched in IFN-γ-regulated enhancers. Among 72 TFs whose expression, as measured by mRNA transcripts, was changed by >2-fold upon IFN-γ treatment, expression of 26 TFs decreased and that of 46 TFs increased (Figure 4A-4C). Motif analysis of de novo induced enhancers showed enrichment of IRF-binding motifs, consistent with a previous report in mouse macrophages (Ostuni et al., 2013). In contrast, the MAF-binding motif was overrepresented at disassembled enhancers (p = 1e-45), with some enrichment of AP-1 and MEF2-binding motifs (Figure 4D). The MAF-binding motif was also overrepresented at non-DEs, which in addition showed enrichment of RUNX-binding motifs (Figure S4A), but not at repressed promoters (Figure S3F). At DEs, MAF motifs were preferentially co-enriched with both PU.1 and C/EBP motifs, while IRF motifs were co-enriched only at LEs (Figure 4E). The motif analysis, together with IFN-γ-mediated decrease of MAF expression (Figure 4A-4C), strongly suggested a role for MAF in marking and possibly maintaining a subset of enhancers in resting macrophages that is lost upon IFN-γ stimulation.
Figure 4. Candidate Transcription Factors that Mediate Regulation of Enhancers by IFN-γ in Human Macrophages.

(A) Heat maps of expression (log2 FPKM) of transcription factors (TFs) repressed (left) or induced (right) more than 2-fold by IFN-γ.
(B) Volcano plot of changes in expression of transcription factors; colored dots correspond to genes with significant (FDR-adjusted p < 0.05) and greater than two-fold expression changes.
(C) MAF mRNA was measured by RT-qPCR and normalized relative to GAPDH mRNA. Data are presented as mean ± SEM of seven independent experiments. **P = 0.0015, two-tailed paired t-test.
(D) Most significantly enriched transcription factor (TF) motifs identified by de novo motif analysis using HOMER (Heinz et al., 2010).
(E) Distribution plots of motif frequencies (y-axis) for the indicated motifs within 1000 bp centered on the ATAC-seq peak summit.
(F) Repressed enhancers (>2-fold decrease in H3K27ac tag counts in response to IFN-γ) are plotted in an increasing order of H3K27ac signal.
(G) The MAF locus displays loss of a large cluster of H3K27ac and ATAC-seq signals.
Data (A, B, D-G) is representative of two replicates. Each replicate used pooled samples from independent experiments with different donors. See also Figure S4.
We use computational analysis of H3K27-Ac ChIP-seq data as previously described (Gosselin et al., 2014; Hnisz et al., 2013; Witte et al., 2015) to identify genes associated with IFN-γ-regulated super-enhancers (SEs). SEs are clusters of active enhancers and are associated with genes important for cell identity and function. MAF was associated with a SE that harbors multiple H3K27-Ac and ATAC-seq peaks and was effectively abolished by IFN-γ treatment (Figure 4F, 4G and S4B-D). These results support an important functional role for MAF in macrophage biology, possibly by regulating enhancer formation.
IFN-γ Coordinately Suppresses MAF, PU.1 and C/EBP Occupancy at Disassembled Enhancers
The combined gene expression, binding motif, and SE analysis suggested a role for MAF in maintaining enhancers in resting macrophages that then become disassembled when IFN-γ decreases MAF occupancy. In accord with this notion, IFN-γ abolished MAF occupancy at the SEPP1 DE (Figure 5A). ChIP-seq analysis revealed that MAF occupied the majority (77%, 492/642) of DEs, and also the majority of non-DEs (67%, 3202/4722) in resting macrophages (Figure 5B and S5A), but only bound to a much smaller fraction (6.7%) of enhancers that exhibited no change upon IFN-γ treatment. Consistently, the MAF motif was enriched only at MAF-bound DEs and IFN-γ-regulated non-DEs (Figure 5C and S5B). MAF was depleted from 69% (338 out of 492) of MAF-binding DE (Figure 5B) and 62% (1966 out of 3172) of MAF-binding non-DEs (Figure S5A and S5C). The peak summits of MAF, PU.1 and C/EBP binding coincided, and also coincided with the summits of ATAC-seq peaks, which we define as the center of an enhancer (Figure 5D). IFN-γ induced a coordinate decrease in MAF, PU.1 and C/EBP binding, which coincided with strongly diminished ATAC-seq tag density, indicative of closing of chromatin (Figure 5E). The coincident binding in resting macrophages, and coordinate loss of binding after IFN-γ treatment of MAF, PU.1 and C/EBP is illustrated in gene tracks for representative SEPP1, DEPTOR and THBS1 DEs in Figure 5F. These gene tracks also illustrate the relationship of MAF binding to H3K27-Ac, SMC1 and Pol II, and the coordinate loss of these signals after IFN-γ treatment. Together, our findings suggest that at DEs, IFN-γ reduced MAF binding with concomitant destabilization of PU.1 and C/EBP binding, decrease of chromatin accessibility, and loss of enhancer function at disassembled enhancers.
Figure 5. IFN-γ Coordinately Suppresses MAF, PU.1 and C/EBP Occupancy at Disassembled Enhancers.
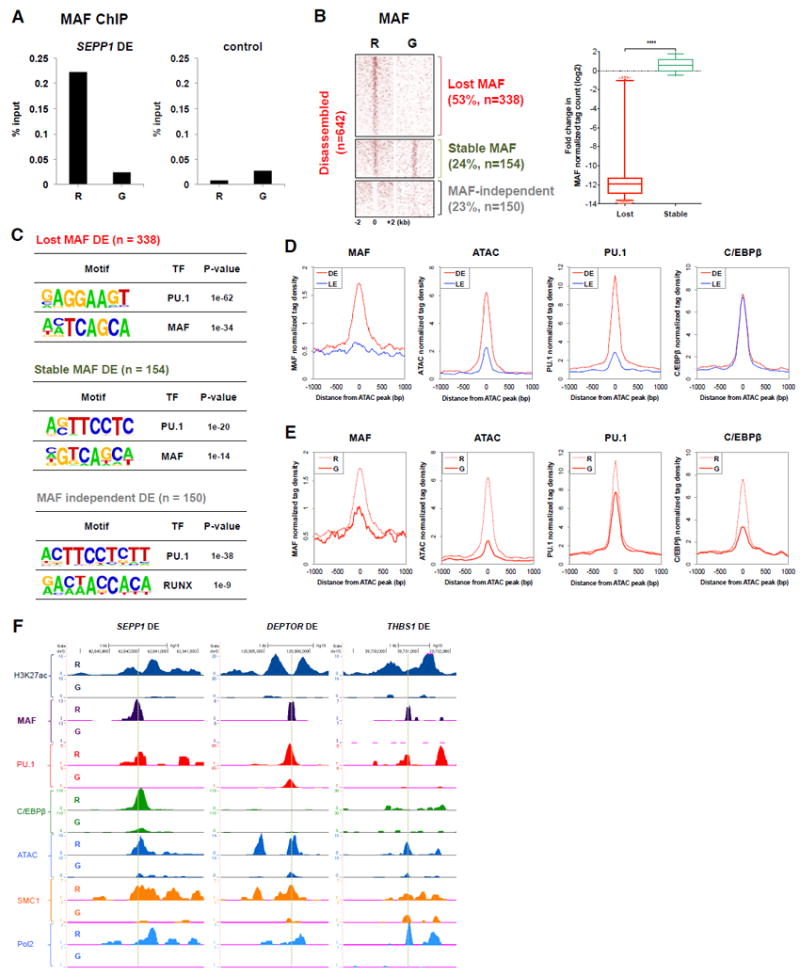
(A) ChIP-qPCR of MAF at the disassembled enhancer of SEPP1. Data are representative of three independent experiments.
(B) Heat map of normalized tag counts for MAF ChIP-seq at DEs in resting (R) and IFN-γ-primed (G) macrophages; enhancers are segregated into groups of enhancers where MAF binding was lost, stable or not detected (independent). The box plot shows the fold changes in normalized tag counts for enhancers where MAF binding was lost or stable. **** P < 0.0001, by Welch’s t-test.
(C) Most significantly enriched transcription factor (TF) motifs identified by de novo motif analysis using HOMER (Heinz et al., 2010) at enhancers where MAF binding was lost, stable or not detected.
(D) Distribution plots of average signal of ChIP-seq and ATAC-seq in resting macrophages.
(E) Distribution of average signal of ChIP-seq and ATAC-seq at disassembled enhancers.
(F) Representative UCSC Genome Browser tracks from ChIP-seq and ATAC-seq experiments.
Data (B) represents pooled samples from three independent experiments with different donors and in (D-F) ATAC, PU.1, SMC1, and C/EBP data is representative of two replicates. See also Figure S5.
In contrast to MAF, DEs bound low amounts STAT1 and IRF1, transcription factors that bind directly to enhancers and LEs in response to IFN-γ (Ostuni et al., 2013) (Qiao et al., 2013); STAT1 and IRF1 occupancy minimally increased at DEs after IFN-γ stimulation (Figure S5D-S5E). These results argue against a direct regulation of DEs by STAT1 and support an indirect mechanism of IFN-γ action via suppression of MAF and possibly other IFN-γ-repressed TFs. Thus, the mechanisms of induction of latent enhancers and suppression of DEs are distinct.
Regulation of IFN-γ-suppressed M2-like Genes by MAF
To directly implicate MAF in the regulation of IFN-γ-suppressed M2-like genes, we combined a loss-of-function approach using RNA interference (RNAi) with a gain-of-function approach using forced expression. RNAi of MAF in primary human macrophages decreased expression of several DE-associated and other M2-like genes (Figure 6A, S6A and S6B). RNA-seq analysis identified 138 genes whose expression was dependent on MAF in a non-redundant manner, which included MAF-binding DE genes (Figure 6B and 6C). RNAi of MAF decreased the expression of IFN-γ-repressed genes, but not that of genes insensitive to IFN-γ regulation; the expression of genes associated with DEs was more significantly decreased upon MAF RNAi than that of genes linked with non-disassembled enhancers or other IFN-γ-repressed genes (Figure 6D, S6C and S6D). In addition, expression of MAF-bound, DE-associated genes was more strongly suppressed as compared to MAF-bound, non-DE-associated genes (Figure S6D, right panel). These data suggest a non-redundant role for MAF in the expression of a subset of IFN-γ-repressed genes, and that MAF is largely dedicated to the expression of genes that are susceptible to repression.
Figure 6. MAF Promotes Expression of M2 Genes that are Repressed by IFN-γ.

(A) RT-qPCR analysis of MAF mRNA normalized relative to GAPDH mRNA in macrophages transfected with control or MAF-specific RNA interference (RNAi). Data show mean ± SEM from eight independent experiments. **P = 0.0024 by two-tailed paired t-test.
(B) Volcano plot of RNA-seq analysis comparing macrophages transfected with control and RNAi of MAF. Colored dots correspond to significant (p < 0.05) changes in gene expression.
(C) Heat map showing relative expression of representative DE-associated genes that were significantly downregulated by RNAi of MAF (p < 0.05).
(D) RNAi of MAF preferentially affects expression of IFN-γ-repressed and DE-associated genes. Box plots show fold change in gene expression after RNAi of MAF in resting human macrophages. ****P < 0.0001 and *P = 0.0141 by Welch’s t-test.
(E) FAIRE analysis of disassembled enhancers in resting macrophages treated with control or MAF-specific RNAi. A constitutively closed chromatin region identified by ATAC-seq data was used as a control. Data are representative of two independent experiments.
(F) RT-qPCR analysis of MAF mRNA normalized relative to GAPDH mRNA in resting or IFN-γ-stimulated human macrophages transduced with control (AdGFP) or MAF-expressing adenoviral particles (AdMAF). Data are presented as mean ± SEM of six independent experiments. *P = 0.0112 and **P = 0.003 by two-tailed paired t-test.
(G) Volcano plot of RNA-seq analysis comparing IFN-γ-stimulated human macrophages transduced with control or MAF-expressing adenoviral particles. Purple dots correspond to significantly upregulated genes (p < 0.05).
(H) Heat map showing relative expression of representative DE-associated genes that are significantly upregulated by MAF overexpression (p < 0.05).
(I) Ectopic MAF expression preferentially affects expression of IFN-γ-repressed and DE-associated genes relative to non-DE-associated genes. Box plots show fold change in gene expression after MAF expression in IFN-γ-stimulated human macrophages. ****P < 0.0001 and *P = 0.0225 by Welch’s t-test.
(J) FAIRE analysis of disassembled enhancers (DEs) in resting and IFN-γ-stimulated macrophages transduced with control or MAF-expressing adenoviral particles. Control = constitutive closed region. The CXCL10 latent enhancer represents an additional control. Data are representative of two independent experiments. See also Figure S6.
We next tested whether the loss of MAF could contribute to disassembly of enhancers. MAF RNAi decreased chromatin accessibility at 15 out of 24 DEs that were tested by FAIRE assays (Figure 6E and S6E). These results suggest that MAF plays a role in maintaining chromatin accessibility at a subset of DEs, but that it is redundant at other DEs where additional transcription factors that are decreased by IFN-γ may play a role.
We analyzed gene expression when MAF expression was reconstituted in IFN-γ-treated macrophages using adenoviral transduction. Ectopic MAF expression prevented the decrease in expression of a subset of IFN-γ-repressed genes (Figure 6F and S6F). RNA-seq analysis showed that MAF significantly prevented IFN-γ-mediated repression of 228 genes, which included genes associated with as well as genes not associated with DEs (Figure 6G-6I, and S6G and S6H). Ectopic expression of MAF had a larger impact on the expression of IFN-γ-repressed genes than that of non-repressed genes, and on that of genes associated with DEs than on non-DE genes, supporting selectivity of MAF function on genes repressed by IFN-γ (Figure 6I and S6H). ImmuNet analysis (Gorenshteyn et al., 2015) revealed that MAF was functionally connected to DE-associated genes and other IFN-γ-suppressed genes characteristic of the M2 macrophage phenotype (Figure S6J). In accord with the gene expression results, ectopic MAF expression nearly completely reversed IFN-γ-mediated closing of chromatin at 10 out of 18 enhancers tested, and had partial effects at the other 8 (Figure 6J and S6I). Collectively, these results suggest that MAF expression is sufficient to maintain open chromatin and prevent repression of a subset of IFN-γ-repressed genes, especially those associated with DEs.
Low MAF Expression and a ‘Negative IFN-γ Signature’ in RA Synovial Macrophages
An ‘IFN-γ signature’ consisting of elevated expression of STAT1 target genes has been linked with pathogenesis of several autoimmune diseases including RA, and is observed upon gene expression analyses of RA synovial (joint) tissue and macrophages (Hu et al., 2008). We wished to test whether a gene expression signature corresponding to IFN-γ-mediated suppression of transcription is also present in RA synovial macrophages. We used gene set enrichment analysis (GSEA) of transcriptomic data to compare RA synovial (Donlin et al., 2014) (GSE97779) and control macrophages. As expected, expression of IFN-γ-induced genes was increased in RA synovial macrophages relative to control macrophages (Figure 7A, top panel). The expression of IFN-γ-repressed genes was decreased in RA synovial macrophages relative to control macrophages (Figure 7A, bottom panel), which we term a ‘negative IFN-γ signature’. RA synovial macrophages showed significantly lower amounts of MAF mRNA and higher amounts of STAT1 and IRF1 transcripts as compared to control macrophages (Figure 7B). This result prompted us to analyze RA synovial macrophage expression of DE-associated genes (marked by MAF) and LE-associated genes (marked by STAT1 and IRF1). The expression of 83% (58/70) of DE-associated genes was decreased in RA synovial macrophages relative to control macrophages, whereas the expression of 92% (73/79) of LE-associated genes was increased in RA synovial macrophages (Figure 7C). Representative DE- and LE-associated genes differentially expressed in RA synovial macrophages are displayed in the heat maps in Figure 7D. These findings support the pathophysiological relevance of IFN-γ-mediated suppression of MAF and downstream gene expression.
Figure 7. Low MAF Expression and ‘Negative IFN Signature’ in RA Synovial Macrophages.

(A) Gene set enrichment analysis (GSEA) of IFN-γ-regulated gene sets (Figure 1A) against ranked list of genes upregulated in RA synovial macrophages.
(B) Scatterplot of gene expression of MAF, IRF1, and STAT1 in RA synovial macrophages (n = 9) versus control macrophages (n = 5). Data are presented as mean ± SD. *** P < 0.001 and **** P < 0.0001, unpaired Student’s t-test.
(C) Scatterplot of relative expression of RA-related genes (defined as genes whose expression is changed >2-fold in RA relative to control macrophages (p < 0.05)) that correspond to DE-associated genes (red) or LE-associated genes (blue). 0 (log2) is defined as expression level in control macrophages. **** P < 0.0001, unpaired Student’s t-test.
(D) Heat maps of RA-related genes that correspond to DE-associated genes (left panel) or LE-associated genes (right panel).
DISCUSSION
Although it has been long known that IFN-γ broadly suppresses gene expression in macrophages (Ehrt et al., 2001), the functions of IFN-γ-repressed genes and mechanisms of repression are mostly unknown. Our study reveals that in parallel to the well-known induction of immune genes, IFN-γ also suppresses genes with homeostatic, reparative, and anti-inflammatory functions. Whereas repression of these genes can augment host defense and sustain inflammation, it may also contribute to failure of resolution of inflammation and aberrant tissue remodeling and repair in chronic inflammatory diseases such as RA (McInnes and Schett 2011). Our findings identify inactivation and disassembly of enhancers as a mechanism by which IFN-γ suppresses gene expression. This disassembly is accomplished by suppressing expression and binding of MAF to a subset of IFN-γ-regulated enhancers, with concomitant loss of LDTFs and chromatin accessibility. MAF is an important regulator of M2 genes that is suppressed during RA and functions at least in part by maintaining enhancer function. These results provide insight into mechanisms and functional consequences of IFN-γ-mediated gene repression in macrophages.
Although enhancer formation and activation have been extensively studied, less is known about mechanisms of enhancer de-activation. Previous work mostly performed in non-immune cell types has highlighted active repressive mechanisms, whereby transcriptional repressors recruit corepressor complexes that contain enzymes that diminish enhancer activity by removing positive histone marks, or by depositing negative histone marks (Perissi et al., 2010; Whyte et al., 2012) (Lam et al., 2013). In contrast, we found that repression of enhancers by IFN-γ was mediated by loss of a key enhancer-binding transcription factor, MAF, which is accompanied by decreased LDTF binding, closing of chromatin, and enhancer disassembly. In contrast to changes in histone marks that are readily and quickly reversible, re-assembly of an enhancer would take longer as re-assembly would require synthesis of the relevant transcription factor(s) such as MAF and remodeling of closed chromatin (Buecker et al., 2014; Heinz et al., 2015). In accord with this notion, we found that IFN-γ-mediated repression of DE genes was stable and resistant to induction by glucocorticoids. This is consistent with a concept of ‘short term memory’ whereby loss of enhancers that mediate gene induction by macrophage-deactivating stimuli, such as IL-10, IL-4 and glucocorticoids, can result in refractoriness of genes to induction by these M2 stimuli and may affect macrophage polarization states.
Disassembly of enhancers can account for suppression of approximately 15% of the 658 genes that were downregulated by IFN-γ, indicating that additional mechanisms contribute to IFN-γ-mediated gene repression. One such mechanism may be related to downregulation of histone acetylation at non-disassembled enhancers, which occurred broadly at more than 5000 enhancers and was associated with decreased gene expression. IFN-γ-induced deacetylation of enhancers could be mediated by recruitment of HDAC-containing corepressor complexes, but initial ChIP-qPCR experiments have not detected recruitment of corepressors (data not shown). Another possibility is that IFN-γ induces deposition of negative histone marks. However, genome-wide analysis revealed very limited targeting of promoters (Qiao et al., 2016), but not enhancers, by the negative mark H2K27me3 and no clear changes in H3K9me3 after IFN-γ treatment. Overall, our findings identify one mechanism by which IFN-γ represses functionally important genes, and open lines of investigation into mechanisms of target gene repression by IFNs and cytokines that utilize the Jak-STAT signaling pathway.
MAF has a well-established role in adaptive immunity, where it promotes the differentiation and function of Th2, Tr1 and TFH cells, and expression of type 2 and suppressive cytokines (Apetoh et al., 2010; Liu et al., 2013; Pot et al., 2011) (Cao et al., 2005; Liu et al., 2013; Pot et al., 2011). In embryonic stem cells and mouse macrophages, MAF (together with related MAFB) suppress expression of self-renewal genes (Aziz et al., 2009; Soucie et al., 2016). Our findings identify a distinct function and mechanism of action for MAF, namely binding to and maintaining the activity of a unique subset of macrophage enhancers, thereby promoting the expression of a subset of M2 genes. This M2-like function of MAF in macrophages is consonant with its function in promoting IL-4 and IL-10 expression in T cells, and with a previous report implicating MAF in Il10 induction in mouse macrophages (Cao et al., 2002). This finding is also in line with a recent report that the MAF motif is enriched in a panel of IL-4-induced enhancers that were sensitive to inhibition by IFN-γ (Piccolo et al., 2017). Notably, MAF binding was most closely associated with enhancers that were disassembled after IFN-γ stimulation, and thus MAF occupancy can serve as a ‘mark’ for enhancers that are targeted by IFN-γ. Overall, our findings indicate a key and non-redundant role for MAF in a subset of IFN-γ-regulated genes, and implicate downregulation of MAF as an important component of the IFN-γ response in human macrophages.
However, transcriptomic analysis of macrophages in which MAF was silenced or ectopically expressed made clear that MAF is redundant for maintaining gene expression and open chromatin at distinct subsets of IFN-γ-repressed genes. It is likely that other transcription factors whose expression is maintained in IFN-γ-stimulated macrophages are sufficient to promote enhancer accessibility and expression of these genes. The transcriptomic results, together with analysis of DEs, non-DEs, promoters, and MAF ChIP-seq suggest a complex model for MAF function in human macrophages: 1. MAF plays a nonredundant role in maintaining open chromatin and gene expression in a subset of DEs and IFN-γ-repressed genes. 2. MAF promotes expression of other DE and non-DE genes but is redundant for maintaining open chromatin. 3. MAF is functionally linked to IFN-γ-repressed enhancers and associated genes and has little role in expression of non-repressed genes and genes not regulated by IFN-γ. Although MAF is linked to IFN-γ-mediated repression in human macrophages, it regulates only a subset of IFN-γ-repressed genes and functions in the context of a complex IFN-γ-induced gene expression program that modulates expression of multiple transcription factors. In other cell types, MAF cooperates with various transcription factors, including AhR, Blimp1, Bcl6, Id2, IRF4, KLFs, and MAFB to regulate target gene expression. Interestingly, some of these and closely related transcription factors, namely Id2, Id3, IRF4, KLF2, and MAFB were co-regulated with MAF after IFN-γ stimulation. This suggests that IFN-γ may downregulate a network of functionally related transcription factors that cooperate to promote expression of genes that are repressed by IFN-γ.
In summary, our study provides insights into the functional consequences of IFN-γ-induced gene repression and into underlying mechanisms that suppress the function and induce the loss of a subset of the constitutive enhancer repertoire in human macrophages. These findings have implications for understanding how gene expression is regulated in IFN-γ-driven immune responses and diseases states, and can potentially be therapeutically modulated. This work opens avenues of investigation into the poorly understood mechanisms by which cytokines repress gene expression.
STAR Methods
CONTACT FOR REAGENT AND RESOURCE SHARING
Further information and requests for resources and reagents should be directed to and will be fulfilled by the Lead Contact, Lionel B. Ivashkiv (ivashkivl@hss.edu).
EXPERIMENTAL MODEL AND SUBJECT DETAILS
Cell Culture
Peripheral blood mononuclear cells were obtained from blood leukocyte preparations purchased from the New York Blood Center by density gradient centrifugation with Ficoll (Thermo Fisher Scientific) using a protocol approved by the Hospital for Special Surgery Institutional Review Board (IRB #93145). Primary human CD14+ Monocytes were obtained from peripheral blood, using anti-CD14 magnetic beads, as recommended by the manufacturer (Miltenyi Biotec) as previously described (Hu et al., 2002). Monocytes were cultured in RPMI 1640 medium (Invitrogen) supplemented with 10% heat-inactivated defined FBS (HyClone Fisher), penicillin/streptomycin (Invitrogen), L-glutamine (Invitrogen), and 10 ng/ml human macrophage colony-stimulating factor (M-CSF; Peprotech) in the presence or absence of 100 U/ml human IFN-γ (Roche) as indicated; IFN-γ was added at the same time as M-CSF at initiation of cultures. For Figure 7, freshly isolated synovial macrophages from 9 RA patients and control macrophages from 5 healthy donors cultured with M-CSF for 3 days were obtained at Hospital for Special Surgery using a protocol approved by the HSS Institutional Review Board. De-identified discard specimens were used and were obtained under a partial waiver of consent.
METHOD DETAILS
Quantitative Real-Time PCR
Total RNA was extracted from cells using RNeasy Mini kit (QIAGEN), and 500 ng of total RNA was reverse transcribed using the RevertAid First Strand cDNA Synthesis kit (Fermentas). Real-time PCR was performed in triplicate with Fast SYBR Green Master Mix and 7500 Fast Real-time PCR system (Applied Biosystems). Primer sequences are provided in the Table S3.
RNA-sequencing
After RNA extraction, libraries for sequencing were prepared using the Illumina TruSeq RNA Library Prep Kit following the manufacturer’s instructions. High throughput sequencing (50 bp, paired-end or single-end for Figure 6 and S6) was performed at the Genomics Resources Core Facility of Weill Cornell Medicine. On average 70 to 100 million reads were obtained per sample. Sequenced reads were mapped to reference human genome (hg19 assembly) using STAR aligner (Dobin et al., 2013) with default parameters and Cufflinks version 2.2.1 (Trapnell et al., 2010) was used to estimate the abundance of transcripts. The expression levels of genes in each sample were normalized by means of fragments per kilobase of transcript per million mapped reads (FPKM). To generate heat maps, we used GENE-E (Broad Institute) set to global comparison. The concordance between replicates was very high (R2 range, 0.943-0.980). Differentially expressed genes (DEGs) were identified using edgeR v3.16.5 (McCarthy et al., 2012; Robinson et al., 2010). Read counts for edgeR analysis were obtained with featureCounts v1.5.1 (Liao et al., 2014). After eliminating absent features (zero counts), the raw counts were normalized with edgeR, followed by differential expression analysis. Significantly up- and down-regulated genes by IFN-γ were defined as expressed genes with p-value adjusted for multiple testing (FDR < 0.05) and log2 fold-change of at least 1. For Figure 6 and S6, significantly down- or up-regulated genes were selected based on log2 fold-change of at least 0.3 and p-value < 0.05.
Gene Ontology Analysis
To find the GO terms enriched in IFN-γ differentially regulated genes, we used the DAVID web-tool (Huang et al., 2008).
Chromatin Immunoprecipitation
Cells were crosslinked for 5 min at room temperature by the addition of one-tenth of the volume of 11% formaldehyde solution (11% formaldehyde, 50 mM HEPES pH 7.5, 100 mM NaCl, 1 mM EDTA pH 8.0, 0.5 mM EGTA pH 8.0) to the growth media followed by 5 min quenching with 100 mM glycine. Cells were pelleted at 4°C and washed w ith ice-cold PBS. The crosslinked cells were lysed with lysis buffer (50 mM HEPES-KOH pH 7.5, 140 mM NaCl, 1 mM EDTA, 10% glycerol, 0.5% NP-40, and 0.25% Triton X-100) with protease inhibitors on ice for 10 min and washed with washing buffer (10 mM Tris-HCl, pH 8.0, 200 mM NaCl, 1 mM EDTA, 0.5 mM EGTA) for 10 min. The lysis samples were resuspended and sonicated in sonication buffer (10 mM Tris-HCl, pH 8.0, 100 mM NaCl, 1 mM EDTA, 0.5 mM EGTA, 0.1% Na-Deoxycholate, 0.5% N-lauroylsarcosine) using a Bioruptor (Diagenode) with 30 sec ON, 30 sec OFF on high power output for 18 cycles. After sonication, samples were centrifuged at 14,000 rpm for 10 minutes at 4°C and 5% of sonicated cell extracts were saved as input. The resulting whole-cell extract was incubated with Protein A Agarose for ChIP (EMD Millipore) for 1 hr at 4°C. Precleared extracts were then incubated with 50 µl (50% v/v) of Protein A Agarose for ChIP (EMD Millipore) with 5 µg of the appropriate antibody overnight at 4°C. PU. 1, C/EBPβ, MAF, RNA Polymerase II and SMC1 ChIP lysates were generated from 2 × 10⁷ cells, 3 × 10⁷ cells, 4 × 10⁷ cells, 2 × 10⁷ cells, and 10 × 107 cells respectively. ChIP antibodies against PU.1 (sc-352), C/EBPβ (sc-150), and MAF (sc-7866) were from Santa Cruz Biotechnology. Antibodies against RNA Polymerase II (MMS-126R) were from Covance. Antibodies against SMC1 (A300-055A) were from Bethyl Laboratories. After overnight incubation, beads were washed twice with sonication buffer, once with sonication buffer with 500 mM NaCl, once with LiCl wash buffer (10 mM Tris-HCl pH 8.0, 1 mM EDTA, 250 mM LiCl, 1% NP-40), and once with TE with 50 mM NaCl. DNA was eluted in freshly prepared elution buffer (1% SDS, 0.1M NaHCO3). Cross-links were reversed by overnight incubation at 65°C. RNA and protein were digested using RNase A and Proteinase K, respectively and DNA was purified with ChIP DNA Clean & Concentrator™ (Zymo Research). For ChIP assays, immunoprecipitated DNA was analyzed by quantitative real-time PCR and normalized relative to input DNA amount.
ChIP-Seq Library Preparation and Sequencing
For ChIP-seq experiments, 10 ng of purified ChIP DNA per sample were ligated with adaptors and 100-300 bp DNA fragments were purified to prepare DNA libraries using Illumina TruSeq ChIP Library Prep Kit following the manufacturer’s instructions. ChIP libraries were sequenced (50 bp single end reads) using an Illumina HiSeq 2500 Sequencer at the Epigenomic Core Facility of Weill Cornell Medicine per manufacturer’s recommended protocol.
Because of limitations on cell numbers and to decrease variability related to differences among individual donors, chromatin immunoprecipitations were performed using pooled samples from at least two different donors. For PU.1, C/EBPβ, and SMC1, a second experiment with pooled samples from several donors was performed and congruence between the replicates was assessed by generating scatter plots and estimating Pearson correlation coefficients (Figure S1I and S1J). After ascertaining close correlation between replicates, we performed bioinformatic analysis using replicate 1 and confirmed key results using replicate 2. The H3K27ac, STAT1 and IRF1 data were from GSE43036.
Assay for Transposase-Accessible Chromatin using Sequencing
ATAC-seq was performed as previously described (Buenrostro et al., 2013). Briefly, 50,000 cells were centrifuged 500 g for 5 min at 4°C. Cell pelle ts were washed once with 1x PBS and cells were pelleted by centrifugation using the previous settings. Cell pellets were resuspended in 25 μl of lysis buffer (10 mM Tris-HCl pH 7.4, 10 mM NaCl, 3 mM MgCl2, 0.1% IGEPAL CA-630) and centrifuged immediately 500 g for 10 min at 4°C . The cell pellet was resuspended in the transposase reaction mix (25 μL 2× TD buffer (Nextera DNA Sample Preparation Kit), 2.5 μL Illumina Tn5 transposase and 22.5 μL nuclease-free water). The transposition reaction was carried out for 30 min at 37°C. Directly following transposition, the sample was purified using a QIAGEN MinElute Purification Kit. Then, we amplified library fragments using NEBNext 2x PCR master mix and 1.25 M of Nextera PCR primers, using the following PCR conditions: 72 °C for 5 min; 98 °C for 30 s; and thermocycling at 98°C for 10 s, 63°C for 30 s and 72°C for 1 min. The libraries were purified using a QIAGEN PCR purification kit yielding a final library concentration of ~30 nM in 20 μL. Libraries were amplified for a total of 10-13 cycles and were subjected to high-throughput sequencing using the Illumina HiSeq 2500 Sequencer.
ChIP-seq and ATAC-seq Analysis
For ChIP-seq and ATAC-seq experiments, sequenced reads were aligned to reference human genome (GRCh37/hg19 assembly) using Bowtie2 version 2.2.6 (Langmead and Salzberg, 2012) with default parameters, and clonal reads were removed from further analysis. A minimum of 10 million uniquely mapped reads were obtained for each condition. We used the makeTagDirectory followed by findPeaks command from HOMER version 4.7.2 (Heinz et al., 2010) to identify peaks of ChIP-seq enrichment over background. A false discovery rate (FDR) threshold of 0.001 was used for all data sets. The total number of mapped reads in each sample was normalized to ten million mapped reads. ChIP-seq data were visualized by preparing custom tracks for the UCSC Genome browser.
Distribution Plot of ChIP-seq and ATAC-seq Signals
We used the annotatePeaks.pl command with parameters -size 2000 -hist 10 from HOMER package to generate histograms for the average distribution of normalized tag densities.
Motif Identification
For de novo motif analysis, transcription factor motif finding was performed with motif finder program findMotifsGenome.pl from HOMER package, on ±100 bp centered on the ATAC-seq peak. Peak sequences were compared to random genomic fragments of the same size and normalized G+C content to identify motifs enriched in the targeted sequences.
Motif Enrichment
To visualize the enrichment of transcription factor binding motifs, we used the annotatePeaks.pl -hist 5 -m <motif file> command from HOMER package to scan peaks for the MAF, IRF, PU.1, and C/EBP motifs. The number of occurrences of this motif at every position was counted and subsequently divided by the number of peaks.
Super-Enhancers
Super-enhancers were identified in HOMER using H3K27ac ChIP-seq data from GSE43036. The findPeaks program was used with the following parameters: –style super, -F 2 –L 2 and –i < IFN-γ-primed condition (for repressed SE) or resting (for inducible SE) >.
Functional Annotations of the Enhancers Using GREAT
Enriched GO Biological Process and MSigDB Pathways were compiled from the GREAT version 3.0.0 (McLean et al., 2010) on each subset of enhancer-associated genes. GO and MSigDB pathways were ranked based on the p-values.
RNA Interference
Immediately after isolation, primary human monocytes were nucleofected with ON-TARGET plus SMARTpool short interfering RNAs (siRNA) specific for MAF purchased from Dharmacon. ON-TARGETplus Non-targeting Pool was used as control. An additional control siRNA and two additional MAF-targeting siRNAs were used with comparable results. Human Monocyte Nucleofector buffer (Lonza Cologne) and the AMAXA Nucleofector System program Y001 for human monocytes were used according to the manufacturer’s instructions.
Adenoviral Transduction
Recombinant adenovirus encoding human MAF (Ad-GFP-h-MAF) and control adenovirus encoding green fluorescent protein (Ad-CMV-GFP) were from Vector Biolabs. For adenoviral transduction, human monocytes were incubated for 6 days on 12-well plates at a density of 2 × 10⁶ cells per ml in complete RPMI 1640 medium supplemented with human M-CSF (40 ng/ml). Then, cells were washed and incubated for 1 h in low-serum media (0.5% (vol/vol) FBS), and then cultured with adenoviral particles (50 particles per cell) in 0.5 ml low-serum RPMI 1640 medium supplemented with human M-CSF (20 ng/ml) for 12 h. Transduction efficiency was monitored by the fluorescence of green fluorescent protein and was typically greater than 85%.
Analysis of Gene Expression in RA Synovial Macrophages
Microarray analysis was performed at Boehringer Ingelheim Pharmaceuticals Inc. using the Affymetrix platform according to the manufacturer’s instructions. For comparison to RNA-seq data, the microarray data were normalized by a quantile normalization method using the preprocessCore package in R. Normalized expression levels were averaged within the same condition and fold-change of the average for each gene was calculated. After sorting the genes in descending order of fold change, the top 100 upregulated and top 100 downregulated genes in RA synovial macrophages compared to control macrophages were defined as a gene set of RA macrophages. Gene expression profiles between resting and IFN-γ-primed macrophages that were obtained by RNA-seq in this study were used to perform gene set enrichment analysis (GSEA) (Subramanian et al., 2005) with the RA gene set. To generate heat maps, we used GENE-E (Broad Institute) set to relative comparison.
QUANTIFICATION AND STATISTICAL ANALYSIS
Statistical tests were selected based on appropriate assumptions with respect to data distribution and variance characteristics. Wilcoxon signed-rank test or Two-tailed paired t-test was used for the statistical analysis of two paired samples. Welch’s t-test or unpaired Student’s t-test was used for the statistical analysis of two non-paired samples. Statistical significance was defined as p < 0.05. The whiskers of box plots represent the 10–90th percentiles of the data. Statistical analyses were performed using GraphPad Prism 7.
DATA AND SOFTWARE AVAILABILITY
RNA-seq, ChIP-seq and ATAC-seq data for this project and microarray data for RA synovial macrophages have been deposited at NCBI’s Gene Expression Omnibus (GEO) with GSE numbers GSE98369 and GSE97779.
Supplementary Material
Acknowledgments
We thank A. Pernis and I. Rogatsky for helpful discussions and review of the manuscript. This work was supported by grants from the N.I.H. and support for the Rosensweig Genomics Center from The Tow Foundation.
Footnotes
AUTHOR CONTRIBUTIONS
Kyuho. K. conceptualized, designed and performed most of the experiments and performed bioinformatic analysis. S.P., J.C., and K. P-M. contributed experiments and expertise. E.G. and Keunsoo K. performed bioinformatic analysis. K.B., A.H., J.L., and G.N. were involved in project management, execution of microarrays and data analysis for the analysis of RA synovial macrophages. L.B.I. conceptualized and oversaw the study and edited the manuscript. All authors reviewed and provided input on the manuscript.
Publisher's Disclaimer: This is a PDF file of an unedited manuscript that has been accepted for publication. As a service to our customers we are providing this early version of the manuscript. The manuscript will undergo copyediting, typesetting, and review of the resulting proof before it is published in its final citable form. Please note that during the production process errors may be discovered which could affect the content, and all legal disclaimers that apply to the journal pertain.
References
- Amit I, Winter DR, Jung S. The role of the local environment and epigenetics in shaping macrophage identity and their effect on tissue homeostasis. Nat Immunol. 2016;17:18–25. doi: 10.1038/ni.3325. [DOI] [PubMed] [Google Scholar]
- Apetoh L, Quintana FJ, Pot C, Joller N, Xiao S, Kumar D, Burns EJ, Sherr DH, Weiner HL, Kuchroo VK. The aryl hydrocarbon receptor interacts with c-Maf to promote the differentiation of type 1 regulatory T cells induced by IL-27. Nat Immunol. 2010;11:854–861. doi: 10.1038/ni.1912. [DOI] [PMC free article] [PubMed] [Google Scholar]
- Aziz A, Soucie E, Sarrazin S, Sieweke MH. MafB/c-Maf Deficiency Enables Self-Renewal of Differentiated Functional Macrophages. Science. 2009;326:867–871. doi: 10.1126/science.1176056. [DOI] [PubMed] [Google Scholar]
- Bernstein BE, Birney E, Dunham I, Green ED, Gunter C, Snyder M. An integrated encyclopedia of DNA elements in the human genome. Nature. 2012;489:57–74. doi: 10.1038/nature11247. [DOI] [PMC free article] [PubMed] [Google Scholar]
- Buecker C, Srinivasan R, Wu Z, Calo E, Acampora D, Faial T, Simeone A, Tan M, Swigut T, Wysocka J. Reorganization of Enhancer Patterns in Transition from Naive to Primed Pluripotency. Cell Stem Cell. 2014;14:838–853. doi: 10.1016/j.stem.2014.04.003. [DOI] [PMC free article] [PubMed] [Google Scholar]
- Buecker C, Wysocka J. Enhancers as information integration hubs in development: lessons from genomics. Trends in Genetics. 2012;28:276–284. doi: 10.1016/j.tig.2012.02.008. [DOI] [PMC free article] [PubMed] [Google Scholar]
- Buenrostro JD, Giresi PG, Zaba LC, Chang HY, Greenleaf WJ. Transposition of native chromatin for fast and sensitive epigenomic profiling of open chromatin, DNA-binding proteins and nucleosome position. Nat Meth. 2013;10:1213–1218. doi: 10.1038/nmeth.2688. [DOI] [PMC free article] [PubMed] [Google Scholar]
- Calo E, Wysocka J. Modification of Enhancer Chromatin: What, How, and Why? Molecular Cell. 2013;49:825–837. doi: 10.1016/j.molcel.2013.01.038. [DOI] [PMC free article] [PubMed] [Google Scholar]
- Cao S, Liu J, Chesi M, Bergsagel PL, Ho I-C, Donnelly RP, Ma X. Differential Regulation of IL-12 and IL-10 Gene Expression in Macrophages by the Basic Leucine Zipper Transcription Factor c-Maf Fibrosarcoma. The Journal of Immunology. 2002;169:5715–5725. doi: 10.4049/jimmunol.169.10.5715. [DOI] [PubMed] [Google Scholar]
- Cao S, Liu J, Song L, Ma X. The Protooncogene c-Maf Is an Essential Transcription Factor for IL-10 Gene Expression in Macrophages. The Journal of Immunology. 2005;174:3484–3492. doi: 10.4049/jimmunol.174.6.3484. [DOI] [PMC free article] [PubMed] [Google Scholar]
- Chen J, Ivashkiv LB. IFN-γ abrogates endotoxin tolerance by facilitating Toll-like receptor-induced chromatin remodeling. Proceedings of the National Academy of Sciences. 2010;107:19438–19443. doi: 10.1073/pnas.1007816107. [DOI] [PMC free article] [PubMed] [Google Scholar]
- Cheng S-C, Scicluna BP, Arts RJW, Gresnigt MS, Lachmandas E, Giamarellos-Bourboulis EJ, Kox M, Manjeri GR, Wagenaars JAL, Cremer OL, et al. Broad defects in the energy metabolism of leukocytes underlie immunoparalysis in sepsis. Nat Immunol. 2016;17:406–413. doi: 10.1038/ni.3398. [DOI] [PubMed] [Google Scholar]
- Dobin A, Davis CA, Schlesinger F, Drenkow J, Zaleski C, Jha S, Batut P, Chaisson M, Gingeras TR. STAR: ultrafast universal RNA-seq aligner. Bioinformatics. 2013;29 doi: 10.1093/bioinformatics/bts635. [DOI] [PMC free article] [PubMed] [Google Scholar]
- Donlin LT, Jayatilleke A, Giannopoulou EG, Kalliolias GD, Ivashkiv LB. Modulation of TNF-Induced Macrophage Polarization by Synovial Fibroblasts. The Journal of Immunology. 2014;193:2373–2383. doi: 10.4049/jimmunol.1400486. [DOI] [PMC free article] [PubMed] [Google Scholar]
- Ehrt S, Schnappinger D, Bekiranov S, Drenkow J, Shi S, Gingeras TR, Gaasterland T, Schoolnik G, Nathan C. Reprogramming of the Macrophage Transcriptome in Response to Interferon-γ and Mycobacterium tuberculosis: Signaling Roles of Nitric Oxide Synthase-2 and Phagocyte Oxidase. The Journal of Experimental Medicine. 2001;194:1123–1140. doi: 10.1084/jem.194.8.1123. [DOI] [PMC free article] [PubMed] [Google Scholar]
- Fairfax BP, Humburg P, Makino S, Naranbhai V, Wong D, Lau E, Jostins L, Plant K, Andrews R, McGee C, Knight JC. Innate immune activity conditions the effect of regulatory variants upon monocyte gene expression. Science. 2014;343:1246949. doi: 10.1126/science.1246949. [DOI] [PMC free article] [PubMed] [Google Scholar]
- Farh KK-H, Marson A, Zhu J, Kleinewietfeld M, Housley WJ, Beik S, Shoresh N, Whitton H, Ryan RJH, Shishkin AA, et al. Genetic and epigenetic fine mapping of causal autoimmune disease variants. Nature. 2015;518:337–343. doi: 10.1038/nature13835. [DOI] [PMC free article] [PubMed] [Google Scholar]
- Ghisletti S, Barozzi I, Mietton F, Polletti S, De Santa F, Venturini E, Gregory L, Lonie L, Chew A, Wei C-L, et al. Identification and Characterization of Enhancers Controlling the Inflammatory Gene Expression Program in Macrophages. Immunity. 2010;32:317–328. doi: 10.1016/j.immuni.2010.02.008. [DOI] [PubMed] [Google Scholar]
- Glass CK, Natoli G. Molecular control of activation and priming in macrophages. Nat Immunol. 2016;17:26–33. doi: 10.1038/ni.3306. [DOI] [PMC free article] [PubMed] [Google Scholar]
- Gorenshteyn D, Zaslavsky E, Fribourg M, Park Christopher Y, Wong Aaron K, Tadych A, Hartmann Boris M, Albrecht Randy A, García-Sastre A, Kleinstein Steven H, et al. Interactive Big Data Resource to Elucidate Human Immune Pathways and Diseases. Immunity. 2015;43:605–614. doi: 10.1016/j.immuni.2015.08.014. [DOI] [PMC free article] [PubMed] [Google Scholar]
- Gosselin D, Link VM, Romanoski Casey E, Fonseca Gregory J, Eichenfield Dawn Z, Spann Nathanael J, Stender Joshua D, Chun Hyun B, Garner H, Geissmann F, Glass Christopher K. Environment Drives Selection and Function of Enhancers Controlling Tissue-Specific Macrophage Identities. Cell. 2014;159:1327–1340. doi: 10.1016/j.cell.2014.11.023. [DOI] [PMC free article] [PubMed] [Google Scholar]
- Heinz S, Benner C, Spann N, Bertolino E, Lin YC, Laslo P, Cheng JX, Murre C, Singh H, Glass CK. Simple Combinations of Lineage-Determining Transcription Factors Prime cis-Regulatory Elements Required for Macrophage and B Cell Identities. Molecular Cell. 2010;38:576–589. doi: 10.1016/j.molcel.2010.05.004. [DOI] [PMC free article] [PubMed] [Google Scholar]
- Heinz S, Romanoski CE, Benner C, Glass CK. The selection and function of cell type-specific enhancers. Nat Rev Mol Cell Biol. 2015;16:144–154. doi: 10.1038/nrm3949. [DOI] [PMC free article] [PubMed] [Google Scholar]
- Hnisz D, Abraham Brian J, Lee Tong I, Lau A, Saint-André V, Sigova Alla A, Hoke Heather A, Young Richard A. Super-Enhancers in the Control of Cell Identity and Disease. Cell. 2013;155:934–947. doi: 10.1016/j.cell.2013.09.053. [DOI] [PMC free article] [PubMed] [Google Scholar]
- Hu X, Chakravarty SD, Ivashkiv LB. Regulation of interferon and Toll-like receptor signaling during macrophage activation by opposing feedforward and feedback inhibition mechanisms. Immunological Reviews. 2008;226:41–56. doi: 10.1111/j.1600-065X.2008.00707.x. [DOI] [PMC free article] [PubMed] [Google Scholar]
- Hu X, Herrero C, Li WP, Antoniv TT, Falck-Pedersen E, Koch AE, Woods JM, Haines GK, Ivashkiv LB. Sensitization of IFN-[gamma] Jak-STAT signaling during macrophage activation. Nat Immunol. 2002;3:859–866. doi: 10.1038/ni828. [DOI] [PubMed] [Google Scholar]
- Hu X, Ivashkiv LB. Cross-regulation of Signaling Pathways by Interferon-γ: Implications for Immune Responses and Autoimmune Diseases. Immunity. 2009;31:539–550. doi: 10.1016/j.immuni.2009.09.002. [DOI] [PMC free article] [PubMed] [Google Scholar]
- Huang DW, Sherman BT, Lempicki RA. Systematic and integrative analysis of large gene lists using DAVID bioinformatics resources. Nat Protocols. 2008;4:44–57. doi: 10.1038/nprot.2008.211. [DOI] [PubMed] [Google Scholar]
- Kagey MH, Newman JJ, Bilodeau S, Zhan Y, Orlando DA, van Berkum NL, Ebmeier CC, Goossens J, Rahl PB, Levine SS, et al. Mediator and cohesin connect gene expression and chromatin architecture. Nature. 2010;467:430–435. doi: 10.1038/nature09380. [DOI] [PMC free article] [PubMed] [Google Scholar]
- Kaikkonen Minna U, Spann Nathanael J, Heinz S, Romanoski Casey E, Allison Karmel A, Stender Joshua D, Chun Hyun B, Tough David F, Prinjha Rab K, Benner C, Glass Christopher K. Remodeling of the Enhancer Landscape during Macrophage Activation Is Coupled to Enhancer Transcription. Molecular Cell. 2013;51:310–325. doi: 10.1016/j.molcel.2013.07.010. [DOI] [PMC free article] [PubMed] [Google Scholar]
- Lam MTY, Cho H, Lesch HP, Gosselin D, Heinz S, Tanaka-Oishi Y, Benner C, Kaikkonen MU, Kim AS, Kosaka M, et al. Rev-Erbs repress macrophage gene expression by inhibiting enhancer-directed transcription. Nature. 2013;498:511–515. doi: 10.1038/nature12209. [DOI] [PMC free article] [PubMed] [Google Scholar]
- Langmead B, Salzberg SL. Fast gapped-read alignment with Bowtie 2. Nat Meth. 2012;9:357–359. doi: 10.1038/nmeth.1923. [DOI] [PMC free article] [PubMed] [Google Scholar]
- Lavin Y, Winter D, Blecher-Gonen R, David E, Keren-Shaul H, Merad M, Jung S, Amit I. Tissue-Resident Macrophage Enhancer Landscapes Are Shaped by the Local Microenvironment. Cell. 2014;159:1312–1326. doi: 10.1016/j.cell.2014.11.018. [DOI] [PMC free article] [PubMed] [Google Scholar]
- Lee MN, Ye C, Villani AC, Raj T, Li W, Eisenhaure TM, Imboywa SH, Chipendo PI, Ran FA, Slowikowski K, et al. Common genetic variants modulate pathogen-sensing responses in human dendritic cells. Science. 2014;343:1246980. doi: 10.1126/science.1246980. [DOI] [PMC free article] [PubMed] [Google Scholar]
- Liao Y, Smyth GK, Shi W. featureCounts: an efficient general purpose program for assigning sequence reads to genomic features. Bioinformatics. 2014;30:923–930. doi: 10.1093/bioinformatics/btt656. [DOI] [PubMed] [Google Scholar]
- Liddiard K, Taylor PR. Understanding Local Macrophage Phenotypes In Disease: Shape-shifting macrophages. Nat Med. 2015;21:119–120. doi: 10.1038/nm.3798. [DOI] [PubMed] [Google Scholar]
- Liu X, Nurieva RI, Dong C. Transcriptional regulation of follicular T-helper (Tfh) cells. Immunological Reviews. 2013;252:139–145. doi: 10.1111/imr.12040. [DOI] [PMC free article] [PubMed] [Google Scholar]
- Maurano MT, Humbert R, Rynes E, Thurman RE, Haugen E, Wang H, Reynolds AP, Sandstrom R, Qu H, Brody J, et al. Systematic localization of common disease-associated variation in regulatory DNA. Science. 2012;337:1190–1195. doi: 10.1126/science.1222794. [DOI] [PMC free article] [PubMed] [Google Scholar]
- McCarthy DJ, Chen Y, Smyth GK. Differential expression analysis of multifactor RNA-Seq experiments with respect to biological variation. Nucleic Acids Research. 2012;40:4288–4297. doi: 10.1093/nar/gks042. [DOI] [PMC free article] [PubMed] [Google Scholar]
- McInnes IB, Schett G. The Pathogenesis of Rheumatoid Arthritis. New England Journal of Medicine. 2011;365:2205–2219. doi: 10.1056/NEJMra1004965. [DOI] [PubMed] [Google Scholar]
- McLean CY, Bristor D, Hiller M, Clarke SL, Schaar BT, Lowe CB, Wenger AM, Bejerano G. GREAT improves functional interpretation of cis-regulatory regions. Nat Biotech. 2010;28:495–501. doi: 10.1038/nbt.1630. [DOI] [PMC free article] [PubMed] [Google Scholar]
- Monticelli S, Natoli G. Short-term memory of danger signals and environmental stimuli in immune cells. Nat Immunol. 2013;14:777–784. doi: 10.1038/ni.2636. [DOI] [PubMed] [Google Scholar]
- Natoli G. Maintaining Cell Identity through Global Control of Genomic Organization. Immunity. 2010;33:12–24. doi: 10.1016/j.immuni.2010.07.006. [DOI] [PubMed] [Google Scholar]
- Okabe Y, Medzhitov R. Tissue-Specific Signals Control Reversible Program of Localization and Functional Polarization of Macrophages. Cell. 2014;157:832–844. doi: 10.1016/j.cell.2014.04.016. [DOI] [PMC free article] [PubMed] [Google Scholar]
- Okabe Y, Medzhitov R. Tissue biology perspective on macrophages. Nat Immunol. 2016;17:9–17. doi: 10.1038/ni.3320. [DOI] [PubMed] [Google Scholar]
- Okada Y, Wu D, Trynka G, Raj T, Terao C, Ikari K, Kochi Y, Ohmura K, Suzuki A, Yoshida S, et al. Genetics of rheumatoid arthritis contributes to biology and drug discovery. Nature. 2014;506:376–381. doi: 10.1038/nature12873. [DOI] [PMC free article] [PubMed] [Google Scholar]
- Ostuni R, Piccolo V, Barozzi I, Polletti S, Termanini A, Bonifacio S, Curina A, Prosperini E, Ghisletti S, Natoli G. Latent Enhancers Activated by Stimulation in Differentiated Cells. Cell. 2013;152:157–171. doi: 10.1016/j.cell.2012.12.018. [DOI] [PubMed] [Google Scholar]
- Perissi V, Jepsen K, Glass CK, Rosenfeld MG. Deconstructing repression: evolving models of co-repressor action. Nat Rev Genet. 2010;11:109–123. doi: 10.1038/nrg2736. [DOI] [PubMed] [Google Scholar]
- Piccolo V, Curina A, Genua M, Ghisletti S, Simonatto M, Sabo A, Amati B, Ostuni R, Natoli G. Opposing macrophage polarization programs show extensive epigenomic and transcriptional cross-talk. Nat Immunol. 2017;18:530–540. doi: 10.1038/ni.3710. [DOI] [PMC free article] [PubMed] [Google Scholar]
- Pot C, Apetoh L, Kuchroo VK. Type 1 regulatory T cells (Tr1) in autoimmunity. Seminars in Immunology. 2011;23:202–208. doi: 10.1016/j.smim.2011.07.005. [DOI] [PMC free article] [PubMed] [Google Scholar]
- Qiao Y, Giannopoulou Eugenia G, Chan Chun H, Park S-h, Gong S, Chen J, Hu X, Elemento O, Ivashkiv Lionel B. Synergistic Activation of Inflammatory Cytokine Genes by Interferon-γ-Induced Chromatin Remodeling and Toll-like Receptor Signaling. Immunity. 2013;39:454–469. doi: 10.1016/j.immuni.2013.08.009. [DOI] [PMC free article] [PubMed] [Google Scholar]
- Qiao Y, Kang K, Giannopoulou E, Fang C, Ivashkiv Lionel B. IFN-γ Induces Histone 3 Lysine 27 Trimethylation in a Small Subset of Promoters to Stably Silence Gene Expression in Human Macrophages. Cell Reports. 2016;16:3121–3129. doi: 10.1016/j.celrep.2016.08.051. [DOI] [PMC free article] [PubMed] [Google Scholar]
- Robinson MD, McCarthy DJ, Smyth GK. edgeR: a Bioconductor package for differential expression analysis of digital gene expression data. Bioinformatics. 2010;26:139–140. doi: 10.1093/bioinformatics/btp616. [DOI] [PMC free article] [PubMed] [Google Scholar]
- Saeed S, Quintin J, Kerstens HHD, Rao NA, Aghajanirefah A, Matarese F, Cheng S-C, Ratter J, Berentsen K, van der Ent MA, et al. Epigenetic programming of monocyte-to-macrophage differentiation and trained innate immunity. Science. 2014;345 doi: 10.1126/science.1251086. [DOI] [PMC free article] [PubMed] [Google Scholar]
- Shalova Irina N, Lim Jyue Y, Chittezhath M, Zinkernagel Annelies S, Beasley F, Hernández-Jiménez E, Toledano V, Cubillos-Zapata C, Rapisarda A, Chen J, et al. Human Monocytes Undergo Functional Re-programming during Sepsis Mediated by Hypoxia-Inducible Factor-1α. Immunity. 2015;42:484–498. doi: 10.1016/j.immuni.2015.02.001. [DOI] [PubMed] [Google Scholar]
- Soucie EL, Weng Z, Geirsdóttir L, Molawi K, Maurizio J, Fenouil R, Mossadegh-Keller N, Gimenez G, VanHille L, Beniazza M, et al. Lineage-specific enhancers activate self-renewal genes in macrophages and embryonic stem cells. Science. 2016;351 doi: 10.1126/science.aad5510. [DOI] [PMC free article] [PubMed] [Google Scholar]
- Stark George R, Darnell James E., Jr The JAK-STAT Pathway at Twenty. Immunity. 2012;36:503–514. doi: 10.1016/j.immuni.2012.03.013. [DOI] [PMC free article] [PubMed] [Google Scholar]
- Su X, Yu Y, Zhong Y, Giannopoulou EG, Hu X, Liu H, Cross JR, Ratsch G, Rice CM, Ivashkiv LB. Interferon-[gamma] regulates cellular metabolism and mRNA translation to potentiate macrophage activation. Nat Immunol. 2015;16:838–849. doi: 10.1038/ni.3205. [DOI] [PMC free article] [PubMed] [Google Scholar]
- Subramanian A, Tamayo P, Mootha VK, Mukherjee S, Ebert BL, Gillette MA, Paulovich A, Pomeroy SL, Golub TR, Lander ES, Mesirov JP. Gene set enrichment analysis: A knowledge-based approach for interpreting genome-wide expression profiles. Proceedings of the National Academy of Sciences. 2005;102:15545–15550. doi: 10.1073/pnas.0506580102. [DOI] [PMC free article] [PubMed] [Google Scholar]
- Trapnell C, Williams BA, Pertea G, Mortazavi A, Kwan G, van Baren MJ, Salzberg SL, Wold BJ, Pachter L. Transcript assembly and quantification by RNA-Seq reveals unannotated transcripts and isoform switching during cell differentiation. Nat Biotech. 2010;28:511–515. doi: 10.1038/nbt.1621. [DOI] [PMC free article] [PubMed] [Google Scholar]
- Tsankov AM, Gu H, Akopian V, Ziller MJ, Donaghey J, Amit I, Gnirke A, Meissner A. Transcription factor binding dynamics during human ES cell differentiation. Nature. 2015;518:344–349. doi: 10.1038/nature14233. [DOI] [PMC free article] [PubMed] [Google Scholar]
- Whyte WA, Bilodeau S, Orlando DA, Hoke HA, Frampton GM, Foster CT, Cowley SM, Young RA. Enhancer decommissioning by LSD1 during embryonic stem cell differentiation. Nature. 2012;482:221–225. doi: 10.1038/nature10805. [DOI] [PMC free article] [PubMed] [Google Scholar]
- Witte S, O’Shea JJ, Vahedi G. Super-enhancers: Asset management in immune cell genomes. Trends in Immunology. 2015;36:519–526. doi: 10.1016/j.it.2015.07.005. [DOI] [PMC free article] [PubMed] [Google Scholar]
- Xue J, Schmidt Susanne V, Sander J, Draffehn A, Krebs W, Quester I, De Nardo D, Gohel Trupti D, Emde M, Schmidleithner L, et al. Transcriptome-Based Network Analysis Reveals a Spectrum Model of Human Macrophage Activation. Immunity. 2014;40:274–288. doi: 10.1016/j.immuni.2014.01.006. [DOI] [PMC free article] [PubMed] [Google Scholar]
Associated Data
This section collects any data citations, data availability statements, or supplementary materials included in this article.