

Abstract
Metabolic assay buffers often omit bicarbonate, which is susceptible to alkalinisation in an open environment. Here, we assessed the effect of including bicarbonate in respirometry experiments. By supplementing HEPES-buffered media with low concentrations of bicarbonate, we found increased respiration in adipocytes and hepatocytes, but not myotubes. This was observed across multiple respirometry platforms and was independent of effects on enhanced insulin sensitivity, pH drift, or mitochondrial function. Permeabilised cell experiments suggest that bicarbonate increases substrate availability, likely by acting as a cofactor for carboxylase enzymes. This emphasises the importance of buffer choice in experimental biology.
Keywords: Bicarbonate, HEPES, buffer, mitochondria, respiration
Introduction
The study of cell biology in vitro requires an intricate buffer system that is convenient, minimises fluctuations caused by experimental manipulations, and reflects physiological conditions. The criteria for an ideal pH buffer were originally outlined by Good et al., who characterised a range of buffers compatible with biological experiments [1]. This was followed by Eagle, who examined the immense impact of pH buffer choice on cell growth [2]. This led to the development of standardised formulae for cell culture media and as media became commercially available, research into buffer optimisation diminished. However, recent studies have demonstrated there is still a need to better balance the physiological and logistical aspects of buffers used in cell biology experiments (e.g., [3]).
In metabolic experiments, the typical bicarbonate pH buffer used in cell culture media is susceptible to alkalinisation when not maintained at 5-10% CO2 and thus does not permit frequent manipulations in an open environment outside the CO2 incubator. Consequently, bicarbonate is often substituted by HEPES, which meets Good's buffer criteria [1] and is in standard mitochondrial assay buffers for cultured cells [4]. Furthermore, a popular tool in bioenergetics experiments is the XF Analyzer system [5], for which pH-buffer-free media is recommended by the manufacturer to facilitate extracellular pH flux measurements (Seahorse BioScience).
However, as the endogenous buffering system in mammals, bicarbonate is essential for metabolism for several reasons. First, it serves as a nutrient for carboxylation reactions, such as by acetyl-CoA carboxylase in lipogenesis. Second, bicarbonate alters cellular signalling responses, for example improving insulin sensitivity [6]. Third, it permits pH fluctuations in the cytosol, which can regulate metabolism (e.g., glycolysis [7]). Consequently, we assessed the potential for including bicarbonate in bioenergetic experiments. We found that bicarbonate increased mitochondrial respiration across multiple instruments in a cell-specific manner, with evidence suggesting this is due to enhanced substrate availability. This emphasises the importance of buffer choice in experimental biology.
Materials and Methods
Cell culture
3T3-L1 fibroblasts were passaged and differentiated into adipocytes as described previously [8], using Dulbecco's modified Eagle's medium (DMEM, bicarbonate-buffered) supplemented with 10% (v/v) foetal bovine serum and 2 mM GlutaMAX (Media A). For intact-cell experiments, adipocytes were used between days 9 and 12 after the initiation of differentiation. L6 myoblasts were cultured and diffrentiated into myotubes as described previously with slghtly modifciations [9]. Myoblasts were passaged using α-minimal essential medium (α-MEM) containing GlutaMAX supplemented with 10% (v/v) foetal bovine serum and differentiated into myotubes by switching to α-MEM containing GlutaMAX supplemented with 2% (v/v) horse serum. L6 myotubes were used between days 5 and 7 after the initiation of differentiation. AML12 cells were cultured in high glucose (4.5g/L) DMEM, supplemented with 10% fetal bovine serum (ThermoFisher, USA). Unless otherwise stated, the DMEM used in cell culture and experiments was buffered solely by bicarbonate.
Respirometry using the XFp and XF24 Analyzers (Seahorse Biosciences, MA, USA)
On Day 7-8 of differentiation, 3T3-L1 adipocytes were trypsinised with 5× Trypsin/EDTA (Life Technologies) in phosphate-buffered saline (PBS) and seeded onto XFp cell culture plates coated with Matrigel (Corning, distributed by Sigma-Aldrich (Castle Hill, NSW, Australia)) and cultured in Media A prior to experimentation. L6 myoblasts were seeded directly onto Matrigel-coated XFp culture plates, then cultured and differentiated into myotubes. Prior to the assay, cells were washed 3 times with PBS, once with bicarbonate-free DMEM buffered with 30 mM Na-HEPES, pH 7.4 (DMEM/HEPES), and then incubated in DMEM/HEPES supplemented with 0.2% (w/v) BSA, 25 mM glucose, 1 mM GlutaMAX and 1 mM glutamine (Media B), for 1.5 h in a non-CO2 incubator at 37 °C. Cells were then washed once with PBS, once with DMEM/HEPES, and assayed in the XFp Analyzer in Media B without BSA and supplemented with or without 10 mM NaHCO3. During the assay, respiration was assayed with mix/wait/read cycles of 3/0/2 min for 3T3-L1 adipocytes and 2/0/2 min for L6 myotubes. Following assessment of basal respiration, the following compounds (final concentrations in parentheses) were injected sequentially: insulin (100 nM), oligoymcin (10 μg/ml), BAM15 (10 mM), rotenone/antimycin A (5 μM / 10 μM). All of these reagents were obtained from Sigma-Aldrich, except BAM15, which was provided as a gift from Kyle Hoehn (UNSW, Australia). After the assay, the media was aspirated and DNA content was measured by Hoechst staining as described previously [10], except following freeze-thaw lysis in 50 μl water per well, 50 μl TNE buffer (10 mM Tris-HCl pH 7.4, 2 M NaCl, 1 mM EDTA) was added to the wells. Lysates were then transferred to a 96-well plate before staining with 100 μl Hoechst solution, containing 10 μg/ml Hoechst-33342 (Life Technologies, instead of Hoechst-33258) in a 1:1 mixture of water and TNE buffer, and subsequent fluorescence measurement.
For AML12 experiments, cells were seeded into XF24 tissue culture plates at a cell density of 60,000 cells/well. Cells were cutured in the XF24 plates for 48 h and then assayed. Prior to respirometry analysis, cells were washed once with PBS and then incubated for 1 h in bicarbonate-free DMEM/HEPES media in a non-CO2 incubator at 37 °C. Fresh DMEM/HEPES media supplemented with or without 10 mM NaHCO3 was then added to the cells and the plate was placed inside the XF24 analyzer. During the assay, respiration was assayed with mix/wait/read cycles of 2/1/2 minutes. Following assessment of basal respiration, the following compounds (final concentrations in parentheses) were injected sequentially; insulin (100 nM), oligomycin (5 mM), trifluorocarbonylcyanide phenylhydrazone (FCCP, 5 mM), rotenone/antimycin A (5 μM / 5 μM). At the conclusion of the assay, cells were washed once with PBS, lysed in RIPA buffer and protein content was determined via the BCA protein assay (ThermoFisher, USA).
For each experiment, NaHCO3 was added fresh and the final pH was adjusted to 7.4 at 37 °C, such that the media with and without NaHCO3 were within 0.05 pH units of each other.
Respirometry using the O2K Electrode (Oroboros Instruments, Innsbruck, Austria)
High-resolution O2 consumption measurements were conducted at 37 °C using the OROBOROS O2K Oxygraph (Oroboros Instruments, Innsbruck, Austria). For all experiments involving non-permeabilised cells, cells were washed with PBS, trypsinised with 0.25% trypsin/EDTA, pelleted at 2,000 RPM and then resuspended in a bicarbonate-free DMEM media containing 25 mM glucose, 2 mM glutamine, and with or without 10mM NaHCO3 at a cell concentration of 1.0 × 10⁶ cells/ml. To begin the respirometry assays, cells were first loaded into the O2K chambers and allowed to equilibrate to 37 °C. The pH of each condition (NaHCO3 vs control) was then assessed via a pH electrode and subsequently clamped at 7.3 using dilute NaOH and/or HCl. The chambers were then sealed and basal respiration was assessed for approximately ∼15 minutes. Maximal respiratory flux was determined with FCCP (5 μM). The pH of each condition was assessed at the completion of each experiment to ensure there was no deviation from 7.3.
For experiments designed to directly assess the mitochondrial oxidative phosphorylation system, cell pellets were suspended in respiration buffer [20mM HEPES (pH 7.1), 110 mM sucrose, 10 mM KH2PO4, 3 mM MgCl2, 0.5 mM EGTA, 1 g/L BSA], supplemented with 0.03 mg/ml digitonin and 10 mM sodium bicarbonate or 10mM NaCl. To begin, cells were first loaded into the O2K chambers and allowed to equilibrate to 37°C. The pH of each chamber was then assessed via a pH electrode and subsequently clamped at 7.1 using dilute KOH and/or HCl. The chambers were sealed and state 1 respiration was assessed for approximately ∼10 min in the absence of added carbon substrates. Subsequent additions of glutamate/malate (10 mM / 2 mM), ADP (2 mM) and succinate (10 mM) were added to determine the maximal capacity of oxdative phosphorylation. All permeabilised cell experiments included hexokinase (1 U/ml) and glucose (5 mM) to clamp the ADP concentration at 2 mM. Cytochrome C (0.01 mM) was added at the completion of all protocols to assess the integrity of the inner mitochondrial membrane. The pH of each condition was measured again at the completion of each experiment to ensure there was no deviation from 7.1.
Glucose uptake and consumption assays
To measure glucose uptake, the glucose analog 2-deoxyglucose (2DOG) was used. Cells were washed with PBS and incubated in DMEM supplemented with 0.2% (w/v) BSA and 2 mM GlutaMAX. After 1.5 h, cells were washed with PBS and assayed for 2DOG uptake as described previously [11], using Krebs-Ringer phosphate buffer supplemented with 30 mM Na-HEPES with or without 10 mM NaHCO3. 2DOG uptake was normalised to protein content, measured using the BCA protein assay (ThermoFisher Scientific, North Ryde, NSW, Australia).
To measure glucose consumption following treatments, the plate of cells was chilled on ice and media was removed. Media was centrifuged at 2000 × g to remove debris and glucose content was measured using the glucose oxidase kit (ThermoFisher Scientific). Naïve treatment media was included as a control. Glucose consumption was determined by subtracting the glucose content of the conditioned media from the naïve media, and then normalised to protein content, measured using the BCA protein assay.
Results
Respirometry experiments within intact cells are typically performed outside of a CO2-regulated environment (such as a tissue culture incubator). These conditions necessitate bicarbonate-free media to circumvent alkalinisation. Although other buffering agents such as HEPES stabilise experimental pH, bicarbonate restriction could have a dramatic effect on cellular metabolism since bicarbonate acts as a nutrient, alters kinase signalling [6], and permits intracellular pH fluctuations [7].
To determine the impact of bicarbonate on cellular metabolism we employed a HEPES (30 mM) buffer supplemented with or without 10 mM sodium bicarbonate. This HEPES/bicarbonate combination has been shown previously to stabilise the pH under ambient CO2 levels whilst retaining bicarbonate in solution (e.g., [12]). Bioenergetic experiments using the Seahorse XFp Analyzer in 3T3-L1 adipocytes revealed bicarbonate-dependent increases in basal (10%) and insulin-stimulated (42%) respiration (Fig. 1A; “Bas”, “Ins”). To determine if this increase in respiration was caused by increased substrate delivery and/or accelerated demand for ATP regeneration, we measured maximal uncoupled oxygen consumption in the presence of mitochondrial poisons oligomycin and BAM15 [13]. Under these conditions, bicarbonate again increased respiratory flux compared to control cells (Fig. 1A; “Oligo”, “BAM15”), suggesting that bicarbonate increased respiration via accelerated substrate delivery to the mitochondria. Non-mitochondrial respiration, assessed in the presence of rotenone and antimycin A, was not different between conditions (Fig. 1A; “Rot/AA”). Together, bicarbonate substantially increased cellular respiration.
Figure 1.
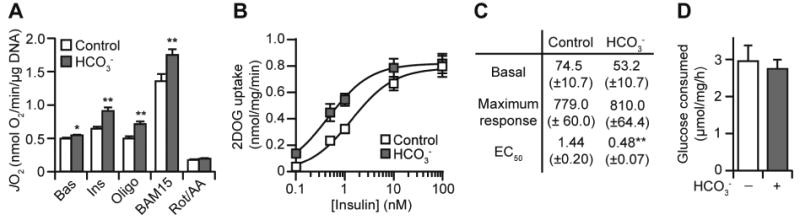
Bicarbonate increases adipocyte respiration independently of insulin sensitivity. (A) 3T3-L1 adipocytes were incubated with or without bicarbonate (10 mM) and respiration was assessed using the XFp Analyzer. Following basal measurements (Bas), cells were sequentially treated with insulin (Ins), oligomycin (Oligo), Bam15, and rotenone/antimycin A (Rot/AA). Data presented as mean + SEM, from n = 4 separate experiments. (B) 3T3-L1 adipocytes were assayed for 2-deoxyglucose (2DOG) uptake for a range of insulin concentrations, in the presence or absence of bicarbonate (10 mM). Data presented as mean ± SEM, from at least n = 3 separate experiments for each insulin concentration. (C) The data from (B) were used to calculate basal uptake, maximal response (maximal uptake – basal uptake), and the insulin EC50. Data presented as mean ± SEM. Responses are in pmol/mg/min and EC50 is in nM. (D) 3T3-L1 adipocytes were incubated in Media B (except with 10 mM glucose) for 1 h, in the presence of insulin (100 nM) with or without bicarbonate (10 mM). Following treatment, glucose consumption was measured by assaying the glucose content of the media. Data presented as mean ± SEM, from n = 3 separate experiments. * p<0.05, ** p<0.01, using the two-tailed t-test.
Bicarbonate could be mediating its effect on respiration through increasing insulin-stimulated uptake of glucose [6] and subsequent delivery of glucose-derived pyruvate to the mitochondria. We tested the former by measuring the uptake of 2-deoxyglucose (2DOG), a non-metabolisable analog of glucose, following insulin stimulation. Bicarbonate caused a leftward shift (reduced EC50) in the dose-response curve for insulin-stimulated 2DOG uptake (Fig. 1B-C), corroborating previous findings [6]. However, bicarbonate did not alter basal 2DOG uptake (no insulin) or the maximal response to insulin (100 nM) (Fig. 1B-C), whereas we did observe significant effects of bicarbonate on respiration under these conditions (Fig. 1A). Furthermore, there was no difference in glucose consumption from the media in response to insulin (Fig. 1D). Thus, although bicarbonate enhanced adipocyte insulin sensitivity, increased glucose uptake cannot explain the bicarbonate-induced increases in respiration (Fig. 1A).
Bicarbonate-dependent increases in respiration could also be due to pH fluctuations associated with including bicarbonate in respiration media. To address this, we tested the pH stability of naïve media in an unsealed environment. Under these conditions, bicarbonate caused a time-dependent increase in pH (Fig. 2A). Similar results were obtained in the Seahorse XFp instrument (data not shown) and this was exacerbated by higher bicarbonate concentrations (Fig. 2A). However, 1 mM bicarbonate exerted a negligible pH drift (<0.05 units), but still increased respiration in adipocytes (Fig. 2B-C). Furthermore, a buffer set to a higher pH (Fig. 2A) in the absence of bicarbonate had no impact on respiration (Fig. 2C). Together, these data suggest that bicarbonate increases respiration independent of pH drift.
Figure 2.
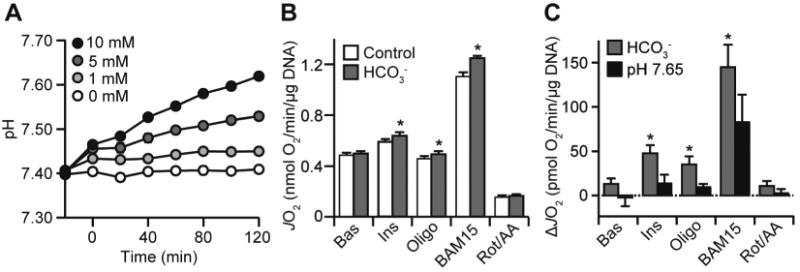
Bicarbonate increases adipocyte respiration independently of pH drift. (A) Naïve DMEM/HEPES was supplemented with varying bicarbonate concentrations (0 to 10 mM) and set to pH 7.4 at 37 °C. Media was then dispensed in a 24-well plate (3 wells per media) in a 37 °C waterbath and left for 5 min for the temperature to stabilise. This preparation took ∼10 min per experiment, after which the pH was measured in every well every 20 min for 120 min. Data presented as mean ± SEM from n = 4 separate experiments. (B-C) 3T3-L1 adipocytes were incubated in bicarbonate-free media set at pH 7.4 (control), supplemented with bicarbonate (1 mM) or set at pH 7.65. Respiration was assessed as described in Fig. 1A. The control and bicarbonate data are presented in (B) as JO2. All of the data is presented as a change in JO2 (ΔJO2) in (C). Data presented as mean + SEM, from at least n = 3 separate experiments. * p<0.05, using the two-tailed t-test.
Next, we tested if the effects of bicarbonate were specific to adipocytes. Under similar experimental conditions, bicarbonate had no effect on respiration in L6 myotubes (Fig. 3A). In contrast, 10 mM bicarbonate increased basal, ATP-independent and maximal respiration (the latter using the uncoupler, FCCP) in AML12 hepatocytes (Fig. 3B), although 1 mM bicarbonate or pH 7.65 bicarbonate-free media had no effect (data not shown). Thus, the bicarbonate-dependent increase in respiration is a cell-specific phenomenon.
Figure 3.
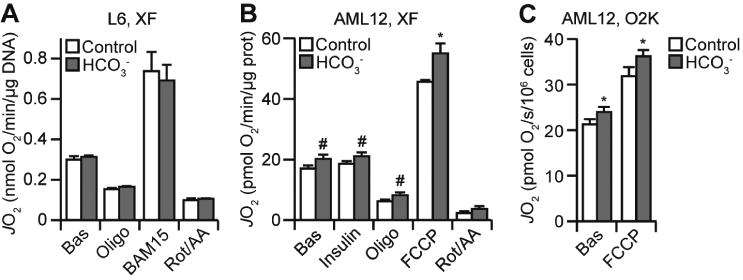
The effect of bicarbonate on respiration is cell-specific and observed across multiple respirometry instruments. (A) L6 myotubes were incubated with or without bicarbonate (10 mM) and respiration was assessed using the XFp Analyzer as described in Fig. 1A. Data presented as mean + SEM, from n = 4 separate experiments. (B) AML12 hepatocytes were incubated with or without bicarbonate (10 mM) and respiration was assessed using the XF24 Analyzer. Following basal measurements (Bas), cells were sequentially treated with insulin, oligomycin (Oligo), FCCP, and rotenone/antimycin A (Rot/AA). Data presented as mean + SEM, from n =3 separate experiments. (C) AML12 hepatocytes were incubated with or without bicarbonate (10 mM) and respiration was assessed using the O2K. Following basal measurements (Bas), cells were treated with FCCP. Data presented as mean + SEM, from n = 3 separate experiments. #,* p<0.05, using the one-tailed (#) or two-tailed (*) t-test.
The respiration experiments presented to this point were performed in a non-sealed system (Seahorse XFp or XF24 instrument) in which the ambient air is in constant exchange with the media. We hypothesised that the pH drift measured in bicarbonate-containing media (Fig. 2A) may be minimised in a sealed system which prevents air-media exchange. We tested this using the O2K system. Since this system requires cells to be in suspension, we could not use adipocytes as trypsinisation abolishes insulin sensitivity [14] and thus would impair adipocyte metabolism. Consequently, we used hepatocytes as they exhibited minimal increases in respiration in the presence of insulin compared to adipocytes (Fig. 1A, 2B, 3B). We suspended AML12 hepatocytes in HEPES-buffered DMEM with or without bicarbonate and loaded them into respective chambers of the O2K and allowed them to air equilibrate for ∼10 min. The pH of each condition was adjusted to ∼7.3 using dilute NaOH or HCl and the O2K chambers were sealed for the duration of the experiment. Assessment of the pH at the conclusion of this protocol revealed no bicarbonate-dependent drift in pH (control: pH = 7.26 ± 0.01; bicarbonate: pH = 7.28 ± 0.02; mean ± SEM from 3 separate experiments). We also observed no pH drift with naïve media in the O2K (data not shown). Using these assay conditions, basal and maximally-uncoupled respiration was increased with bicarbonate (Fig. 3C). Thus, the effect of bicarbonate on respiration was consistent across different respirometry platforms.
To determine if bicarbonate directly affects the activity of the mitochondrial oxidative phosphorylation system, we assessed respiratory function in permeabilised adipocytes and hepatocytes in the O2K system under pH clamped conditions. Following digitonin permeabilization, bicarbonate had little effect on State III respiration driven by Complex I (glutamate/malate) or Complex II (succinate), in both adipocytes (Fig. 4A) and hepatocytes (Fig. 4B). In contrast, bicarbonate increased State I and Complex I-driven State IV respiration in permeabilised hepatocytes (Fig. 4B). This is consistent with the notion that bicarbonate increased respiration in these cell-lines via increasing mitochondrial delivery of endogenous substrates.
Figure 4.
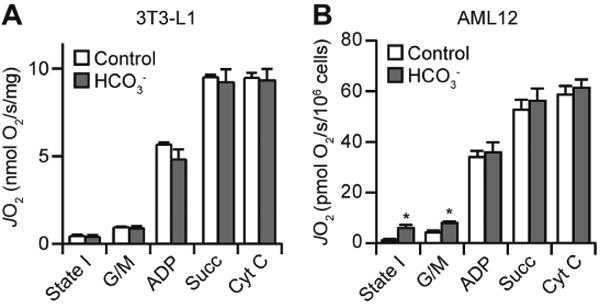
Bicarbonate increases State I and IV respiration in hepatocytes. (A-B) 3T3-L1 adipocytes (A) or AML12 hepatocytes (B) were permeabilised and assayed for respiration using the O2K Electrode. Following the measurement of State I respiration, permeabilised cells were treated sequentially with glutamate/malate (G/M), ADP, succinate (Succ), and cytochrome C (Cyt C). Data presented as mean + SEM, from n = 3 separate experiments. *, p<0.05, using the two-tailed t-test.
Discussion
In this study, we assessed the impact of including bicarbonate in respirometry experiments. Bicarbonate increased respiration in a cell-specific manner (Fig. 1, 3). This was independent of effects on insulin sensitivity (Fig. 1), pH drift (Fig. 2), or mitochondrial function (Fig. 4), with evidence suggesting that this is mediated by increased substrate availability (Fig. 4).
Although the 3:1 ratio of HEPES/bicarbonate has been regularly used to study adipocyte biology (e.g., [12]), the extent of the pH drift in such media and its effects on respiration has not been previously characterised. We showed that bicarbonate increased media pH in a dose-dependent manner, but that even the largest measured increases in pH did not affect adipocyte respiration in isolation (Fig. 2). These changes in pH can be circumvented by either using a sealed environment (Fig. 3) as in the O2K system and as often used in prevous studies into adipocyte biology, or through the use of lower bicarbonate concentrations (e.g., 1 mM for adipocytes) for unsealed systems. Furthermore, the observation of bicarbonate-increased respiration with both the XFp/XF24 and O2K instruments (Figs. 1-3) demonstrates that it is a robust phenomenon and highlights the complementary nature of these instruments when investigating bioenergetics; permitting higher doses of bicarbonate in the O2K or allowing for interrogation of bioenergetics in cell-lines not amenable to suspension in the XFp/XF24 instruments.
Given that bicarbonate had little effect on myotubes yet increased respiration in adipocytes and hepatocytes (both lipogenic cell-types), it is possible that this is driven by an increased demand in lipogenesis. However, this is unlikely as bicarbonate increased uncoupler-stimulated respiration in both adipocytes and hepatocytes, suggesting that bicarbonate instead improves respiratory potential. This is likely due to substrate availability, given the increased State I respiration (Fig. 4B). This is a biochemically feasible mechanism, given that bicarbonate is an essential cofactor for a range of carboxylases in the metabolism of glucose (e.g., pyruvate carboxylase), lipid (e.g., acetyl-CoA carboxylase), and amino acids (e.g., methyl-crotonyl-coA carboxylase).
In conclusion, the present findings highlight the importance of including bicarbonate as a nutrient in metabolic experiments. For instance, it enhanced the effect size of insulin on adipocyte respiration (e.g., 130% to 168% in Fig. 1A), which provides a better opportunity to delineate the factors driving adipocyte respiration. Therefore, we strongly encourage the consideration of bicarbonate in buffers of other open experimental systems (e.g., live-cell microscopy) where metabolism plays an essential role in the physiological parameters being assayed.
Highlights.
Bicarbonate increases respiration in adipocytes and hepatocytes.
This effect was observed across multiple respirometry instruments.
Mechanistically, this could be due to increased substrate availability.
This emphasises the importance of buffer choice in experimental biology.
Acknowledgments
This work is supported by National Health and Medical Research Council (NHMRC) program grants (GNT1086850 for D.E.J.), as well as National Institute of Health (NIH) grants R01-DK089312 (D.M.M.), and F32-DK105665 (K.F-W.). J.R.K. is a recipient of an NHMRC Early Career Fellowship (APP1072440). D.E.J. is an NHMRC Senior Principal Research Fellow (APP1019680). The contents of the published material are solely the responsibility of the authors and do not reflect the views of the NHMRC or NIH.
Abbreviations
- 2DOG
2-deoxyglucose
- DMEM
Dulbecco's modified Eagle's medium
- FCCP
trifluorocarbonylcyanide phenylhydrazone
- PBS
phosphate-buffered saline
Footnotes
Author Contributions: Conceptualisation, J.R.K. and D.E.J.; Investigation, J.R.K., K.F-W., and D.J.F.; Data analysis, J.R.K. and K.F-W.; Writing – original draft, J.R.K. and K.F-W; Writing – editing and reviewing, all authors; Resources, funding acquisition, and supervision, D.M.M. and D.E.J.
Publisher's Disclaimer: This is a PDF file of an unedited manuscript that has been accepted for publication. As a service to our customers we are providing this early version of the manuscript. The manuscript will undergo copyediting, typesetting, and review of the resulting proof before it is published in its final citable form. Please note that during the production process errors may be discovered which could affect the content, and all legal disclaimers that apply to the journal pertain.
References
- 1.Good NE, Winget GD, Winter W, Connolly TN, Izawa S, Singh RM. Hydrogen ion buffers for biological research. Biochemistry. 1966;5(2):467–77. doi: 10.1021/bi00866a011. [DOI] [PubMed] [Google Scholar]
- 2.Eagle H. Buffer combinations for mammalian cell culture. Science. 1971;174(4008):500–3. doi: 10.1126/science.174.4008.500. [DOI] [PubMed] [Google Scholar]
- 3.Cantor JR, Abu-Remaileh M, Kanarek N, Freinkman E, Gao X, Louissaint A, Lewis CA, Jr, Sabatini DM. Physiologic Medium Rewires Cellular Metabolism and Reveals Uric Acid as an Endogenous Inhibitor of UMP Synthase. Cell. 2017;169(2):258–272e17. doi: 10.1016/j.cell.2017.03.023. [DOI] [PMC free article] [PubMed] [Google Scholar]
- 4.Silva AM, Oliveira PJ. Evaluation of respiration with clark type electrode in isolated mitochondria and permeabilized animal cells. Methods Mol Biol. 2012;810:7–24. doi: 10.1007/978-1-61779-382-0_2. [DOI] [PubMed] [Google Scholar]
- 5.Gerencser AA, Neilson A, Choi SW, Edman U, Yadava N, Oh RJ, Ferrick DA, Nicholls DG, Brand MD. Quantitative microplate-based respirometry with correction for oxygen diffusion. Anal Chem. 2009;81(16):6868–78. doi: 10.1021/ac900881z. [DOI] [PMC free article] [PubMed] [Google Scholar]
- 6.Shechter Y, Ron A. Effect of depletion of phosphate and bicarbonate ions on insulin action in rat adipocytes. J Biol Chem. 1986;261(32):14945–50. [PubMed] [Google Scholar]
- 7.Theparambil SM, Weber T, Schmalzle J, Ruminot I, Deitmer JW. Proton fall or bicarbonate rise: glycolytic rate in mouse astrocytes is paved by intracellular alkalinization. J Biol Chem. 2016;291(36):19108–17. doi: 10.1074/jbc.M116.730143. [DOI] [PMC free article] [PubMed] [Google Scholar]
- 8.Fazakerley DJ, Naghiloo S, Chaudhuri R, Koumanov F, Burchfield JG, Thomas KC, Krycer JR, Prior MJ, Parker BL, Murrow BA, et al. Proteomic Analysis of GLUT4 Storage Vesicles Reveals Tumor Suppressor Candidate 5 (TUSC5) as a Novel Regulator of Insulin Action in Adipocytes. J Biol Chem. 2015;290(39):23528–42. doi: 10.1074/jbc.M115.657361. [DOI] [PMC free article] [PubMed] [Google Scholar]
- 9.Fazakerley DJ, Holman GD, Marley A, James DE, Stockli J, Coster AC. Kinetic evidence for unique regulation of GLUT4 trafficking by insulin and AMP-activated protein kinase activators in L6 myotubes. J Biol Chem. 2010;285(3):1653–60. doi: 10.1074/jbc.M109.051185. [DOI] [PMC free article] [PubMed] [Google Scholar]
- 10.Krycer JR, Brown AJ. Does changing androgen receptor status during prostate cancer development impact upon cholesterol homeostasis? PLoS One. 2013;8(1):e54007. doi: 10.1371/journal.pone.0054007. [DOI] [PMC free article] [PubMed] [Google Scholar]
- 11.Fletcher R, Gribben C, Ma X, Burchfield JG, Thomas KC, Krycer JR, James DE, Fazakerley DJ. The role of the Niemann-Pick disease, type C1 protein in adipocyte insulin action. PLoS One. 2014;9(4):e95598. doi: 10.1371/journal.pone.0095598. [DOI] [PMC free article] [PubMed] [Google Scholar]
- 12.Malide D, Ramm G, Cushman SW, Slot JW. Immunoelectron microscopic evidence that GLUT4 translocation explains the stimulation of glucose transport in isolated rat white adipose cells. J Cell Sci. 2000;113(Pt 23):4203–10. doi: 10.1242/jcs.113.23.4203. [DOI] [PubMed] [Google Scholar]
- 13.Kenwood BM, Weaver JL, Bajwa A, Poon IK, Byrne FL, Murrow BA, Calderone JA, Huang L, Divakaruni AS, Tomsig JL, et al. Identification of a novel mitochondrial uncoupler that does not depolarize the plasma membrane. Mol Metab. 2014;3(2):114–23. doi: 10.1016/j.molmet.2013.11.005. [DOI] [PMC free article] [PubMed] [Google Scholar]
- 14.Clark S, Eckardt G, Siddle K, Harrison LC. Changes in insulin-receptor structure associated with trypsin-induced activation of the receptor tyrosine kinase. Biochem J. 1991;276(Pt 1):27–33. doi: 10.1042/bj2760027. [DOI] [PMC free article] [PubMed] [Google Scholar]