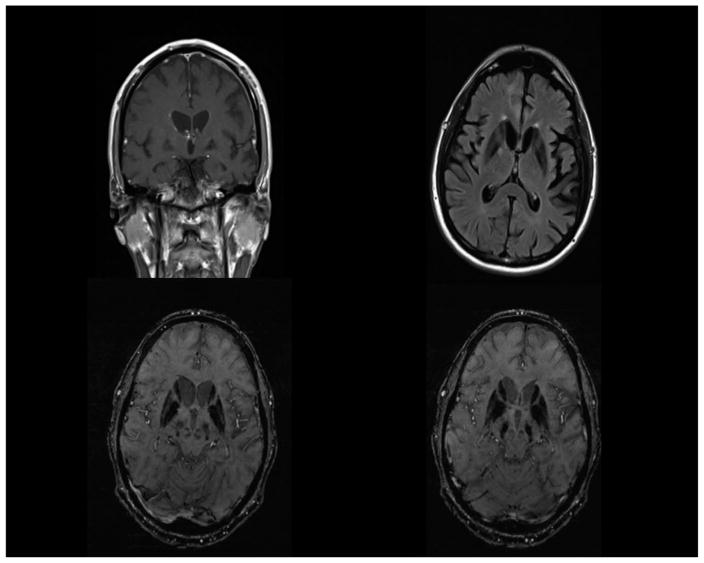
Figure 2.
Top left: 3T MRI T1 coronal image with contrast showing bifrontal parenchymal volume loss, asymmetric parenchymal volume loss of the temporal lobes, and hypointensity of the globi pallidi. Top right: 3T MRI FLAIR axial image showing hypointensity of the globi pallidi and putamina, mild periventricular white matter hyperintensities, and left greater than right temporoparietal parenchymal volume loss. Bottom left: 3T MRI susceptibility weighted image (SWI) showing hypointensity of the globi pallidi, caudate heads, and putamina and relatively hyperintense streaking of the medullary laminae. Bottom right: 3T MRI SWI showing hypointensity of the substantiae nigrae as well as the globi pallidi, caudate heads, and putamina.

