Abstract
Atmospheric monitoring systems (AMS) have been widely used in underground coal mines in the United States for the detection of fire in the belt entry and the monitoring of other ventilation-related parameters such as airflow velocity and methane concentration in specific mine locations. In addition to an AMS being able to detect a mine fire, the AMS data have the potential to provide fire characteristic information such as fire growth — in terms of heat release rate — and exact fire location. Such information is critical in making decisions regarding fire-fighting strategies, underground personnel evacuation and optimal escape routes. In this study, a methodology was developed to calculate the fire heat release rate using AMS sensor data for carbon monoxide concentration, carbon dioxide concentration and airflow velocity based on the theory of heat and species transfer in ventilation airflow. Full-scale mine fire experiments were then conducted in the Pittsburgh Mining Research Division’s Safety Research Coal Mine using an AMS with different fire sources. Sensor data collected from the experiments were used to calculate the heat release rates of the fires using this methodology. The calculated heat release rate was compared with the value determined from the mass loss rate of the combustible material using a digital load cell. The experimental results show that the heat release rate of a mine fire can be calculated using AMS sensor data with reasonable accuracy.
Introduction
Fires at different stages generate different gases and smoke toxicity hazards. When fires occur in underground mines, a significant amount of toxic gases and smoke enter the mine ventilation system and are carried throughout the mine ventilation network, increasing the hazard potential for personnel even if far away from the actual fire. Although fires that develop to the point of rapid flame spread pose imminent hazards, fires in their smoldering, pre-flaming stages can also contaminate the mine atmosphere with debilitating levels of smoke and toxic gases.
The most important parameter for evaluating the fire hazard in mines is the heat release rate (HRR), which is directly related to the rate at which heat, smoke and toxic gases are produced and transported by the ventilation system and which provides an indication of the time available for escape or firefighting (Babrauskas and Peacock, 1992). The HRR is also an important input parameter to mine fire simulation models.
Measuring the HRR of an actual fire can be a difficult task. Early experimental measurement of HRR focused on the heat output as represented by the temperature of the product gases. In the ASTM E1321 lateral ignition and flame spread test, or LIFT, an array of thermocouples was positioned in a duct that captured all gaseous combustion products to measure their average temperature. This approach assumed an adiabatic flow, which is never a reality. Significant progress on measuring HRR was made when Huggett (1980) showed that for most common materials containing carbon (C), hydrogen (H), oxygen (O) and nitrogen (N), the average heat release per unit mass of oxygen is 13.1 MJ/kg O2. Thus, the oxygen deficit is a measure of the HRR in the flow that the duct captures. This approach is termed oxygen consumption calorimetry, or the oxygen consumption method, and is widely used in the fire protection community.
The oxygen consumption method has been used in measuring the HRRs of mine fires. Hansen and Ingason (2013) conducted full-scale mine fire experiments to measure the HRRs of burning mining vehicles in an underground mine by measuring mass flowrates, gas concentrations and temperatures at certain heights at the end of the single mine drift downstream of the fire source. The HRR was calculated from measured data of gas concentrations of oxygen, carbon monoxide (CO) and carbon dioxide (CO2), gas velocity and gas temperatures, based on the principle of oxygen consumption calorimetry. The calculated peak HRR was 15.9 MW for a mine loader and 29.4 MW for a drilling rig. Fire was underventilated, and the oxygen deficit downstream of the fire source was significant.
Although the oxygen consumption method is simple and only requires measuring the rate of oxygen consumption from the burning of combustible material, the successful use of this technique is dependent on achieving accurate measurements of the oxygen concentration and flowrate. However, in well-ventilated fires, the oxygen deficit from the fire may not be significant enough to measure with confidence. From the standpoint of early fire detection, the fire at an early stage is often too small and well ventilated, and therefore it is difficult to estimate the HRR by measuring the oxygen deficit.
Estimation of heat release rate using CO and CO2 production rates
To overcome practical difficulties in measuring the HRR using the oxygen consumption method, Tewarson (2002) developed an alternative technique to calculate the HRR by measuring the production rates of CO and CO2. In his study, HRRs for a wide range of polymeric materials and flammable liquids calculated using CO and CO2 production rates were found to be approximately equal to the HRRs obtained using the oxygen consumption method. The advantage of the CO/CO2 method is that the changes of CO and CO2 concentrations are quite large, and can be measured accurately using CO and CO2 analyzers.
The HRR calculation using the CO and CO2 production rates measured at the exit of a duct or tunnel is expressed as:
| (1) |
where QA is the actual HRR in kW; HC is the total heat of combustion of the fuel in kJ/g and can be determined from the proximate analysis of the fuel; HCO is the heat of combustion of CO, 10.1 kJ/g; is the stoichiometric mass of CO2 produced per unit mass of the fuel; kCO is the stoichiometric mass of CO produced per unit mass of the fuel; is the production rate of CO2 from the fire in g/s; and ṁCO is the production rate of CO from the fire in g/s. Of these, and kCO are fuel-dependent constants and can be calculated using the carbon mass fraction of the fuel:
| (2) |
| (3) |
where XC is the carbon mass fraction of the fuel, which can be obtained from fuel ultimate analysis. For combustion of a fuel within a mine entry, the CO and CO2 production rates can be determined from their bulk-average concentrations downstream of the fire by the expressions:
| (4) |
| (5) |
where V is the exit average air velocity in m/s; A is the entry cross-section area in m2; is the density of CO2; ρCO is the density of CO; ΔCO2 is the concentration of CO2 produced in the fire in ppm; and ΔCO is the concentration of CO produced in the fire in ppm. Using the CO2 density of 1.97 kg/m3 and CO density of 1.25 kg/m3, the expressions become:
| (6) |
| (7) |
Underground mine fires are often well ventilated and the oxygen deficit caused by a fire in the airflow can be small, especially in the early stage of the fire. Tewarson’s approach is well adapted to the situation. Perzak et al. (1995) used this approach to calculate the HRR of a burning conveyor belt in a simulated mine entry through the measurement of CO and CO2 concentrations and airflow rate at the exit of the entry. Grant and Drysdale (1997) estimated the HRRs of burning heavy goods vehicles using CO and CO2 production rates measured in a series of full-scale tunnel fire tests. This method has also been used for determining the HRRs of different mine fires such as wood fires and coal fires in an intermediate-scale ventilated tunnel (Egan, 1987; Egan and Litton, 1986). In their experiments, multiple gas-sampling probes were placed near the exit of the tunnel to measure CO and CO2 concentrations using infrared gas analyzers.
In all of the above studies, experiments were conducted in a single entry or tunnel with the fire source located near the inlet and with measurements conducted near the outlet. In the current study, the HRR calculation method using CO and CO2 production rates was applied to the mine fires in an experimental mine with gas concentrations and airflow rates measured in multiple mine entries downstream from the fire source using AMS sensors. The effectiveness of this method was evaluated by comparing the calculated HRR with the theoretical value determined from the mass loss rate of the combustible material using a digital load cell.
Full-scale AMS tests
In an underground mine fire, if the airflow velocity and CO and CO2 concentrations downstream of the fire can be measured using AMS sensors, the HRR of the fire can be calculated using the previously introduced expressions. Full-scale fire experiments were therefore conducted in the Safety Research Coal Mine (SRCM) of the U.S. National Institute for Occupational Safety and Health (NIOSH) using an AMS to evaluate the effectiveness of this method. The SRCM is a multipurpose underground mine facility used to support research for the development and evaluation of new health and safety interventions for mine workers. It is a room-and-pillar operation approximately the size of a working section and is used for research in areas such as ventilation, fires, ground control, material handling and environmental monitoring.
In the AMS tests, the ventilation airflow downstream of the fire was split into multiple entries and then merged into the return entry. Ventilation airflow direction was controlled using brattices as temporary stoppings to isolate the airways. Figure 1 is a mine map of the SRCM showing the airflow travel routes, marked as orange, and the locations of the AMS sensor stations, designated from S1 to S8. Combustion products from different fire sources were transported by the ventilation airflow through the mine entries, where eight sensor stations were installed at various locations along the airflow travel routes. At each sensor station, a CO, CO2 and O2 sensor, an airflow velocity sensor that is different from an anemometer, and a smoke sensor were installed near the roof to monitor the arrival of smoke and combustion products. Figure 2 shows the different AMS sensors installed in one station. The CO, CO2 and O2 sensors used in the tests were diffusion-type electrochemical sensors. Each gas sensor was calibrated before the test with the standard calibration gas.
Figure 1.
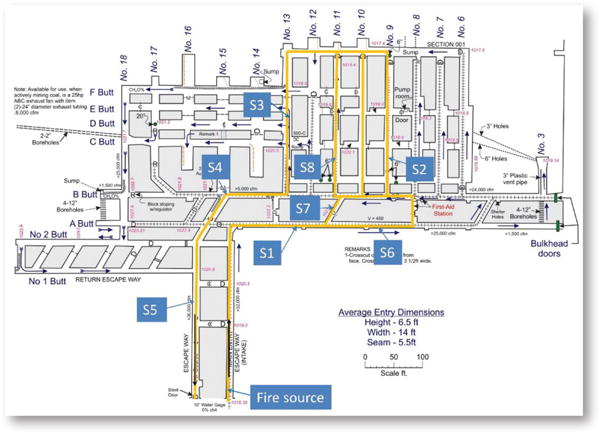
Schematic of the Safety Research Coal Mine (SRCM) and sensor stations.
Figure 2.
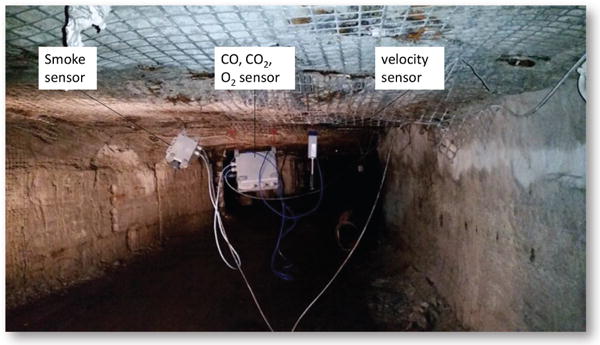
AMS sensors installed at one sensor station.
The fire source was located along the main intake entry 10 m (33 ft) from the portal inlet, as shown in Fig. 1. Three types of combustibles were used as fire sources: Pittsburgh seam coal, conveyor belt and diesel fuel. Coal and conveyor belt are the two most common solid combustibles in underground coal mines, while diesel fuel is representative of liquid combustibles found in underground mines. For the coal fire test, about 20 kg (44 lb) of coal was placed on eight electrical strip heaters in a metal tray (Fig. 3). For the conveyor belt test, the 5.8-kg (13-lb) belt was cut into 48 pieces, each 7.6 cm by 7.6 cm (3 in. by 3 in.), which were placed on a metal plate with eight electrical strip heaters placed between two layers of belt pieces (Fig. 4). For the diesel fuel test, various amounts of diesel fuel were used in different containers. In one test, 7.6 L (2 gal) of No. 2 diesel fuel was burned in a 0.6-m by 0.6-m (2-ft by 2-ft) pan. In two other tests, 11.4 and 18.9 L (3 and 5 gal) of the same diesel fuel were burned in a steel mortar pan, respectively. The mortar pan had a constant width and a variable length that increased linearly with the depth of the pan.
Figure 3.
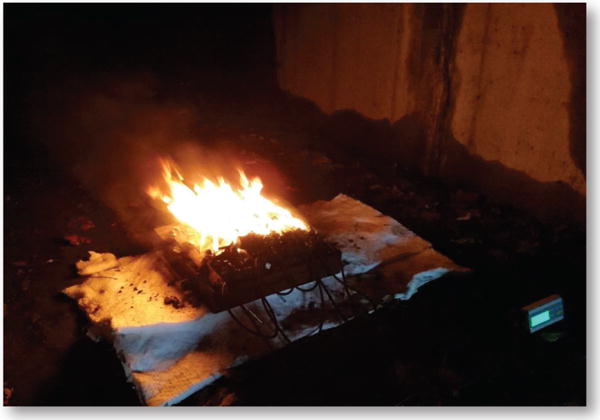
Flaming coal fire.
Figure 4.
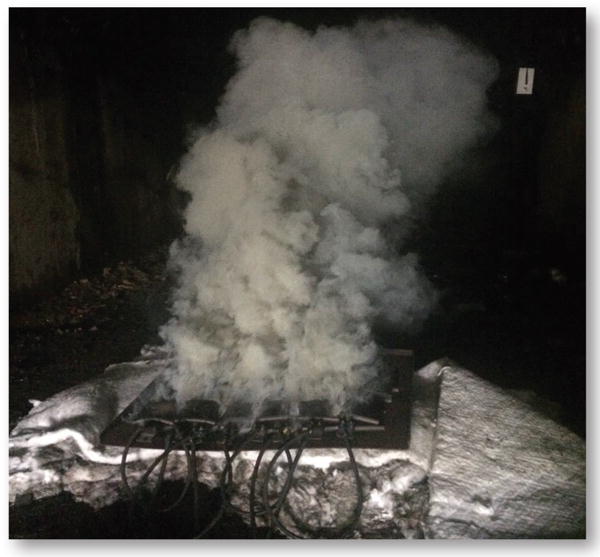
Smoking conveyor belt fire.
For each test with coal or belt material, the electrical heaters were first turned on. As the coal or belt was heated, it underwent smoking and eventually flaming. The ignition of the diesel fuel was achieved using a propane burner. In each test, the metal tray or pan was placed on a digital load cell to measure the mass loss rate of the burning material. To ensure the load cell temperature was below its operational limit of 40°C (104°F), thermal insulation material was placed between the fuel tray/pan and the load cell to protect the load cell as shown in the figure. The mass loss rate data were collected and sent to a computer at time intervals of 0.4 s. For the coal and belt tests, the fire was manually extinguished after the burning was observed to be noticeably dying. For the diesel fuel test, the fire was allowed to burn until the fuel was consumed.
Airflow rate calculation using airflow velocity sensor data
To calculate the HRR of a fire, the average airflow velocity in the mine entry needs to be determined. The average airflow velocity in the entry is usually manually measured transversely using a vane anemometer. In this study, a point-type AMS airflow velocity sensor was used to continuously measure the airflow velocity. To calculate the airflow rate, it is necessary to correlate the fixed-point airflow velocity sensor reading to the average airflow velocity at that location. The concept of a “correction factor” has been used to convert the velocity at one point to the average velocity required to compute average volume flow rate. The correction factor can be determined by comparing the velocity reading obtained from a stationary anemometer at a known location within the cross-sectional area and averaging the measured velocities from a series of anemometer traverses for the same location. According to McPherson (2009), a correction factor of 0.75 to 0.8 is typical for the fixed point located at one-half to two-thirds the height of the airway. However, the recommended value of the correction factor may not be valid for fixed-point measurement using an AMS airflow velocity sensor. In this study, the point-type AMS airflow velocity sensor readings were compared with the average airflow velocities using an anemometer, and a correlation was developed between the airflow sensor reading, Vs, and the average airflow velocity, V:
Results and discussion
A total of 11 full-scale mine fire experiments were conducted in the SRCM using an AMS with five coal fires, three conveyor belt fires and three diesel fuel fires. For the coal fires, the same amount of coal was used with different ventilation airflow rates. For the belt fires, a different type of belt was used in each test with the same ventilation airflow rate. For the diesel fuel fires, different amounts of fuels were used in each test with the same ventilation airflow rate. For all the fuels used in the tests, proximate and ultimate analyses were conducted to obtain the values of heat of combustion and the carbon mass fraction of the fuel.
Mass loss rate
The mass loss rate of the burning material, measured using the digital load cell in the test, can be used to calculate the theoretical HRR, Qth, of the fuel as:
Figure 5 shows the typical mass loss rate curve for the burning of Pittsburgh coal. There are three stages for the burning of a solid combustible: smoking, flaming, and decay. For the coal fire, it took more than six minutes for the smoke to first appear. The smoking lasted more than nine minutes before developing into a flaming fire. During the flaming stage, the burning of coal reached a nearly constant rate. For the belt fire, smoke appeared four minutes after the heaters were turned on, and the smoking stage changed to a flaming stage after 10 minutes. At the flaming stage, the burning became steady with an approximately constant mass loss rate. For the diesel fuel fire, once the fuel was ignited, the flame spread over the entire surface, and burning reached a constant rate quickly. After most of the fuel was expended, the flame did not cover the entire surface, the burning rate decreased, and eventually the fire self-extinguished.
Figure 5.
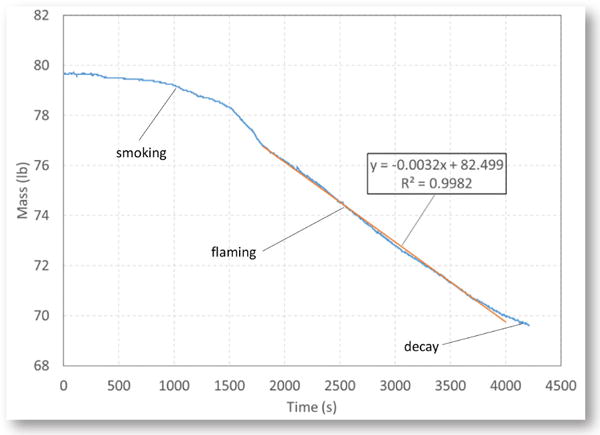
Mass loss curve during the burning of Pittsburgh coal.
To calculate the theoretical HRR, the mass loss rate during the constant burning rate stage was determined by linear least-squares fitting to the experimental data. As expected, the diesel fuel fire had the highest mass loss rate, while the coal fire had the lowest mass loss rate.
CO and CO2 concentrations
In the tests, CO and CO2 produced from the fire were transported by the ventilation airflow first through sensor station S1. Next, the airflow was split into two entries through sensor stations S6 and S7 and then split into three entries downstream through sensor stations S2 and S8. Finally, the airflows merged into a single entry, passing through sensor stations S3, S4 and S5, respectively. In this study, the focus was on the measurements at sensor stations S1, S6 and S7. As no air leaked in and no gaseous products of combustion leaked out between S1 and S6 and S7, the measured CO and CO2 concentrations at S1, S6 and S7 were expected to be similar. They could be affected by dispersion, but the total mass of each product passing a station would be the same. The sensor data from the other sensor stations will be discussed in a separate publication. It was found in a previous study that CO concentration downstream of a fire could be reduced significantly due to leakage through ventilation structures (Yuan, Zhou and Smith, 2016).
Figure 6 shows the CO concentrations at stations S1, S6 and S7 from a typical coal fire. The measured CO concentrations at those three stations were not exactly the same, but were very close. The sensor response and measurements seemed to be somehow affected by the airflow velocity at the station. The typical airflow velocity at S6 was usually lower than those at S1 and S7 (Fig. 7). Although S6 and S7 were downstream of S1, the sensor at S7 reacted at the same time as the sensor at S1, and the sensor at S6 reacted later than the sensors at S1 and S7 (Fig. 6).
Figure 6.
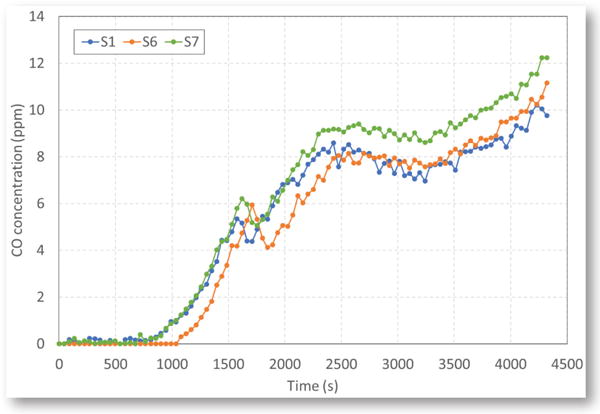
CO concentrations at three sensor stations during a coal tire.
Figure 7.
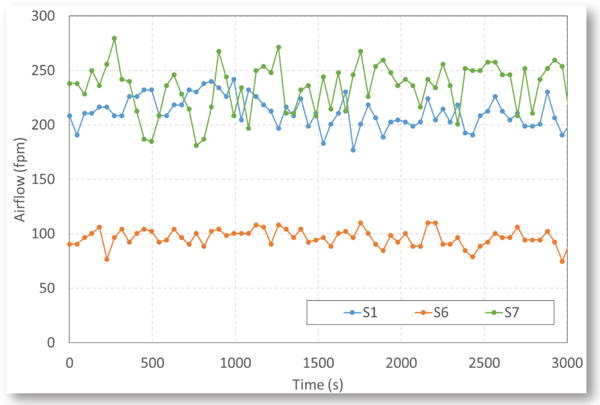
Typical airflow velocities measured at three sensor stations during a test.
Figure 8 shows the CO2 concentrations at stations S1, S6 and S7 from the same coal fire. The CO2 values discussed in this paper are the increases from the original values in normal air. The CO2 concentration at each station was much higher than the CO concentration. It can be seen from Figs. 6 and 8 that at the early stage of smoking, some CO was produced, while there was nearly no CO2 produced. Once the smoking changed to flaming, CO2 was produced and its concentration increased quickly to a maximum value and then decreased when the burning of coal started to decline visibly. However, the CO concentration continued to increase even after the burning started to decline — probably because some coal was still smoldering and releasing CO (Egan, 1987).
Figure 8.
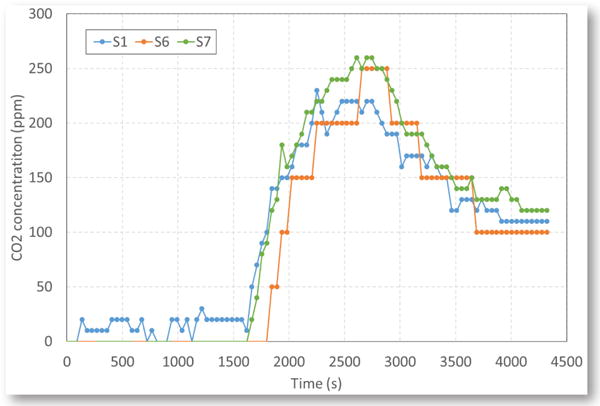
CO2 concentrations at three sensor stations during a coal fire.
Figures 9a and 9b show the CO and CO2 concentrations at stations S1, S6 and S7 from a belt fire. It is interesting to note that during the smoking stage of the belt, there was nearly no CO and CO2 produced. It was observed in the test that a large amount of white smoke was produced during this smoking stage, the same as reported by Litton, Lazzara and Perzak (1991). Both CO and CO2 concentrations were produced and increased quickly when the smoking of the belt changed to flaming.
Figure 9.
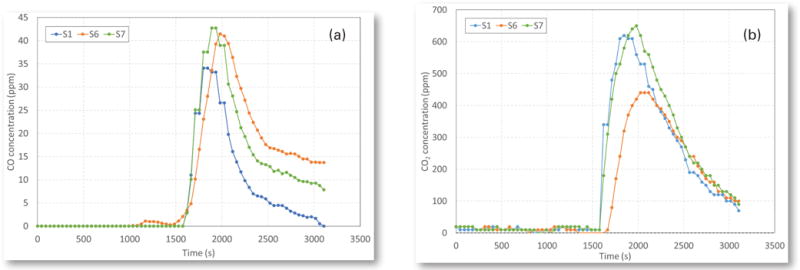
(a) CO concentrations and (b) CO2 concentrations at three sensor stations during a belt fire.
Actual HRRs using AMS sensor data
The HRRs of fires were calculated based on the CO, CO2 and airflow velocity data from AMS sensors. As the theoretical HRR of a fire based on mass loss rate is a constant and maximum value during the constant burning rate stage, the maximum CO and CO2 concentrations were used in the actual HRR calculation. The airflow velocity was continually fluctuating during the test, so the average velocity was used for the actual HRR calculation.
Table 1 shows the actual HRRs, QA, of fires, calculated using the AMS sensor data, and the theoretical HRRs, Qth, calculated using the measured mass loss rate, along with their ratios, QA/Qth, defined as combustion efficiency. The actual HRRs from diesel fuel fires were very close to the theoretical values — as diesel fires have the highest combustion efficiency — while the belt fires exhibited the lowest combustion efficiency. It should be pointed out that the actual HRR of a fire was mainly determined by the CO2 production rate. The contribution of CO production rate in calculating the HRR was less than three percent for the coal and diesel fires and around 10 percent for the belt fires, as the maximum CO and CO2 concentrations were used in the calculation.
Table 1.
Calculated theoretical HRRs, Qth, actual HRRs, QA, and their ratios, QA/Qth, defined as combustion efficiency.
| Fire | Qth (kW) | QA (kW) | QA/Qth (%) |
|---|---|---|---|
| Coal #1 | 36.0 | 31.8 | 88.2 |
| Coal #2 | 38.3 | 35.2 | 91.9 |
| Coal #3 | 39.6 | 35.8 | 90.4 |
| Coal #4 | 42.5 | 38.4 | 90.2 |
| Coal #5 | 47.0 | 36.5 | 77.6 |
| Belt #1 | 75.7 | 56.1 | 74.1 |
| Belt #2 | 92.5 | 71.5 | 77.3 |
| Belt #3 | 148.2 | 103.8 | 70.0 |
| Diesel #1 | 282.0 | 266.1 | 94.4 |
| Diesel #2 | 321.5 | 317.0 | 98.6 |
| Diesel #3 | 1,118.4 | 1,081.9 | 96.7 |
The accuracy of the HRR calculation using AMS sensor data is dependent on the accuracy of the measurements of airflow velocity and CO and CO2 concentrations. At the very early state of a fire, CO2 concentrations lower than 500 ppm may be difficult to measure accurately with AMS sensors. There are also other possible sources of error, including variations in the entry area and the shape of the velocity profile as well as the influence of air velocity on the sensor readings. As sensor technology advances in the future, the accuracy of gas concentration measurement can be expected to improve significantly.
Conclusions
A method was developed to calculate the HRR of a mine fire using real-time AMS sensor data. The sensor data needed in the calculation are the CO concentrations, CO2 concentrations and airflow velocity downstream of the fire. Full-scale mine fire experiments with different fire sources were conducted in the NIOSH SRCM using an AMS to evaluate the effectiveness of this method. The sensor measured a fixed-point airflow velocity, which was correlated to the average airflow velocity measured transversely with an anemometer at the same location. The experimental results demonstrate that the calculated actual HRRs using this method are in good agreement with the theoretical HRRs of the fires calculated using the measured mass loss rate of the burning combustibles. This methodology can provide realtime mine fire intensity information for mine fire simulation and help miners, management and safety personnel make important decisions in the event of a mine fire.
Acknowledgments
The authors wish to thank John Soles of the Pittsburgh Mining Research Division for conducting the full-scale mine fire experiments.
Footnotes
Disclaimer
The findings and conclusions in this report are those of the authors and do not necessarily represent the views of NIOSH.
References
- Babrauskas V, Peacock RD. Heat Release Rate - the Single Most Important Variable in Fire Hazard. Fire Safety Journal. 1992;18:255–272. https://doi.org/10.1016/0379-7112(92)90019-9. [Google Scholar]
- Egan MR. Report of Investigations. U.S. Bureau of Mines; 1987. Coal Combustion in a Ventilated Tunnel; p. 9169. [Google Scholar]
- Egan MR, Litton CD. Report of Investigations. U.S. Bureau of Mines; 1986. Wood Crib Fires in a Ventilated Tunnel; p. 9045. [Google Scholar]
- Grant GB, Drysdale D. Estimating heat release rates from large-scale tunnel fires. Fire Safety Science — Proceedings of the Fifth International Symposium. 1997:1213–1224. https://doi.org/10.3801/iafss.fss.5-1213.
- Hansen R, Ingason H. Heat release rate measurements of burning mining vehicles in an underground mine. Fire Safety Journal. 2013;61:12–25. https://doi.org/10.1016/j.firesaf.2013.08.009. [Google Scholar]
- Huggett C. Estimation of rate of heat release by means of oxygen consumption measurements. Fire & Materials. 1980;4:61–65. [Google Scholar]
- Litton CD, Lazzara CP, Perzak FJ. Report of Investigations. U.S. Bureau of Mines; 1991. Fire Detection for Conveyor Belt Entries; p. 9380. [Google Scholar]
- McPherson MJ. Subsurface Ventilation and Environmental Engineering. 2nd. Chapman & Hall; New York: 2009. p. 905. [Google Scholar]
- Perzak FJ, Litton CD, Mura KE, Lazzara CP. Report of Investigations. U.S. Bureau of Mines; 1995. Hazards of Conveyor Belt Fires; p. 9570. [Google Scholar]
- Tewarson A. The SFPE Handbook of Fire Protection Engineering. 3rd. National Fire Protection Association and The Society of Fire Protection Engineers; Quincy, MA: 2002. Generation of heat and chemical compounds in fires. [Google Scholar]
- Yuan L, Zhou L, Smith AC. Modeling carbon monoxide spread in underground mine fires. Applied Thermal Engineering. 2016;100:1319–1326. doi: 10.1016/j.applthermaleng.2016.03.007. https://doi.org/10.1016/j.applthermaleng.2016.03.007. [DOI] [PMC free article] [PubMed] [Google Scholar]


