

Abstract
Pathogenic protein fibrils have been shown in vitro to have nucleation dependent kinetics despite the fact that one-dimensional structures do not have the size dependent surface energy responsible for the lag time in classical theory. We present a theory showing that the conformational entropy of the peptide chains creates a free energy barrier that is analogous to the translational entropy barrier in higher dimensions. Interestingly, the dynamics of polymer rearrangement make it very unlikely for nucleation to succeed along the lowest free energy trajectory, meaning that most of the nucleation flux avoids the free energy saddle point. We use these results to construct a 3D model for amyloid nucleation that accounts for conformational entropy, backbone H-bonds, and sidechain interactions to compute nucleation rates as a function of concentration.
Amyloids are linear protein aggregates associated with conditions like Alzheimer’s, Huntington’s, and prion diseases [1]. When studied in vitro, amyloidogenic proteins remain soluble through a pronounced lag phase before undergoing a nucleation event that initiates exponential growth of fibrils [2, 3]. Previous theoretical work has shown that the proliferation of fibrils is dominated by secondary nucleation events that follow primary nucleation [4–8]. But these works do not address the underlying molecular mechanism of either primary or secondary nucleation and, therefore, it is not clear if they can be extrapolated to the low concentrations found in vivo. In particular, it is a puzzle why linear aggregates have a lag phase in the first place. In bulk phase transitions the nucleation lag time occurs because the surface energy of the new phase, which arises from the translational entropy loss of the bound particles, initially grows faster than the favorable bulk energy. This does not apply to 1D systems where the surface energy is independent of the cluster size. The reason for nucleation kinetics in amyloids is almost certainly because fibrils are only pseudo-1D. Several authors have noted that the steric zipper motif [9, 10] gives the fibrils a thickness in a direction perpendicular to the fibril axis [11–13]. These theories model the fibril as a 2D object, thereby achieving the size-dependent surface energy needed for a lag time.
In this Rapid Communication we investigate the effect of the third dimension: the direction parallel to the peptide backbones. In a growing post-nucleation fibril, each backbone H-bond and steric zipper interaction must overcome a free energy increase fCE from the conformational entropy cost of trapping the backbone in the extended β-sheet conformation. This contrasts with the initial dimerization of two molecules where each intermolecular contact results in the loss of entropy from both chains for a free energy gain of 2fCE (the Ramachandran analysis shows that both molecules must adopt β conformation to maintain the intermolecular bonds). Importantly, the increased entropic penalty for the initial dimerization results in a free energy barrier that will contribute to the nucleation time [14, 15].
We focus on intrinsically disordered molecules at low concentration where monomer assembly pathways are expected to be dominant [16–18]. As a first step we compute the kinetics of a nucleating trimer as a toy model to explore the competition between binding energy and the conformational entropy of the polymers. Using the intermolecular H-bonds as a reaction coordinate [19–21], we map the kinetics to a 2D diffusion problem for which we can obtain an exact solution (albeit in the continuum limit). This model shows that the saddle point state is particularly prone to dissociation so that most of the nucleation flux avoids the saddle point. This implies that self-assembly in this system requires trajectories that are ‘far’ from equilibrium [22]. Next, we use these results to build a second model that allows us to account for both H-bond and steric zipper interactions as well as the growth of a cluster beyond the trimer stage. This model allows us to treat the nucleus as a 3D object and include the contributions of both conformational and translational entropy to the free energy barrier.
The nucleation rate is the product of a free energy barrier, an attempt rate, and a success probability
We develop our theory by modifying the nucleation rate from classical nucleation theory (CNT)
| (1) |
The terms in Eq. 1 can be understood as follows. The exponential term is an Arrhenius factor giving the probability of finding a cluster at the free energy maximum F‡. Hereafter, we refer to the highest free energy state along a given trajectory as the “critical” state with quantities associated with this state denoted by the (‡) superscript. kadd is the rate at which a molecule attaches to the cluster making it super-critical. Finally, the Zeldovich factor, Z, describes the probability that a newly super-critical cluster will nucleate the new phase without returning to a sub-critical size. Eq. 1 was derived using the cluster size as a 1D reaction coordinate and applying a saddle point approximation [23]. We find that a 1D reaction co-ordinate is not sufficient to describe amyloid nucleation. Rather than re-deriving an analogous expression in 2D, we use Eq. 1 as a heuristic and independently compute each of the three terms.
2D model describes competition between H-bonds and conformational entropy
We first consider a toy model of nucleation consisting of three molecules forming one β-sheet. This model is the simplest one that captures the entropy penalty of initial dimerization and the attractive free energy of a “bulk” binding event. There are two reaction coordinates; x is the number of H-bonds between molecules 1 and 2 and y is the number of H-bonds between molecules 2 and 3 (see Fig. 1). The system can evolve in four ways; it can add or break a H-bond between the first two molecules with rates k+x and k−x, respectively, or between molecules 2 and 3 with rates k+y and k−y. Despite the x ↔ y symmetry, the rates are not equal. To see this, we use detailed balance to relate the reaction rates to the free energy of H-bond formation
| (2) |
In the configuration shown in Fig. 1, x > y meaning that the transition x → x + 1 will result in a loss of conformational entropy from both molecule 1 and 2 and the formation of one favorable H-bond contact. In comparison, the transition y → y +1 only results in a loss of entropy from molecule 3 while providing the same attractive H-bond. Therefore, when x > y we have fx = fweak > 0 and fy = fstrong < 0. For x < y the situation is reversed and the energies are fx = fstrong and fy = fweak. For nucleation to occur within a three molecule system we require that the fully bound state is lower in free energy than the unbound state so fstrong + fweak < 0. As described below, it is unlikely that peptides satisfy this condition, however, this model captures the effect of conformational entropy on nucleation rate and, therefore, provides useful intuition.
FIG. 1.
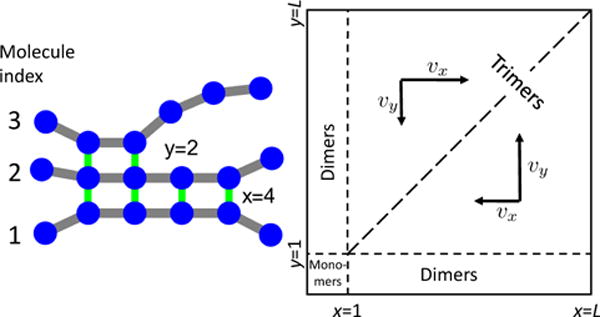
Cartoon of a nucleating trimer illustrating the two-dimensional reaction coordinate used in the theory. A configuration of the trimer is mapped to the x–y plane where the x coordinate is the number of H-bonds between the middle and lower molecules and y is the number of H-bonds between the top and middle molecules. The formation and breakage of H-bonds results in a random walk in this 2D space. The unequal free energies of H-bond formation mean that the random walk is biased by drift velocities that push the system toward the x = y diagonal.
Unstable dimers provide the substrate for nucleation
In analogy to Eq. 1, we write the nucleation rate for a fibril as
| (3) |
Here, is the concentration of a critical cluster containing n‡ molecules. In the trimer model, [40] where C2(x) represents the equilibrium concentration of dimers with x H-bonds at the supersaturated monomer concentration C1
| (4) |
where all concentrations are scaled by the concentration of pure water (55.5 M) to yield dimensionless number densities and the monomer concentration plays the role of the fugacity, . The difference between Eq. 1 and Eq. 3 is the explicit summation over trajectories in the 2D reaction coordinate space. These trajectories are indexed by the number of H-bonds in the initial dimer, x, which has a maximum value, L, set by the length of the molecules.
The factor kdiff is the diffusion limited rate of monomer-dimer collisions resulting in trimers. Following [20], we approximate kdiff by the rate of particles striking an absorbing sphere of radius a, kdiff = 4πaC1Dp, where Dp is the monomer diffusion constant. This rate assumes that all collisions result in binding and, therefore, neglects sequence effects that enforce specific alignments between the molecules. This treatment is certainly appropriate for homopolymers like polyglutamine, but may be more generally valid if small clusters have the flexibility to accommodate sidechain packing errors. The opposite case, where sidechain registry is rigorously enforced, can be described by scaling kdiff by L−1.
Finally, like the Zeldovich factor, ε+ describes the probability of successful nucleation. We assume that the initial contact between a dimer and monomer results in a β-sheet H-bond so that a dimer with n H-bonds becomes a trimer with coordinates (n, 1) in (x, y) space. This trimer will evolve according to the rate constants in Eq. 2 and perform a random walk in the (x, y) plane. For successful nucleation we require that the walk proceed to (L, L) without striking the boundaries (x, 0) or (0, y) which signify dissolution back to the monomer+dimer state. Therefore, ε+(x, y) is the splitting probability that a random walk starting at (x, y) reaches (L, L) before reaching either the x or y axes.
The nucleation probability is described by 2D diffusion
In the continuum limit the success probability satisfies the convection-diffusion equation [24]
| (5) |
where the velocity and diffusion tensor are defined by
| (6) |
| (7) |
The velocity is constant on either side of the x = y diagonal but switches direction such that the drift always pushes the random walk toward the diagonal (Fig. 1).
The rate constants are related to each other by the free energy of the H-bond being broken/formed (Eqs. 2), however, the values are unknown beyond an expectation that the rates are on the order of ns−1 [25]. Therefore, we adopt a convention where the forward and backward rates have a constant average D = (k+x + k−x)/2 = (k+y + k−y)/2 ≃ 1ns. This assumption is motivated by the simplification resulting from isotropic diffusion. However, it also qualitatively captures our expectation that weak bonds form more slowly than strong bonds because both peptide chains must simultaneously adopt β conformation. Similarly, we expect that weak bonds will break faster than strong bonds because there are twice as many degrees of freedom that can lead to bond breakage.
With Eqs. 2, 6, and the assumption of isotropic diffusion, the drift velocities can be expressed as
| (8) |
where f is either fweak or fstrong as appropriate. Eq. 5 can then be solved. See Supplemental Material at [URL will be inserted by publisher] for details of the solution. For x > y we find
| (9) |
where v = |v|, I is the modified Bessel function, and the first four coefficients are B2 = 1, B3 = B5 = 2(vx−vy)/v, and B4 = 2(vx − vy)2=v2. The solution for y > x can be obtained by exchanging x ↔ y.
Clusters with low free energy have low probability for successful nucleation
Fig. 2 shows the two dominant contributions to the nucleation rate. Fig. 2a shows the probability ε+ that a trimer with (x, y) intermolecular H-bonds proceeds to the fully H-bonded state without dissociating back to monomer+dimer. This is an increasing function of x and y. In particular, ε+ is very small near the origin because these trimer states readily decay by losing either terminal molecule.
FIG. 2.
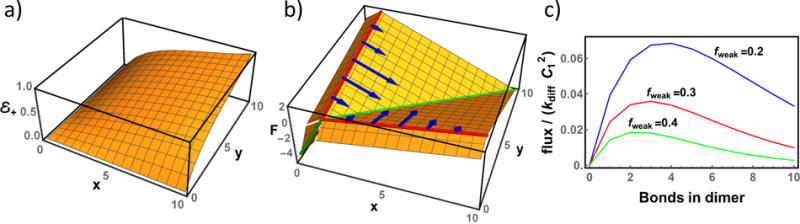
(a) Probability of a trimer containing x and y intermolecular bonds to proceed to the fully bound state before either terminal molecule unbinds. (b) Grand free energy (in units of kBT) of a trimer as a function of the number of intermolecular bonds. The increase in free energy when x or y increase from 0 to 1 arises from the loss of translational entropy upon molecular binding. This jump, given by kBT ln C1, is arbitrarily set to 2kBT for convenient visualization. There is a pronounced trough along the x = y diagonal (green line), however, due to the low probability of nucleation when x and y are both small (panel a) most nucleation trajectories (blue arrows) avoid this path. (c) The nucleation flux as a function of the number of bonds in the starting dimer (see Eq. 3). This is proportional to the product of the nucleation probability (panel a) along the y = 1 line and the dimer Boltzmann weight (y = 0 line in panel b). The competition between these terms gives a non-monotonic function that has a peak significantly removed from the lowest free energy pathway (x = 1). This is shown schematically by the blue arrows in the middle panel. L = 10, fstrong = −0.5, fweak = 0.3 unless noted.
Fig. 2b shows the grand free energy of the cluster as a function of x and y. The loss of translational entropy, μ = kBT ln C1, upon molecular binding results in a discontinuous jump in the free energy when x or y become nonzero. There is a pronounced valley along the x = y diagonal indicating the lowest free energy pathway to nucleation. This is the pathway that would be chosen in an attempt to model nucleation using a 1D reaction coordinate (as in a saddle point approximation). Note that the free energies are repulsive when there is a large mismatch between x and y. Of particular interest are the dimer states, where either x or y are zero, since these states are the starting point for nucleation attempts (Eqs. 3, 4). These states have especially unfavorable free energies due to the entropic cost of straightening both peptides and are strongly suppressed thermodynamically.
These two plots lead us to the primary result of the trimer model. Dimers held together by a small number of H-bonds are plentiful but have a low probability of nucleation because, upon the addition of a third molecule, the ensuing trimer has many trajectories that take it back to the dimer state. Conversely, dimers that have formed many H-bonds are rare but are likely to proceed toward nucleation upon the addition of a third molecule. The result of these competing trends is that the nucleation flux is a non-monotonic function of the starting dimer structure with the peak flux originating from a partially ordered nucleus (Fig. 2c). Note that the suppression of flux at the saddle point is not simply a result of the uniqueness of this trajectory compared to the multitude of non-saddle point trajectories, instead, the system dynamics make is so that successful passage through the saddle point is especially unlikely.
3D model contains both backbone and sidechain interactions
While the trimer model presented above provides useful intuition into the nucleation process, it neglects major features of amyloid nucleation. To address this we seek a model that can handle arbitrary sized clusters and accounts for the contributions of both backbone H-bond and sidechain steric zipper interactions in compensating for the translational and conformational entropy loss upon aggregation. In this model we consider a cluster of N molecules, each of which have x amino acids in the ordered β core and L − x that remain disordered with a reference free energy of zero. Following the usage of Eq. 3, x will be used to index trajectories.
As input for the model, we require estimates of the free energy as a function of x and N. In a mature fibril the free energy gain upon the addition of a new molecule is on the order of fαα ≃ −0.5 kBT per amino acid in the cross-β core [15, 26]. This free energy is the sum of three contributions, fαα = fHB + fSZ + fCE, where the terms represent the backbone H-bond, sidechain packing in the steric zipper, and the loss of conformational entropy. Helix-coil models have shown that fCE is on the order of ∼ 2kBT [27] so the two attractive components sum to approximately −2.5 kBT. As a crude estimate we will say that fHB ≃ −1.5 kBT and fSZ ≃ −1 kBT. Using the structures illustrated in Fig. 3a we estimate the energies as x(2fCE +fHB) for the dimer, x(3fCE +fHB +2fSZ) for the trimer, and x(4fCE + 2fHB + 2fSZ) for the tetramer. Therefore, the highest free energy cluster is a trimer. This analysis is valid for molecules that form a single β-strand in the fibril. An important second case to consider is molecules like Aβ and IAPP [28–30] that form a hairpin and contribute β-strands to both layers of the fibril (Fig. 3b). For these molecules the highest free energy state is a hairpin monomer. The formation of a hairpin incurs an entropic cost of kBT ln xloop, where xloop is the number of disordered amino acids between the β segments. This term is ∼2–3 kBT, which is less than the translational entropy cost of making the equivalent structure from two molecules. The looping penalty can be mitigated by attractive sidechain interactions, which may be responsible for the difference in aggregation propensity between Aβ40 and Aβ42 [31]. With these calculations, the Arrhenius terms for single strand and hairpin molecules are
| (10) |
FIG. 3.
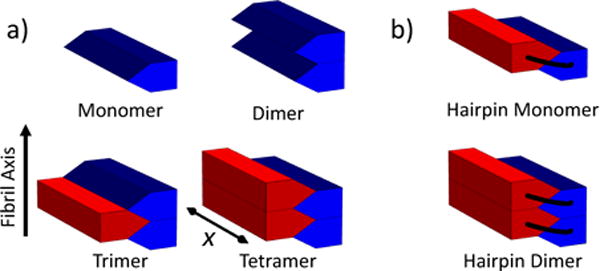
Schematic of the assembly process described by the 3D model for (a) peptides that form a single β-sheet and (b) peptides that form two β-sheets separated by a hairpin. Each block represents a β strand consisting of x amino acids. Disordered peptide segments have been omitted for clarity. The two β-sheets of the nascent fibril are color coded so red/blue (light grey/dark grey) interfaces represent sidechain steric zipper interactions while red/red and blue/blue interfaces represent backbone H-bond interactions.
These calculations show that the population of critical clusters is exponentially sensitive to both the number of molecules in the cluster and the size of the ordered core. As the cluster grows the bulk interactions in the core, contributing a free energy (N − 2)xfαα, will gradually overwhelm the surface energy 2xfCE + N ln C1. Adding these terms together and requiring that the resulting free energy is stationary in x, we obtain the minimum number of β-strands, N* = 2 − 2fCE/fαα, necessary for it to be energetically favorable for x to grow. Thus, when the cluster exceeds N* ≃ 10 β-strands, fibril growth transitions from nucleation to elongation.
Next, we need to evaluate the size evolution of clusters smaller than N*. These clusters will add a molecule with rate kdiff and lose a molecule when either terminal strand breaks all x bonds with the neighboring molecules. The rate of such loss events is given by [20]
| (11) |
where vf is given by Eq. 8 with f = fαα, the factor of two accounts for the two ends of the fibril, and the substitution x → 2x should be made for hairpin molecules. The probabilities that a cluster gains or loses a molecule are p+mol = kdiff(kdiff + kloss)−1 and p−mol = kloss(kdiff + kloss)−1. We expect that in vivo kloss greatly exceeds kdiff, so nucleation depends on the unlikely event where many molecules add with few detachments [32]. The tendency for backwards steps is prohibitive for nucleation unless the cluster can present a binding surface large enough to prolong the residence time of incoming molecules. Thus, the present model contains the same physics obtained from the trimer model; that successful nucleation events are dominated by highly ordered states that are significantly displaced from the saddle point.
To compute the nucleation rate in our 3D model, we make the approximation that x remains constant until the cluster reaches a stable size and compute the nucleation rate by summing the rates of clusters of all core sizes. This rough approximation is the simplest approach to take without knowing the relative timescales for the evolution of N and x. The reduction of the 2D Markov process (in N and x) to a 1D walk (in N only) assumes that the energetically favorable H-bonds will bias the bonding states of the molecules toward the maximum number of bonds until the actual unbinding event. With this simplification, the required Zeldovich factor in Eq. 3 is the probability of a super-critical cluster with size n‡ + 1 reaching the stable size N* without becoming smaller than n‡. The probability of such walks is (see Supplemental Material for derivation)
| (12) |
Theory predicts two power law regimes
The nucleation rate for the 3D model is given by Eq. 3 with Eqs. 10 and 12 for the Arrhenius and Zeldovich terms. At low concentrations, representative of in vivo systems, the nucleation rate scales like (Fig. 4). This gives and for single strand and hairpin molecules, respectively, although this prediction is sensitive to sequence dependent binding energetics. At high concentrations it becomes more likely that molecules bind than unbind and the Zeldovich factor saturates at unity giving a concentration dependence of . This corresponds to for single strand molecules and for hairpin molecules in agreement with previous theory and experiment [33–35].
FIG. 4.
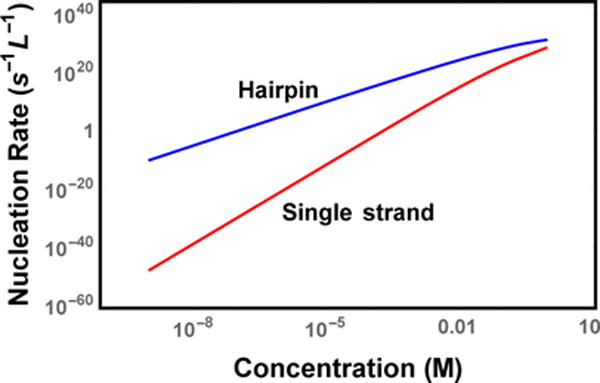
Nucleation rate of hairpin and single strand molecules. Molecules that form hairpin structures nucleate much faster than molecules that only contribute one strand because of the reduced translational entropy penalty to form the nucleus. The curvature at high concentration is due to the saturation of the Zeldovich factor.
Measured nucleation rates range from ~ 10−11 L−1s−1 at μM concentrations (Aβ) to ∼ 106 L−1s−1 at mM concentrations (insulin) [3, 8, 34]. Assuming these molecules nucleate by the hairpin mechanism, these rates are considerably slower than the predictions of our theory. While it is well known that nucleation theories often suffer from quantitative discrepancies despite capturing the scaling trends [36–39], there are several features of the theory that may also be contributing. These include approximations like the projection of the nucleus growth onto a 1D random walk, the absorbing boundary condition at a cluster size of N*, and the neglect of sequence effects. In particular, the latter contribution is particularly large because the requirement of in-register binding is equivalent to reducing the effective concentration by ~ L−1.
Despite the over-estimate of nucleation rates at in vitro concentrations, the predicted rates shown in Fig. 4 lead to the conclusion that homogenous nucleation is too slow to be significant at physiological concentrations. There-fore, nucleation under these conditions will require heterogeneous mechanisms to ameliorate the nucleation barrier. This will be the subject of future work.
With these quantitative limitations, the primary results of our model are the predictions of two different power law regimes and the observation that nucleation is dominated by trajectories that avoid the saddle point. Primary nucleation is a difficult subject to study because it is difficult to disentangle from the background of secondary nucleation events [4–8]. Our hope is that simple models like ours will inspire further studies into the mechanism of amyloid nucleation.
Supplementary Material
Acknowledgments
We would like to thank L. Weaver and S. Redner for valuable discussions and M. Muschol and S. Whitelam for comments on the manuscript. This work was supported by NIH Grant R01GM107487.
References
- 1.Hardy J, Selkoe DJ. Science (New York, NY) 2002;297:353. doi: 10.1126/science.1072994. [DOI] [PubMed] [Google Scholar]
- 2.Xue WW-F, Homans SWSSW, Radford SE. Proc Nat Acad Sci. 2008;105:8926. doi: 10.1073/pnas.0711664105. [DOI] [PMC free article] [PubMed] [Google Scholar]
- 3.Knowles TPJ, et al. Proc Nat Acad Sci. 2011;108:14746. doi: 10.1073/pnas.1105555108. [DOI] [PMC free article] [PubMed] [Google Scholar]
- 4.Knowles TPJ, et al. Science (New York, NY) 2009;326:1533. [Google Scholar]
- 5.Cohen SIA, et al. J Chem Phys. 2011;135:065105. [Google Scholar]
- 6.Cohen SIA, Vendruscolo M, Dobson CMM, Knowles TPJ. J Chem Phys. 2011;135:065106. doi: 10.1063/1.3608917. [DOI] [PMC free article] [PubMed] [Google Scholar]
- 7.Cohen SIA, Vendruscolo M, Dobson CMM, Knowles TPJ. J Chem Phys. 2011;135:065107. doi: 10.1063/1.3608918. [DOI] [PMC free article] [PubMed] [Google Scholar]
- 8.Cohen SIA, et al. Proc Nat Acad Sci. 2013;110:9758. doi: 10.1073/pnas.1218402110. [DOI] [PMC free article] [PubMed] [Google Scholar]
- 9.Nelson R, et al. Nature. 2005;435:773. doi: 10.1038/nature03680. [DOI] [PMC free article] [PubMed] [Google Scholar]
- 10.Sawaya MR, et al. Nature. 2007;447:453. doi: 10.1038/nature05695. [DOI] [PubMed] [Google Scholar]
- 11.Zhang J, Muthukumar M. J Chem Phys. 2009;130:035102. doi: 10.1063/1.3050295. [DOI] [PMC free article] [PubMed] [Google Scholar]
- 12.Cabriolu R, Kashchiev D, Auer S. J Chem Phys. 2010;133:225101. doi: 10.1063/1.3512642. [DOI] [PubMed] [Google Scholar]
- 13.Kashchiev D, Auer S. J Chem Phys. 2010;132:215101. doi: 10.1063/1.3447891. [DOI] [PubMed] [Google Scholar]
- 14.Auer S, Dobson C, Vendruscolo M, Maritan A. Phys Rev Lett. 2008;101:17. doi: 10.1103/PhysRevLett.101.258101. [DOI] [PubMed] [Google Scholar]
- 15.Schmit JD, Ghosh K, Dill KA. Biophys J. 2011;100:450. doi: 10.1016/j.bpj.2010.11.041. [DOI] [PMC free article] [PubMed] [Google Scholar]
- 16.Hill SE, Miti T, Richmond T, Muschol M. PloS One. 2011;6:e18171. doi: 10.1371/journal.pone.0018171. [DOI] [PMC free article] [PubMed] [Google Scholar]
- 17.Miti T, Mulaj M, Schmit JD, Muschol M. Biomacromol. 2015;16:326. doi: 10.1021/bm501521r. [DOI] [PMC free article] [PubMed] [Google Scholar]
- 18.Qiang W, Kelley K, Tycko R. J Am Chem Soc. 2013;135:6860. doi: 10.1021/ja311963f. [DOI] [PMC free article] [PubMed] [Google Scholar]
- 19.Lee CF, Loken J, Jean L, Vaux DJ. Phys Rev E. 2009;80:041906. doi: 10.1103/PhysRevE.80.041906. [DOI] [PubMed] [Google Scholar]
- 20.Schmit JD. J Chem Phys. 2013;138:185102. doi: 10.1063/1.4803658. [DOI] [PubMed] [Google Scholar]
- 21.Zamparo M, Trovato A, Maritan A. Phys Rev Lett. 2010;105:1. doi: 10.1103/PhysRevLett.105.108102. 1010.4459. [DOI] [PubMed] [Google Scholar]
- 22.Whitelam S, Jack RL. Ann Rev Phys Chem. 2015;66:143. doi: 10.1146/annurev-physchem-040214-121215. 1407.2505. [DOI] [PubMed] [Google Scholar]
- 23.Zeldovich Y. Acta Physicochim. URSS. 1943;18:1. [Google Scholar]
- 24.Redner S. A Guide to First-Passage Processes. Cambridge University Press; 2007. [Google Scholar]
- 25.Muñoz V, Thompson PA, Hofrichter J, Eaton WA. Nature. 1997;390:196. doi: 10.1038/36626. [DOI] [PubMed] [Google Scholar]
- 26.Baldwin AJ, et al. J Am Chem Soc. 2011;133:14160. doi: 10.1021/ja2017703. [DOI] [PubMed] [Google Scholar]
- 27.Ghosh K, Dill KA. J Am Chem Soc. 2009;131:2306. doi: 10.1021/ja808136x. [DOI] [PMC free article] [PubMed] [Google Scholar]
- 28.Lührs T, et al. Proc Nat Acad Sci. 2005;102:17342. doi: 10.1073/pnas.0506723102. [DOI] [PMC free article] [PubMed] [Google Scholar]
- 29.Petkova AT, et al. Proc Nat Acad Sci. 2002;99:16742. doi: 10.1073/pnas.262663499. [DOI] [PMC free article] [PubMed] [Google Scholar]
- 30.Luca S, Yau WM, Leapman R, Tycko R. Biochemistry. 2007;46:13505. doi: 10.1021/bi701427q. [DOI] [PMC free article] [PubMed] [Google Scholar]
- 31.Sgourakis NG, Yan Y, McCallum SA, Wang C, Garcia AE. J Mol Biol. 2007;368:1448. doi: 10.1016/j.jmb.2007.02.093. [DOI] [PMC free article] [PubMed] [Google Scholar]
- 32.Jarrett JT, Lansbury PT. Cell. 1993;73:1055. doi: 10.1016/0092-8674(93)90635-4. [DOI] [PubMed] [Google Scholar]
- 33.Ruschak AM, Miranker AD. Proc Nat Acad Sci. 2007;104:12341. doi: 10.1073/pnas.0703306104. [DOI] [PMC free article] [PubMed] [Google Scholar]
- 34.Meisl G, et al. Proc Nat Acad Sci. 2014;111:9384. doi: 10.1073/pnas.1401564111. [DOI] [PMC free article] [PubMed] [Google Scholar]
- 35.Ferrone FA. Journal of Molecular Biology. 2015;427:287. doi: 10.1016/j.jmb.2014.10.028. [DOI] [PubMed] [Google Scholar]
- 36.Sear RP. J Phys Cond Matt. 2007;19:033101. [Google Scholar]
- 37.Filion L, Hermes M, Ni R, Dijkstra M. J Chem Phys. 2010;133 doi: 10.1063/1.3506838. 1006.2925. [DOI] [PubMed] [Google Scholar]
- 38.Filion L, Ni R, Frenkel D, Dijkstra M. J Chem Phys. 2011;134:134901. doi: 10.1063/1.3572059. [DOI] [PubMed] [Google Scholar]
- 39.Lechner W, Dellago C, Bolhuis PG. J Chem Phys. 2011;135:154110. doi: 10.1063/1.3651367. [DOI] [PubMed] [Google Scholar]
- 40.In the trimer model we are taking the critical state to be the one with the highest free energy and not the one with the highest grand free energy (red line in Fig. 2b). The latter choice would require with kdiff replaced by the rate of forming the first favorable H-bond. Our choice of the dimer as the critical state al-lows a more facile comparison to CNT and our 3D nucleation model where the attempt rate is diffusion-limited. This somewhat arbitrary choice will affect the quantitative rates, but will not change the primary result of the trimer model, which is the qualitative observation that the saddle point trajectory is uniquely disfavored.
Associated Data
This section collects any data citations, data availability statements, or supplementary materials included in this article.