

Abstract
We examined the relationship between subepidermal moisture measured using surface electrical capacitance and visual skin assessment of pressure ulcers at the trunk location (sacral, ischial tuberosities) in 417 nursing home residents residing in 19 facilities. Participants were on average older (mean age of 77 years), 58% were female, over half were ethnic minorities (29% African American, 12% Asian American, and 21% Hispanic), and at risk for pressure ulcers (mean score for Braden Scale for Predicting Pressure Ulcer Risk of 15.6). Concurrent visual assessments and subepidermal moisture were obtained at the sacrum and right and left ischium weekly for 16 weeks. Visual assessment was categorized as normal, erythema, stage 1 pressure ulcer, Deep Tissue Injury or stage 2+ pressure ulcer using the National Pressure Ulcer Advisory Panel 2009 classification system. Incidence of any skin damage was 52%. Subepidermal moisture was measured with a dermal phase meter where higher readings indicate greater moisture (range: 0–70 tissue dielectric constant), with values increasing significantly with the presence of skin damage. Elevated subepidermal moisture values co-occurred with concurrent skin damage in generalized multinomial logistic models (to control for repeated observations) at the sacrum, adjusting for age and risk. Higher subepidermal moisture values were associated with visual damage one week later using similar models. Threshold values for subepidermal moisture were compared to visual ratings to predict skin damage one week later. Subepidermal moisture of 39 tissue dielectric constant units predicted 41% of future skin damage while visual ratings predicted 27%. Thus, this method of detecting early skin damage holds promise for clinicians, especially as it is objective and equally valid for all groups of patients.
Keywords: subepidermal moisture, erythema, stage 1 pressure ulcers, nursing home residents
Annual estimated incidence of pressure ulcers (PUs) in nursing homes (NHs) ranges from 2%1 to 14% 1–4, with approximately 10% of persons having a PU at NH admission5. Stage 1 PUs account for up to 47% of all PUs in the elderly, many of which progress to open ulcers6–9. For those hospitalized or in NHs, one-fourth of stage 1 PUs deteriorate to open ulcers in as little as 7 days7. As early as 1997, blanchable erythema alone was suggested by Schnelle and colleagues as a strong predictor of ulcers among NH residents10. It is considered an antecedent to visible pressure injury by the National Pressure Ulcer Advisory Panel (NPUAP)11 and thus can be viewed as visible pre-stage I pressure damage. Additionally, failure of a PU to heal or improve has been associated with a higher death rate in NH residents.12–14 PUs are costly in terms of dollars, suffering, and poor quality of life but often preventable if repeated instances of mechanical force can be lessened 15–19. Thus, detection of early pressure induced tissue damage is important because early intervention may allow viable tissue rescue, lessening morbidity and mortality.
National Pressure Ulcer Advisory Panel (NPUAP) pressure injury classification relies on the level of visible tissue damage and skin discoloration. Stage 1 pressure-induced tissue damage is identified by non-blanchable erythema (i.e., redness) on intact skin. Stage 2 damage exhibits partial thickness skin loss with exposure of dermal tissues, unstageable and stage 3 and 4 ulcers involve visible full thickness damage of the dermis with deeper tissues visible, and deep tissue injury (DTI) presents on the skin surface as a blood filled blister or maroon/purple skin discoloration20. Thus, physical assessment for both Stage 1 and DTI classification relies almost exclusively on observation of skin discoloration. As a consequence, accurate assessment of skin discoloration is necessary.
Visual assessment of skin for discoloration is somewhat reliable for individuals with light skin tones21–25. However, by the time non-blanchable erythema is evident, skin and tissue damage has already occurred at the muscle bony interface26,27. In fact, blanchable erythema alone has been suggested as a strong predictor of open PUs among NH residents10. Among persons with dark skin tones, visual assessment is not at all reliable and fails to detect skin color changes28–30. Therefore, there is a clear need for non-visual methods of alerting clinicians before visual skin damage is evident.
One such approach is surface electrical capacitance, which assesses subepidermal moisture (SEM) or the water in the epidermal and dermal tissues. In our prior studies, we demonstrated that a hand-held device for SEM measurement identified early skin damage (erythema or stage 1 PUs) at the sacrum and buttocks locations in NH residents, persons with dark skin tones, and persons with spinal cord injury31–35. Further among NH residents, SEM was higher (e.g., increased edema and inflammation) when skin damage was not visible at assessment but was detected as erythema or stage 1 PU one week later31–33. SEM values predicted 26% of the occurrences of such damage to the skin the following week31.
This study builds on the prior work by purposively recruiting large enough numbers of NH residents across the spectrum of skin tones to allow comparisons of effectiveness. The specific aims for the study were:
To describe the relationship of SEM to pressure induced tissue damage over sequential weeks in NH residents, including a focus on those with dark skin tones.
To assess the relative strength of SEM and visual skin assessment as indicators of PUs among persons with lighter skin tones.
To identify threshold SEM values that can be used in clinical settings to identify NH residents in need of prevention activities.
METHODS
Subjects and Setting
The University of California, Los Angeles, Human Subject Protection Committee approved the protocol. Nursing home administration also reviewed and approved the study as determined by facility guidelines. Research staff obtained written informed consent to participate in the current study from residents who were able to provide informed consent or from their designated representatives (for residents unable to provide consent) with assent obtained from the resident. Figure 1 shows the flow of participants for this study.
Figure 1.

Flow of Participants through Study
Residents were recruited from 19 NHs in the greater Los Angeles area. The mean number of beds per facility was 102 (range 50–150). Using the overall quality of care rating from California’s (http://www.calqualitycare.org/providers/nursing-homes/nursing-homes) and the Centers for Medicare and Medicaid Services (https://www.medicare.gov/NursingHomeCompare) NH Compare websites, 17% of the study NHs (n=3) were rated poor, 22% (n=4) below average, 33% (n=7) average, 6% (n=1) above average, and 22% (n=4) superior.
Medical Record Data
At baseline, research staff extracted medical and demographic information from all consented participants’ medical records and their most recent Resident Assessment Instrument Minimum Data Set (MDS), which is required for most residents in U.S. NHs. The MDS is a multi-domain assessment tool that is completed on admission and at quarterly intervals for residents in Medicare and Medicaid accredited NHs. During the study, the MDS was updated from 2.0 to version 3.0. However, this did not affect the majority of extracted items of interest.
Braden Scale Risk Assessment Scores
Research staff assessed participants’ risk for PU development initially and each subsequent month using the Braden Scale for Predicting Pressure Sore Risk (Braden Scale). The Braden Scale is composed of six subscales-sensory perception, moisture, activity, mobility, nutrition, and friction and shear-which are summed for a total score ranging from 6 to 23, with lower scores indicating higher risk for PU development36. Spearman correlation coefficient was used to evaluate reliability of the Braden Scale because of the ordinal nature of the measurement and the small range of observed values (60% fell within a range of 13–18). Of 464 randomly assigned reliability assessments over the 16 weeks, the total score correlation was 0.81 for initial baseline visits and 0.77 for monthly visits.
Skin Tone Assessment
Research staff assessed skin tone using the Munsell System of Color Notation (Munsell chart), which provides a more objective assessment of skin tone. Details of the protocol are presented elsewhere37 Measurements were obtained prior to visual skin assessments after ensuring no presence of feces or urine (for buttocks assessment), ointments or skin creams and in locations without scar tissue. Munsell values of the buttocks at baseline was used to define skin tone categories: light skin tones (values 7–8); medium skin tones (values 5–6) and dark skin tones (values 2.5–4).
Visual Skin Assessment
Through direct independent visual assessments each week, trained research staff assessed skin health of seven anatomic locations: sacral, right and left buttocks, ischial tuberosities, and heels. This paper reports data on the three trunk locations only. Participants were positioned in bed on their right side (unless unable to turn to the right), undergarments removed, and incontinence care provided as needed. Anatomic locations were observed five minutes after turning/repositioning in the following order: sacral, right and left buttocks, ischial tuberosities and heels. Areas of visual skin discoloration were palpated for blanchability and PUs were assessed using the Bates-Jensen Wound Assessment Tool (BWAT)37,38. Following visual skin assessment, a second assessor blinded to the visual skin assessment obtained SEM measures of each location in the same order as the visual assessment.
Visual skin assessment training emphasized stage 1 PUs and DTI because these conditions may be difficult to detect21–24. Erythema was graded as minimal, moderate, or severe discoloration, where minimal was defined as pink or slight redness to the skin, moderate as bright redness in lightly pigmented skin and purple in darkly pigmented skin, and severe as dark red to purple in lightly pigmented skin and black to blue-grey colors in darkly pigmented skin. In persons with light skin tones, blanching was defined as blanchable versus non-blanchable based on finger palpation. Erythema was defined as moderate skin discoloration (bright redness in light skin tones and purple in dark skin tones), with blanching (blanching not considered for dark skin tones). DTI was defined as severe skin discoloration (purple or maroon in light skin tones and black to blue-grey in dark skin tones) with or without blanching. Stage 1 PUs were defined as moderate skin discoloration (all skin tones), with non-blanching (non dark skin tones). PUs more severe than Stage 1 were classified using the NPUAP’s 2009 system (which is similar to the 2016 classifications)40. For skin that demonstrated none of the above visual characteristics, the assessment was considered normal skin. The presence or absence of urine or fecal incontinence, and ointments or creams, was also recorded.
Two observers obtained duplicate visual skin assessments independently recording findings with assessments five to 10 minutes apart at randomly selected observation visits. Paired observers were blinded to each others’ ratings. Agreement of the visual skin assessment was calculated on 2,124 pairs of observations with 96% agreement overall (Kappa=0.72). Reliability coefficients were examined also for specific anatomic locations across all skin conditions, with Spearman rho correlations ranging from 0.69—0.84 (n=2,124 observations). For erythema presence, Kappas ranged from 0.62 (right ischial) to 0.75 (sacral); for erythema type (blanchable versus nonblanchable), Kappas ranged from 0.61 (right ischial) to 0.76 (sacral); and for erythema severity, Kappas ranged from 0.65 (right and left ischials) to 0.72 (sacral). For PU stage, Kappas ranged from 0.86 (left ischial) to 0.96 (right buttock) for stage 2; from 0.75 (left ischial) to 0.93 (sacral) for stage 3; and from 0.67 (right buttock) to 0.97 (sacral) for stage 4.
Subepidermal Moisture Measures
Concurrent with visual assessments, SEM was measured weekly at each of the anatomic locations on clean dry skin using the Delfin MoistureMeter D (Delfin Technologies, LTD, Greenwich, CT) dermal phase meter (Figure 2). The device detects and measures water below the stratum corneum (the uppermost layer of skin and the most influenced by outside surface moisture). While the stratum corneum of the epidermis is influenced by environmental moisture, the lower epidermal and dermal layers contain water generated from within the tissues and are not as affected by environmental moisture. Thus, the depth of measurement allows for evaluation of sub-epidermal moisture without significant interference by surface moisture such as occurs with incontinence. Using dielectric parameters, high-frequency low power electromagnetic waves of 300 MHz are transmitted via a coaxial, line which terminates in an open-ended coaxial wand that is manually placed on the skin. In the skin, the induced electrical field interacts mainly with water molecules closest to the wand with depth of interaction depending on the diameter of the circular electrode on the wand (in this study at a depth of 2.5mm)41,42. The portion of the electromagnetic energy that is not absorbed by tissue water is reflected and measured by the same wand as used for wave transmission. From the properties of the reflected wave the dielectric properties of the site are determined and displayed in the measuring unit. Among dielectric properties, a dielectric constant is calculated and is directly proportional to the free and bound water (total water) in the skin and tissues41. SEM values are displayed in relative dielectric constant units. The tissue dielectric constant (TDC) is directly proportional to the amount of water in the tissue and increases with increasing water content and edema. At around 300 MHz, the electrical properties of free and bound water are nearly identical and thus, the measure is reflective of total water content in the tissue42. Pure water has a dielectric constant of 78.5, the dielectric constant of air is 1, and normal skin is approximately 4041–43. The MoistureMeter D demonstrates a coefficient of variation of only 2.8% (readings every 5 seconds for 600 seconds)44.
Figure 2.
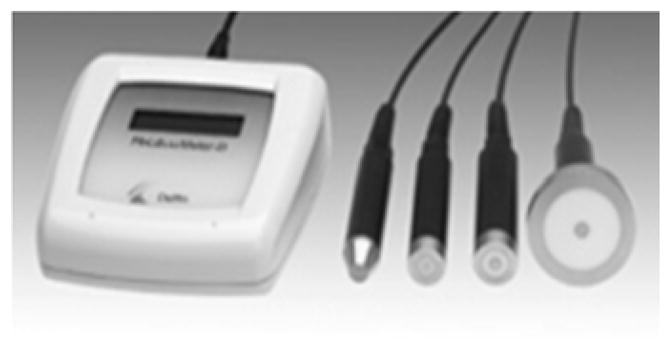
MoistureMeter D device for assessing subepidermal moisture
Goretsky et al used SEM measures to compare healing of split-thickness autografts to cultured skin substitutes in 5 patients with paired site comparisons. They showed that SEM values decreased as sites healed and epidermis matured45. SEM values approached levels seen for uninjured skin by 12 days45. Mayrovitz and colleagues have demonstrated that tissue dielectric constant measured at 300 MHz as with the MoistureMeter D is useful to evaluate local tissue water and its change among healthy men and women of all ages46, women with breast cancer awaiting surgery47 and with post breast cancer lymphedema48, persons with and without diabetes mellitus49 and it is only marginally responsive to changes in skin blood volume50.
The handheld wand was used to take readings at each location, which were identified using an anatomical map with 4cm diameter circular cut outs for each bony prominence. Readings were taken by placing the wand in the circular cut out on the skin surface for 5 seconds to measure the TDC value of the skin (range 0–70; higher values indicate more edema present). Values were automatically stored on the hand-held computer connected to the wand and transcribed at the conclusion of the observation visit.
Observations were blinded, with different observers conducting SEM measures and visual assessments. SEM was measured after a participant’s adult pad and clothing were removed, the visual assessments were completed, and any incontinence care was provided (e.g., skin cleansed and patted dry). SEM was evaluated for reliability using Pearson product correlation coefficient. The overall mean SEM reliability for all skin conditions and all locations was r=0.92. However, reliability by specific skin condition ranged from r=0.52—0.73 for normal skin (n=1,296–1,691 paired readings), from r =0.45—0.71 for erythema (n=50–324 paired readings), and from r=0.60—0.93 for stage 1 PU (n=10–36 paired readings).
Statistical Analysis
To assess the relationship between visual assessment and SEM, techniques were used that allowed for clustered repeated measures, as an observation was defined by week and anatomic location. Data was analyzed using observation as the unit of analyses with generalized multinomial logistic modeling51–55. Stata version 13 allows for this (a subset of generalized estimating equations), including effects for participant and measurement period (included in all models) to account for the correlated nature of the data52.
While the analysis technique is complex, the conceptual approach is straightforward. The primary aim of the study involved longitudinal analysis of skin damage, so participants with less than three weeks of observations are excluded from the analysis dataset. Of the 490 enrolled in the study, 417 participants had at least three weeks of data. Most participants had 14 or more weeks of data (N=297); 38 participants had 11–13 weeks of data and 82 had 3–10 weeks of data. Of the participants with 13 or more weeks (N=320), 137 (43%) had normal skin on all trunk locations for the study duration.
PU incidence was calculated as the number of participants who developed erythema or PUs divided by the total number of participants assessed and followed at least three sequential weeks (n=417). Incidence was calculated within anatomic locations, by skin outcome (erythema/stage 1, stage 2–4 PU, and DTI), by ethnicity/racial groups, and by Munsell skin color groups.
Initial bivariate relationships of visual skin assessment outcome (normal, erythema, stage 1 PU) were examined with all covariates of interest: Braden Score, local skin characteristics (presence of edema, scarring, sweat, urinary and fecal incontinence), functional status, age, medical comorbidities (presence of diabetes mellitus, coronary artery disease, hypertension, heart failure, peripheral vascular disease, cancer) and body mass index. Braden Score and age were modeled as continuous variables. Functional status was examined by creating a dichotomous variable combining MDS transfer, mobility, and urinary incontinence scores where “functional” was defined as at least one of these MDS items with a score less than 3. Relationships were examined for each trunk site separately.
The relationship of visual skin assessment and SEM at the same time (concurrent) was conducted with only erythema and stage 1 skin outcomes, adjusted for covariates identified in the bivariate analyses. (Once an open ulcer exists there is no need for detection regardless of skin discoloration). To determine if SEM from the prior week was associated with visual skin damage the next week the outcome was a three level variable with normal skin/erythema, stage 1 PU, and stage 2 and greater PU. In all analyses, model assumptions were tested and models modified for any violations. Goodness of fit using McFadden R2 and Negelkerke R2 was assessed and Bayesian Information Criterion (BIC) was used to compare models and to determine the best model fit38,39. Findings for the adjusted models were similar or stronger than for the unadjusted models, so results from only the adjusted models are presented here to ease presentation.
Finally, we examined potential threshold values for defining damage and indicating need for intervention. Beginning threshold values were based on our prior study and refined using the probabilities generated with the models of subsequent damage.
RESULTS
Longitudinal skin health and SEM measures were obtained from 417 participants and are reported in this paper (Figure 1). Participants were older (mean age of 76.5 standard deviation (SD) 14.8 years) and 58% were female (Table 1). The majority of participants were ethnic minorities: 29% African American, 12% Asian American, and 21% Hispanic. About two-thirds of the participants had light skin tone (61%). Participants were at risk for PUs, with a mean Braden Scale score of 15.6 (SD 3.2), and were functionally dependent, with 25% of participants totally dependent for bed mobility and 43% requiring extensive assistance with bed mobility. Participant mean length of stay was 1.6 years (25% of participants were newly admitted during study).
Table 1.
Demographic and functional characteristics for participants with three or more observation weeks
| Characteristics (N=417) | Mean (±SD) or Number (%) |
|---|---|
| Age | 76.5 (14.8) |
| Female | 243 (58 %) |
| Ethnicity/Race | |
| African American | 122 (29%) |
| Asian American | 50 (12%) |
| Caucasian | 156 (37%) |
| Hispanic | 89 (21%) |
| Skin Tone (based on Munsell value) | |
| Dark | 68 (16%) |
| Medium | 93 (22%) |
| Light | 256 (61%) |
| MDS Bed Mobility score* (n=413) | 2.7 (1.2) |
| MDS Transfer score* (n=414) | 3.1 (1.0) |
| MDS Urinary Incontinence** (n=407) | 2.4 (1.5) |
| MDS Bowel Incontinence** (n=406) | 2.5 (1.5) |
| Braden Scale for Predicting Pressure Sores+ total score (n=405) | 15.6 (3.2) |
MDS=Minimum Data Set Bed Mobility, Transfer score where 1= independent, 4= dependent;
MDS Urinary Incontinence, Bowel Incontinence scores where 1=continent, 4=incontinent all the time
Braden Scale for Predicting Pressure Sores range 6–23; where 6=high risk; 23=no risk
During the study period, 41% of participants (n=173) had no skin damage at any trunk site. Only one DTI was identified on the sacrum or other trunk areas among the 417 participants over the 16 weeks. Thus, we were not able to evaluate the relationship between DTI and SEM at the trunk locations. Incidence of erythema and all PU stages over the 16 weeks was 52%. Incidence of PU (all stages) was 46%, with 21% incidence of stage 2 or greater PUs and 33% of stage 1 PU (some participants developed both types). There were marked differences in incidence by ethnicity, with Asian Americans and Caucasians demonstrating higher rates of erythema and Stage 1 PUs than Hispanics and African Americans (Figure 3). When examined by skin tone, these differential rates are even more striking.
Figure 3.

Incidence of skin damage by ethnicity and skin tone
SEM was the same for all three anatomic sites for those participants with no damage at the site over the 16 weeks of the study (mean 37 TDC, and SD 7.5 (sacral), 6.8 (right ischial), and 7.2 (left ischial)). SEM was lowest for normal skin (37.1 TDC), and significantly higher for erythema (38.4 TDC), stage 1 PUs (39.3 TDC), and stage 2+ PUs (40.1 TDC) at the sacrum (Table 2, F (3,199) = 17.22, p <=0.0001).
Table 2.
Mean (standard deviation) of subepidermal moisture measure for all observations by visual skin assessment and anatomic site
| Visual Skin Assessment | ||||||||
|---|---|---|---|---|---|---|---|---|
|
| ||||||||
| No Damage | Erythema | Stage 1 PU | Stage 2 + PU | |||||
|
| ||||||||
| Anatomic Site | N* | Mean (SD) | N | Mean (SD) | N | Mean (SD) | N | Mean (SD) |
| Sacrum | 4534 | 37.1 (7.7) | 222 | 38.4 (7.5) | 74 | 39.3 (7.6) | 305 | 40.1 (9.5) |
| Right Ischial | 4846 | 36.7 (7.1) | 183 | 34.9 (8.1) | 38 | 37.8 (8.1) | 77 | 40.8 (8.7) |
| Left Ischial | 4902 | 36.7 (7.3) | 159 | 36.5 (7.7) | 37 | 38.9 (7.4) | 40 | 34.5 (7.8) |
N=number of assessment observations (multiple weeks for each participant)
Mean SEM for participants with normal sacral skin on all observations were similar across Munsell skin tone groups: and 37 TDC (SD 7.7) for those with light skin tones, 38 TDC (SD 7.4) for those with medium skin tones, and 37 TDC (SD 7.3) for those with dark skin tones. This was also true for ischial anatomic sites (data not shown).
Bivariate Relationships Between Visual Skin Damage and Covariates of Interest
Bivariate analyses were examined for each anatomic location with visual skin assessment as the outcome (normal skin, erythema, stage 1 PU). Using a lenient a priori significance level (p=0.10), the covariates significantly related to visual skin assessment for trunk locations included age, Braden score and functional status. Functional status and Braden score were highly correlated (r=.79, p<0.001) and functional status was not significant in early models for the sacral site. Thus, only age and Braden score were used as covariates of the sacral site. For the ischial sites, age and functional status were used as covariates as the correlation of outcomes with Braden score was not as strong (r=−0.48, p<0.001).
Relationship Between SEM and Concurrent Visual Skin Damage
Findings demonstrated the potential for SEM as a method of detecting pressure-induced tissue damage (Table 3). Analyses were conducted with concurrent damage as the outcome among those participants with light and medium skin tones as visual assessment is less valid in those with dark skin tones. For the sacral site, age was not significant for erythema or stage 1 PU and Braden scale was significant for erythema only (RRR=0.901, CI 0.839—0.969). Similar results were found for right and left ischial sites with no covariates significant (Table 3).
Table 3.
Summary statistics for models of concurrent and next week skin damage using sub-epidermal moisture measures by anatomic site
| Adjusted* | ||||
|---|---|---|---|---|
|
| ||||
| Relative Risk Ratio (95% CI) | ||||
|
| ||||
| Anatomic site by Time of Visual Skin Assessment | None vs Erythema | None or Erythema vs St 1 PU | None, Erythema, or St 1 PU vs St 2+ PU | |
| Sacral | ||||
| Concurrent | 1.02 (0.99–1.04) | 1.03 (1.00–1.06) | N/A | 22.84 (0.009) |
| Next week | N/A | 1.03 (0.99–1.06) | 1.03 (1.00–1.07) | 56.37 (0.009) |
| Left Ischial | ||||
| Concurrent | 1.00 (0.97–1.02) | 1.04 (1.00–1.08) | N/A | 19.39 (0.003) |
| Next week | N/A | 1.03 (0.98–1.09) | 0.91 (0.84–0.98) | 54.56 (0.0001) |
| Right Ischial | ||||
| Concurrent | 0.97 (0.94–0.99) | 1.03 (0.97–1.08) | N/A | 15.81 (0.014) |
| Next week | N/A | 1.00 (0.95–1.06) | 1.09 (1.05–1.13) | 33.14 (0.0001) |
Models adjusted for Braden score and age in sacral models and age and functional status in ischial models. Only Braden score significant in sacral models; all other covariates not significant.
Note. PU=Pressure Ulcer, CI=Confidence Interval, BIC=Bayesian Information Criterion.
Relationship Between SEM And Future Visual Skin Damage
The predictive value of SEM was examined using SEM one week prior to visualized skin damage among participants with light and medium skin tones. Adjusting for Braden Score and age, SEM was significant for predicting stage 2 or greater PUs (Table 3). None of the predictors were significant for stage 1 PU. The findings for models using right and left ischial sites were very similar (Table 3). SEM significantly predicted stage 2 or greater PUs, while covariates of functional status and age were not significant. None of the variables were significant for stage 1 PU.
SEM Threshold Values
SEM values of 39, 41, 43, and 45 TDC were examined as possible threshold values in multinomial logistic regression models. The threshold value of 43 TDC provided the best balance of sensitivity (37.4) and specificity (77.7) and correctly predicted 74.7% of the outcomes with an Area Under the Curve (AUC) =0.57 (RRR of 2.02, p=0.000; 95% CI 1.437—3.013 for predicting sacral stage 1 or greater PU, Wald Chi square (1) =15.06, p=0.000). Using nonparametric receiver operating curve (ROC) estimation with bootstrap replications (n=1000) to examine an estimation sample showed an AUC = 0.55 (bootstrap standard error [SE] = 0.029). Values of 39 TDC provided more sensitivity (53.85%) but less specificity (59.15%) and slightly lower AUC value (0.56). Using a value of 41 TDC provided sensitivity of 42.49%, specificity of 65.69% and a lower AUC value (0.54). A threshold of 45 TDC provided higher specificity (84.7%) but much lower sensitivity (28.6%) with AUC of 0.56.
To evaluate the potential clinical value of the thresholds, we classified observations as “clinically actionable”, referring to whether facility staff should begin preventive care. For SEM, thresholds of 39 TDC and 43 TDC were evaluated. To compare with clinical practice, visual skin assessment of erythema was defined as clinically actionable (higher levels of damage trigger direct treatment protocols, rather than preventive care). These classifications were each then compared with the visual skin damage observed the next week. Using SEM thresholds, the percent of observations with erythema, stage 1 PU, or stage 2 and greater PU the next week was 41% (SEM=39 TDC) and 27% (SEM=43 TDC). Using visual threshold, only 23% of observations the next week displayed damage. Thus, SEM may provide a better trigger for preventive care.
DISCUSSION
In this multi-ethnic sample of NH residents at risk for PU, we found a relationship between higher SEM, a biophysical measure, and the current gold standard of visual skin assessment for pressure injury damage at truncal locations. The relationship existed when examining concurrent and future visually observed skin damage. These findings validate our prior studies using a different device to measure SEM31–35. As in this study, we previously found that higher SEM was associated with increased risk of future (one week) PU development among NH residents.31, 33 We examined several potential SEM threshold values and showed SEM as a possible alternative to visual assessment.
SEM values increase as the level of skin damage increases, with significantly higher values for erythema, stage 1 PU, and stage 2 and greater PU compared to normal skin. Our earlier work with NH residents and the same technology but a different device showed a similar pattern and showed the relationship existed in both observations with and without incontinence present31,33. This is important because an alternate reason for tissue edema in this population could be incontinence-associated dermatitis (IAD). In this study, only three participants were identified with IAD (all cases confirmed by certified wound care nurse), although the level of urinary incontinence is similar to other NH studies. We found no difference in SEM values on normal skin for those participants identified as urinary incontinent on the MDS compared to participants identified as continent on the MDS nor for those who were urinary incontinent at the time of assessment compared to no incontinence at the assessment time. Previous research with persons with spinal cord injury also found a significant difference in SEM in normal skin compared to erythema and/or stage 1 PU damage35. In our work with spinal cord injury, we found that persons with generalized edema exhibited SEM values that were higher than those obtained in persons without generalized edema but the overall pattern of elevated SEM values prior to observed PU damage remained similar in those with generalized edema35. In this study, no participants had anasarca and 14 participants (3%) exhibited generalized edema, 10 of whom showed normal skin on all trunk locations during the study and four presented with PU damage (one stage 2 PU on sacrum, one stage 2 PU on right ischial, and two stage 1 PU on left ischial). We also looked at heart failure and dialysis as potential causes of tissue edema. Only 4 participants were receiving dialysis thus we were unable to examine this factor. Fifty-six (13%) participants had a medical diagnosis of heart failure noted on their MDS 3.0 assessment or listed as a primary medical diagnosis on the medical record admission form. Of those with a diagnosis of heart failure, 16 (28%) exhibited stage 1 or greater PU damage during the study and the remainder showed normal skin at the trunk locations. SEM values were significantly higher on normal skin for those without heart failure (mean SEM 43.6 TDC, SD 8.9) compared to those with heart failure (mean SEM 43.6 TDC, SD 8.9 vs mean SEM 39.9 TDC, SD 7.8; t= 4.68, p≤.001) possibly due to treatment of the heart failure or another unidentified factor. Thus, in this study, alternative conditions that may cause tissue edema including: IAD, incontinence, generalized edema, dialysis, or heart failure are not likely factors in the results.
Other investigators have found significant differences between normal skin and areas with pressure injury damage56,57. Ching and colleagues examined 15 male patients with stage 1 or 2 sacral pressure ulcers and found lower SEM values near the PU (within 1 cm) compared to values obtained away from the PU (5 cm from PU edge)57. In contrast, our results showed higher values for erythema, stage 1 PU and stage 2 and greater PU compared to normal skin. Ching et al used a four electrode configuration and computed multiple electrical capacitance measures including the real part of impedance (R), imaginary part of impedance (X), extracellular resistance (R(e)) and the ratio of extracellular resistance to intracellular resistance (R(e)/R(i)) and found all to be significantly smaller near the pressure injury compared to away from the pressure injury. The difference in instrumentation may account for the different findings in this study. Further, all subjects in the Ching et al study had existing pressure damage and there may temporal effects related to surface electrical capacitance measures and tissue damage. Harrow and Mayrovitz56 examined SEM in relationship to existing sacral stage 3 and 4 PUs among persons with spinal cord injury and found SEM was significantly higher at PU sites compared to normal skin control sites. Our SEM results for normal skin at the sacral site (37 TDC) are lower than the SEM values they found at the control sites (47 TDC). This may be due to anatomic variation as the control sites in the Harrow and Mayrovitz study were well above the sacrum; SEM values in this study were obtained directly over the sacral bone. Similar to the results of this study, Harrow and Mayrovitz found higher SEM values for PU sites compared to control normal skin sites (mean 51.1 TDC, SD 8.2 versus 46.9 TDC, SD 7.7; p<0.05) although the SEM values they found were greater than those found in the present study. In contrast to the present study findings, Harrow and Mayrovitz found SEM differences by anatomic site, with sacral SEM values significantly higher than ischial SEM values at normal skin control sites (51. 4 TDC versus 41.1 TDC, p<0.005). We did not find a significant difference between sacral and ischial sites (both 37 TDC). The difference in findings may reflect differences in the population under investigation as Harrow and Mayrovitz examined persons with spinal cord injury with existing stage 3, 4 PUs and the present study looked at frail NH residents.
The variety in skin tones, ethnicities, and facilities represented in the present study is notable. This allowed for group comparisons. Mean SEM values were similar for each level of visual skin damage (normal, erythema, stage 1 PU, stage 2 and greater PU) across skin tone groups and ethnicity groups. This suggests that SEM is distributed similarly across diverse populations and is not biased by current best practice, in which visually observing for skin discoloration among persons with dark skin tones as an indicator of tissue damage is not reliable and very difficult.
In contrast to our earlier studies, the observation period for this study was only 16 weeks. While significant power was gained through the repeated skin assessments of multiple anatomic locations, the period may have been too brief to capture enough incident damage to evaluate the predictive power of SEM among some groups. It may be that an observation period of 6 months is a more robust design for such studies. Further, it is surprising that only one DTI was observed in a truncal location in this rich sample of NH residents at risk for PU development and with variable NH lengths of stay. The lack of DTI at the sacral or ischial sites suggests there may be health care setting differences in this type of pressure induced tissue damage at these locations.
Over the three years of skin observations, the technology for detecting SEM significantly improved. The device used for this study was not specifically designed for high-volume use in health settings. The high variance associated with the SEM readings may indicate that the device was not robust enough. Recent studies using devices designed specifically for the type of skin assessments discussed here have demonstrated greater interrater and inter-device reliability and show great promise for use in clinical settings58. In addition, all skin assessments were completed by trained research staff. Before SEM measures can be used more widely in clinical practice, it is important to evaluate the use of technology by facility staff.
Ambient conditions (room temperature or humidity) were not evaluated for device variation in this study. Conceptually, the measurement should not be influenced by such factors. All assessments were done in residents’ rooms; anecdotally this resulted in little variation for room temperature or humidity. In addition, we analyzed SEM data for seasonal patterns and found none (data not shown).
We were interested in whether residents’ chronic conditions influenced measurement, particularly for those who had conditions that may lead to increased inflammation. Again, we found no significant differences by anatomic condition as defined by MDS (diabetes, heart failure). However, as the conversion from MDS 2.0 to 3.0 was done during our study, we do not have MDS 3.0 measures of such conditions on all residents. However, we are interested in localized inflammation, as this indicates the process we are working to measure, so more work is needed to determine if certain conditions contribute to greater localized inflammation.
Analyses did not incorporate information about preventive care measures. It may be that some subclinical pre-stage 1 pressure injury skin damage was quickly and appropriately treated, halting the progression of damage during the seven days between skin assessments, decreasing the power to detect damage the next week. This seems unlikely, as a range of skin damage was detected during the study. Also, the pathophysiology of pressure ulcers indicates a wide range in progression rates that are due to multiple factors, not just preventive care measures25,26.
The findings from this study related to the relationship between SEM and pressure injury damage may be helpful in light of the ongoing debate about the descriptors, inclusion, and reliable assessment of erythema and stage 1 PUs49–61. SEM stands to contribute to these concerns. There is wide variability and conflicting reports of reliability of PU detection and staging21–24, 59–64. The use of a biophysical measure that more accurately detects pressure injury damage would allow evaluation of the natural history of the condition and begin to address concerns about the clinical significance of early pressure injury damage.
For clinicians, a more reliable, objective method of triggering preventive action has great value. In this study, we demonstrated how an SEM threshold value could be defined and may be superior to visual assessment for initiating clinical action. Many preventive measures are simple to implement and the costs of erring towards over-treatment are low, given the high costs of treating fully developed PUs. A method of detecting early skin damage that is objective and equally valid for all groups of patients has the potential to transform skin care among populations of patients at high risk for such complications.
Acknowledgments
Funding
This project was supported by a grant from the National Institute of Nursing Research to BBJ (5R01NR010736). Data collection and analyses was supported in part by the UCLA Claude Pepper Older Americans Independence Center funded by the National Institute on Aging (5P30AG028748).
Footnotes
Financial Disclosure(s):
Barbara M. Bates-Jensen: none
Heather E. McCreath: none
Anabel Patlan: none
Author Contributions:
Barbara M. Bates-Jensen: conceived and designed the study, acquisition of subjects, data collection, research staff training, performed statistical analyses, analyzed and interpreted data, and preparation of manuscript.
Heather E. McCreath: data management, performed statistical analyses, analyzed and interpreted data, and preparation of manuscript.
Anabel Patlan: acquisition of subjects, data collection, performed descriptive statistical analyses, review of manuscript.
Sponsor’s Role: The sponsor had no role in the design, methods, subject recruitment, data collection, analysis or preparation of the paper.
References
- 1.Bergstrom N, Horn SD, Rapp MP, Stern A, Barrett R, Watkiss M. Turning for Ulcer ReductioN: a multisite randomized clinical trial in nursing homes. J Am Geriatr Soc. 2013;61(10):1705–13. doi: 10.1111/jgs.12440. [DOI] [PubMed] [Google Scholar]
- 2.Hartmann CW, Shwartz M, Zhao S, Palmer JA, Berlowitz DR. Longitudinal pressure ulcer rates since adoption of culture change in Veterans Health Administration nursing homes. J Am Geriatr Soc. 2016;64(1):151–155. doi: 10.1111/jgs.13879. [DOI] [PMC free article] [PubMed] [Google Scholar]
- 3.Grabowski D, Angelelli J. The relationship of Medicaid payment rates, bed constraint policies, and risk-adjusted pressure ulcers. Health Serv Res. 2004;39(4 Pt 1):793–812. doi: 10.1111/j.1475-6773.2004.00258.x. [DOI] [PMC free article] [PubMed] [Google Scholar]
- 4.Abel RL, Warren K, Bean G, Gabbard B, Lyder CH, Bing M, McCauley C. Quality improvement in nursing homes in Texas: results from a pressure ulcer prevention project. J Am Med Directors Assoc. 2005;6:181–8. doi: 10.1016/j.jamda.2005.03.011. [DOI] [PubMed] [Google Scholar]
- 5.Baumgarten M, Margolis D, Gruber-Baldini AL, Zimmerman S, German P, Hebel JR, Magaziner J. Pressure ulcers and the transition to long term care. Adv Skin Wound Care. 2003;16(6):299–304. doi: 10.1097/00129334-200311000-00012. [DOI] [PubMed] [Google Scholar]
- 6.VanGilder C, Amlung S, Harrison P, Meyer S. Results of the 2008–2009 International Pressure Ulcer Prevalence Survey and a 3-year, acute care, unit-specific analysis. Ostomy Wound Manage. 2009;55(11):39–45. [PubMed] [Google Scholar]
- 7.Vangilder C, Macfarlane GD, Meyer S. Results of nine international pressure ulcer prevalence surveys: 1989 to 2005. Ostomy Wound Manage. 2008;54(2):40–54. [PubMed] [Google Scholar]
- 8.Halfens RJG, Bours GJJW, van Ast W. Relevance of the diagnosis ‘stage 1 pressure ulcer’: an empirical study of the clinical course of stage 1 ulcers in acute care and long-term hospital populations. J Clin Nurs. 2001;10(6):748–757. doi: 10.1046/j.1365-2702.2001.00544.x. [DOI] [PubMed] [Google Scholar]
- 9.Vanderwee K, Grypdonck M, Defloor T. Non-blanchable erythema as an indicator for the need for pressure ulcer prevention: a randomized-controlled trial. J Clin Nurs. 2007;16(2):325–35. doi: 10.1111/j.1365-2702.2005.01429.x. [DOI] [PubMed] [Google Scholar]
- 10.Schnelle JF, Adamson GM, Cruise PA, al-Samarai N, Sarbaugh FC, Uman G, Ousland JG. Skin disorders and moisture in incontinent nursing home residents: intervention implications. J Am Geriatr Soc. 1997;45:1182–1188. doi: 10.1111/j.1532-5415.1997.tb03767.x. [DOI] [PubMed] [Google Scholar]
- 11.European Pressure Ulcer Advisory Panel and National Pressure Ulcer Advisory Panel. Prevention and treatment of pressure ulcers: Clinical Practice Guideline. Washington DC: National Pressure Ulcer Advisory Panel; 2009. [Google Scholar]
- 12.Brandeis GH, Morris JN, Nash DJ, Lipsitz LA. The epidemiology and natural history of pressure ulcers in elderly nursing home residents. JAMA. 1990;264(22):2905–9. [PubMed] [Google Scholar]
- 13.Berlowitz DR, Brandeis GH, Anderson J, Du W, Brand H. Effect of pressure ulcers on the survival of long-term care residents. J Gerontol A Biol Sci Med Sci. 1997;52(2):M106–10. doi: 10.1093/gerona/52a.2.m106. [DOI] [PubMed] [Google Scholar]
- 14.Redelings MD, Lee NE, Sorvillo F. Pressure ulcers: more lethal than we thought? Adv Skin Wound Care. 2005;18(7):367–72. doi: 10.1097/00129334-200509000-00010. [DOI] [PubMed] [Google Scholar]
- 15.Berlowitz DR, Young GJ, Hickey EC, Saliba D, Mittman BS, Czarnowski E, Simon B, et al. Quality improvement implementation in the nursing home. Health Serv Res. 2003;38(1):65–83. doi: 10.1111/1475-6773.00105. [DOI] [PMC free article] [PubMed] [Google Scholar]
- 16.Sharkey S, Hudak S, Horn SD, Barrett R, Spector W, Limcangco R. Exploratory study of nursing home factors associated with successful implementation of clinical decision support tools for pressure ulcer prevention. Adv Skin Wound Care. 2013;26(2):83–92. doi: 10.1097/01.ASW.0000426718.59326.bb. [DOI] [PubMed] [Google Scholar]
- 17.Niederhauser A, VanDeusen Lukas C, Parker V, Ayello EA, Zulkowski K, Berlowitz D. Comprehensive programs for preventing pressure ulcers: a review of the literature. Adv Skin Wound Care. 2012;25(4):167–88. doi: 10.1097/01.ASW.0000413598.97566.d7. [DOI] [PubMed] [Google Scholar]
- 18.Gorecki C, Nixon J, Madill A, Firth J, Brown JM. What influences the impact of pressure ulcers on health-related quality of life? A qualitative patient-focused exploration of contributory factors. J Tissue Viability. 2012;21(1):3–12. doi: 10.1016/j.jtv.2011.11.001. [DOI] [PubMed] [Google Scholar]
- 19.Spilsbury K, Nelson A, Cullum N, Iglesias C, Nixon J, Mason S. Pressure ulcers and their treatment and effects on quality of life: hospital inpatient perspectives. J Adv Nurs. 2007;57(5):494–504. doi: 10.1111/j.1365-2648.2006.04140.x. [DOI] [PubMed] [Google Scholar]
- 20.Edsberg LE, Black JM, Goldberg M, McNichol L, Moore L, Sieggreen M. Revised National Pressure Ulcer Advisory Panel Pressure Injury Staging system. J Wound Ostomy Continence Nurs. 2016 Nov;43(6):585–597. doi: 10.1097/WON.0000000000000281. Published online 2016 Nov 14. [DOI] [PMC free article] [PubMed] [Google Scholar]
- 21.Defloor T, Schoonhoven L. Inter-rater reliability of the EPUAP pressure ulcer classification system using photographs. J Clinical Nurs. 2004;13:952–959. doi: 10.1111/j.1365-2702.2004.00974.x. [DOI] [PubMed] [Google Scholar]
- 22.Nixon J, Thorpe H, Barrow H, Phillips A, Nelson EA, Mason SA, Cullum N. Reliability of pressure ulcer classification and diagnosis. J Adv Nurs. 2005;50(6):613–623. doi: 10.1111/j.1365-2648.2005.03439.x. [DOI] [PubMed] [Google Scholar]
- 23.Stausberg J, Lehmann N, Kroger K, Maier I, Niebel W. Reliability and validity of pressure ulcer diagnosis and grading: An image-based survey. Int J Nurs Studies. 2007;44(8):1316–23. doi: 10.1016/j.ijnurstu.2006.06.006. [DOI] [PubMed] [Google Scholar]
- 24.Vanderwee K, Grypdonck MHF, De Bacquer D, Defloor T. The reliability of two observation methods of nonblanchable erythema, grade I pressure ulcer. App Nurs Res. 2006;19:156–162. doi: 10.1016/j.apnr.2005.06.005. [DOI] [PubMed] [Google Scholar]
- 25.Bates-Jensen BM, McCreath H, Pongquan V, Apeles NCR. Subepidermal moisture differentiates erythema and stage I pressure ulcers in nursing home residents. Wound Repair Regen. 2008;16:189–197. doi: 10.1111/j.1524-475X.2008.00359.x. [DOI] [PubMed] [Google Scholar]
- 26.Gefen A, Farid KJ, Shaywitz I. A review of deep tissue injury development, detection, and prevention: shear savvy. Ostomy Wound Manage. 2013;59(2):26–35. [PubMed] [Google Scholar]
- 27.Shoham N, Gefen A. Deformations, mechanical strains and stresses across the different hierarchical scales in weight-bearing soft tissues. J Tissue Viability. 2012;21(2):39–46. doi: 10.1016/j.jtv.2012.03.001. [DOI] [PubMed] [Google Scholar]
- 28.Rosen J, Mittal V, Degenholtz H, Castle H, Mulsant BH, Nace D, Rubin FH. Pressure ulcer prevention in black and white nursing home residents: a QI initiative of enhanced ability, incentives, and management feedback. Adv Skin Wound Care. 2006;19(5):262–8. doi: 10.1097/00129334-200606000-00011. [DOI] [PubMed] [Google Scholar]
- 29.Baumgarten M, Margolis D, van Doorn C, Gruber-Baldini AL, Hebel JR, Zimmerman S, Magaziner J. Black/White differences in pressure ulcer incidence in nursing home residents. J Am Geriatr Soc. 2004;52(8):1293–8. doi: 10.1111/j.1532-5415.2004.52358.x. [DOI] [PubMed] [Google Scholar]
- 30.Baumgarten M, Margolis D, Gruber-Baldini AL, Zimmerman S, German P, Hebel JR, Magaziner J. Pressure ulcers and the transition to long-term care. Adv Skin Wound Care. 2003;16(6):299–304. doi: 10.1097/00129334-200311000-00012. [DOI] [PubMed] [Google Scholar]
- 31.Bates-Jensen BM, McCreath HE, Kono A, Apeles NC, Howell L, Alessi C. Subepidermal Moisture predicts erythema and stage I pressure ulcers in nursing home residents: a pilot study. J Am Geriatr Soc. 2007;55:1199–1205. doi: 10.1111/j.1532-5415.2007.01261.x. [DOI] [PMC free article] [PubMed] [Google Scholar]
- 32.Bates-Jensen BM, McCreath H, Pongquan V. Testing threshold values for sub-epidermal moisture: Identifying stage I pressure ulcers in nursing home residents. L’Escarre [French] 2007;36(4):9–15. [Google Scholar]
- 33.Bates-Jensen BM, McCreath H, Pongquan V, Apeles NCR. Subepidermal moisture differentiates erythema and stage I pressure ulcers in nursing home residents. Wound Repair Regen. 2008;16:189–197. doi: 10.1111/j.1524-475X.2008.00359.x. [DOI] [PubMed] [Google Scholar]
- 34.Bates-Jensen BM, McCreath HE, Pongquan V. Subepidermal moisture is associated with early pressure ulcer damage in nursing home residents with dark skin tones: pilot findings. J Wound Ostomy Continence Nurs. 2009 May-Jun;36(3):277–84. doi: 10.1097/WON.0b013e3181a19e53. [DOI] [PMC free article] [PubMed] [Google Scholar]
- 35.Guihan M, Bates-Jensen BM, Chun S, Parachuri R, Chin AS, McCreath H. Assessing the feasibility of subepidermal moisture to predict erythema and stage 1 pressure ulcers in persons with spinal cord injury: A pilot study. J Spinal Cord Medicine. 2012;35(1):46–52. doi: 10.1179/204577211X13209212104141. [DOI] [PMC free article] [PubMed] [Google Scholar]
- 36.Bergstrom N, Braden B. A prospective study of pressure sore risk among institutionalized elderly. J Am Geriatr Soc. 1992;40(8):747–58. doi: 10.1111/j.1532-5415.1992.tb01845.x. [DOI] [PubMed] [Google Scholar]
- 37.McCreath HE, Bates-Jensen BM, Nakagami G, Patlan A, Booth H, Connolly D, Truong C, et al. Use of Munsell color charts to objectively measure skin color in nursing home residents at risk for pressure ulcer development. J Adv Nurs. 2016 Sep;72(9):2077–2085. doi: 10.1111/jan.12974. [DOI] [PMC free article] [PubMed] [Google Scholar]
- 38.Bates-Jensen BM, Vredevoe DL, Brecht ML. Measurement of pressure sore status. Decubitus. 1992;5(6):20–28. [PubMed] [Google Scholar]
- 39.Harris CL, Bates-Jensen B, Parslow N, Raizman R, Singh M, Ketchen R. The Bates-Jensen Wound Assessment Tool (BWAT)© Pictorial Guide validation project. J Wound Ostomy Continence Nurs. 2010;37(3):253–259. doi: 10.1097/WON.0b013e3181d73aab. [DOI] [PubMed] [Google Scholar]
- 40.European Pressure Ulcer Advisory Panel and National Pressure Ulcer Advisory Panel. Prevention and treatment of pressure ulcers: quick reference guide. Washington DC: National Pressure Ulcer Advisory Panel; 2009. [Google Scholar]
- 41.Nuutinen J, Ikaheimo R, Lahtinen T. Validation of a new dielectric device to assess changes of tissue water in skin and subcutaneous fat. Physiol Meas. 2004;25:447–454. doi: 10.1088/0967-3334/25/2/004. [DOI] [PubMed] [Google Scholar]
- 42.Alanen E, Nuutinen J, Nicklen K, et al. Measurement of hydration in the stratum corneum with the MoistureMeter and comparison with the Corneometer. Skin Res Technol. 2004;10:32–37. doi: 10.1111/j.1600-0846.2004.00050.x. [DOI] [PubMed] [Google Scholar]
- 43.Palensek J, Morhenn VB. Changes in the skin’s capacitance after damage to the stratum corneum in humans. J Cutan Med Surg. 1999;3(3):127–131. doi: 10.1177/120347549900300304. [DOI] [PubMed] [Google Scholar]
- 44.Mayrovitz HN. Assessing local tissue edema in postmastectomy lymphedema. Lymphology. 2007 Jun;40(2):87–94. [PubMed] [Google Scholar]
- 45.Goretsky MJ, Supp AP, Greenhalgh DG, et al. Surface electrical capacitance as an index of epidermal barrier properties of composite skin substitutes and skin autografts. Wound Rep Reg. 1995;3:419–25. doi: 10.1046/j.1524-475X.1995.30406.x. [DOI] [PubMed] [Google Scholar]
- 46.Mayrovitz HN. Local tissue assessed by measuring forearm skin dielectric constant: dependence on measurement depth, age and body mass index. Skin Res Technol. 2010;16(1):16–22. doi: 10.1111/j.1600-0846.2009.00398.x. [DOI] [PubMed] [Google Scholar]
- 47.Mayrovitz HN, Davey S, Shapiro E. Local tissue water assessed by tissue dielectric constant: anatomical site and depth dependence in women prior to breast cancer treatment-related surgery. Clin Physiol Funct Imaging. 2008;28(5):337–42. doi: 10.1111/j.1475-097X.2008.00814.x. [DOI] [PubMed] [Google Scholar]
- 48.Mayrovitz HN. Assessing local tissue edema in postmastectomy lymphedema. Lymphology. 2007 Jun;40(2):87–94. [PubMed] [Google Scholar]
- 49.Mayrovitz HN, McClymont A, Pandya N. Skin tissue water assessed via tissue dielectric constant measurements in persons with and without diabetes mellitus. Diabetes Technol Ther. 2013 Jan;15(1):60–5. doi: 10.1089/dia.2012.0197. [DOI] [PubMed] [Google Scholar]
- 50.Mayrovitz HN, Guo X, Salmon M, Uhde M. Forearm skin tissue dielectric constant measured at 300 MHz: effect of changes in skin vascular volume and blood flow. Clin Physiol Funct Imaging. 2013 Jan;33(1):55–61. doi: 10.1111/j.1475-097X.2012.01163.x. [DOI] [PubMed] [Google Scholar]
- 51.Hosmer DW, Lemeshow S, Sturdivant RX. Applied Logistic Regression. 3. Wiley; New York: 2013. (See Section 8.1) [Google Scholar]
- 52.Long JS, Freese J. Regression Models for Categorical Dependent Variables Using STATA. STATA Press; College Station, TX: 2014. [Google Scholar]
- 53.Bender R, Grouven U. Using binary logistic regression models for ordinal data with non-proportional odds. J Clin Epidemiol. 1998;51(10):809–816. doi: 10.1016/s0895-4356(98)00066-3. [DOI] [PubMed] [Google Scholar]
- 54.Peterson B, Harrell FE., Jr Partial proportional odds models for ordinal response variables. Appl Stat. 1990;39:205–217. [Google Scholar]
- 55.StataCorp. Stata Statistical Software: Release 13. College Station, TX: StataCorp LP; 2013. [Google Scholar]
- 56.Harrow JJ, Mayrovitz HN. Subepidermal moisture surrounding pressure ulcers in persons with a spinal cord injury: a pilot study. J Spinal Cord Med. 2014;37(6):719–28. doi: 10.1179/2045772313Y.0000000193. [DOI] [PMC free article] [PubMed] [Google Scholar]
- 57.Ching CT, Chou MY, Jiang SJ, Huang SH, Sun TP, Liu WH, Liu CM. Tissue electrical properties monitoring for the prevention of pressure sore. Prosthet Orthot Int. 2011;35(4):386–94. doi: 10.1177/0309364611424614. [DOI] [PubMed] [Google Scholar]
- 58.Clendenin M, Jaradeh K, Shamirian A, Rhodes SL. Inter-operator and inter-device agreement and reliability of the SEM Scanner. J Tissue Viability. 2015;24:17–23. doi: 10.1016/j.jtv.2015.01.003. [DOI] [PubMed] [Google Scholar]
- 59.Serena T. Commentary: What wound care needs most. [Last accessed 8/29/16];Wound Source. 2016 Aug 15; http://www.woundsource.com/blog/commentary-what-wound-care-needs-most?inf_contact_key=2cbdc58cd0582f8f5f731658395edfd70d73ebdb8326b5060fd17c3c8f56c989.
- 60.Bryant RA. The revised pressure ulcer staging criteria: where are we going and why? Supplement Editorial, J Wound Care. 2016;25(Sup 7):3. doi: 10.12968/jowc.2016.25.Sup7.S3. [DOI] [PubMed] [Google Scholar]
- 61.Sharp CA, McLaws ML. A discourse on pressure ulcer physiology: the implications of repositioning and staging. [Last accessed on 8/29/16];World Wide Wounds. 2005 http://www.worldwidewounds.com/2005/october/Sharp/Discourse-On-Pressure-Ulcer-Physiology.html.
- 62.Alvey B, Hennen N, Heard H. Improving accuracy of pressure ulcer staging and documentation using a computerized clinical decision support system. J Wound Ostomy Continence Nurs. 2012;39(6):607–12. doi: 10.1097/WON.0b013e31826a4b5c. [DOI] [PubMed] [Google Scholar]
- 63.Suen W, Parker VA, Harney L, Nevin S, Jansen J, Alexander L, Berlowitz D. Internal medicine interns’ and residents’ pressure ulcer prevention and assessment attitudes and abilities: results of an exploratory study. Ostomy Wound Manage. 2012 Apr;58(4):28–35. [PubMed] [Google Scholar]
- 64.Bruce TA, Shever LL, Tschannen D, Gombert J. Reliability of pressure ulcer staging: a review of literature and 1 institution’s strategy. Crit Care Nurs Q. 2012 Jan-Mar;35(1):85–101. doi: 10.1097/CNQ.0b013e31823b1f22. [DOI] [PubMed] [Google Scholar]