Abstract
Background
Ablation of drivers maintaining Atrial Fibrillation (AF) has been demonstrated as an effective therapy. Drivers in the form of rapidly-activated atrial regions can be non-invasively localized to either left or right atria (LA, RA) with Body Surface Potential Mapping (BSPM) systems. This study quantifies the accuracy of Dominant Frequency (DF) measurements from reduced-leads BSPM systems and assesses the minimal configuration required for ablation guidance.
Methods
Nine uniformly distributed lead sets of 8 to 66 electrodes were evaluated. BSPM signals were registered simultaneously with intracardiac electrocardiograms (EGMs) in 16 AF patients. DF activity was analyzed on the surface potentials for the 9 leads configurations, and the non-invasive measures were compared with the EGM recordings.
Results
Surface DF measurements presented similar values than panoramic invasive EGM recordings, showing the highest DF regions in corresponding locations. The non-invasive DFs measures had a high correlation with the invasive discrete recordings; they presented a deviation <0.5 Hz for the highest DF and a correlation coefficient >0.8 for leads configurations with 12 or more electrodes.
Conclusions
Reduced-leads BSPM systems enable non-invasive discrimination between LA versus RA dominant frequencies with similar results as higher-resolution 66-leads system. Our findings demonstrate the possible incorporation of simplified BSPM systems into clinical planning procedures for AF ablation.
Keywords: atrial fibrillation, dominant frequency, rotors, lead distribution, electrocardiography, body surface potential mapping
INTRODUCTION
Several studies have demonstrated the maintenance of atrial fibrillation (AF) by discrete atrial drivers whose ablation is associated with a favorable outcome [1–3], making the identification and localization of these drivers the goal for AF mapping [2,4]. Emerging technologies have used Body Surface Potential Mapping (BSPM) systems to non-invasively identify those atrial drivers, either by locating reentrant patterns [3,5,6] or high Dominant Frequencies (DF) sites [7]. Although these preliminary results seem promising, the high burden and cost of deploying the BSPM systems impedes their wide spread utilization.
The aim of this study is to determine the minimal configuration of body surface leads necessary to non-invasively identify the atria presumably driving AF to facilitate the incorporation of the non-invasive BSPM approach into the clinical practice. Previous studies have already investigated how the selection of different leads’ sets affects the ECG waveform [8–10] and have concluded that for AF signals, systems with more than 32 electrodes do not increase the signal reconstruction accuracy [11]. However, the ability of these lead sets to characterize the nature and position of possible AF drivers has not been studied. The present study demonstrates that a BSPM system with an approximate uniform distribution of 12 or more electrodes over the torso surface is capable of maximal DF identification and localization in the left versus the right atrium.
METHODS
Patients
We studied a total of 16 patients admitted for ablation of drug-refractory paroxysmal (N=11) and persistent (N=5) AF and various numbers of ablation procedures (0–2) [6]. All patients gave informed consent and the protocol was approved by the Institutional Ethics Committee.
Electrophysiological study and EGM recordings
The electrophysiological study was performed under general anesthesia and periodic heparin bolus administration. Intracardiac electrograms (EGM) were obtained in 14 patients from both atria during the procedure by using the following catheters introduced via the right femoral vein: (1) a standard tetrapolar catheter in the right atrial (RA) appendage; (2) a deflectable 4-mm mapping catheter (Marinr; Medtronic Inc., Minneapolis, MN) in the distal coronary sinus; (3) a decapolar circular mapping Lasso catheter (Biosense-Webster, Diamond Bar, CA) used to map the PV-left atrial (LA) junctions; and an ablation catheter (Navistar cooled-tip catheter, Biosense Webster, Inc, Diamond Bar, CA). In those 14 patients a sequential mapping of both atria (106.4 ± 65.8 points mapped, 25 minimum and 231 maximum points) was performed to determine the highest DF site. Then, the ablation catheter was positioned at the highest DF site [7]. In two additional patients, body surface recordings were obtained simultaneously with a 64-pole basket catheter (Constellation, Boston Scientific, Natick, MA) located sequentially on the right and left atria. In patients arriving in sinus rhythm, AF was induced by burst pacing and AF episode durations longer than 5 minutes were required for inclusion in the study.
Body surface potential recordings
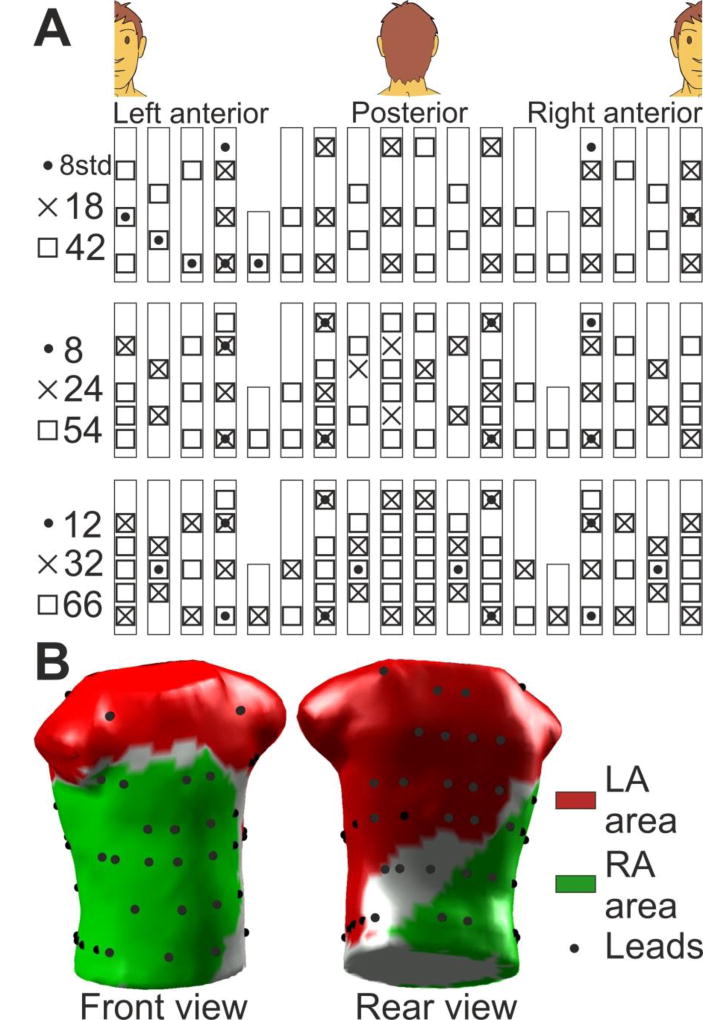
Surface electrocardiograms (ECGs) were simultaneously recorded with the EGM recordings by using a vest grid of 66 electrodes distributed as follows: 30 electrodes on the anterior, 34 on the posterior and 2 on each lateral side of the torso (Figure 1A). An additional left leg electrode was used in order to obtain a Wilson Central Terminal. The signals were recorded using a commercial system (Active Two, Biosemi, The Netherlands) at a sampling frequency of 2048 Hz and were stored for off-line analysis. Ventricular activation was removed by administration of a central venous bolus of adenosine (12–18 mg) and 4-seconds segments of surface ECGs surrounding the longest RR interval were used for the analysis. In cases with ventricular activation pauses shorter than 4 seconds, the QRSTs were cancelled [12].
Figure 1.
Lead and area distribution on the torso. (A) Distribution of the lead sets. (B) 3D torso with the 66 leads (black dots) and the LA and RA dominant influence areas (red and green, respectively).
Lead distribution on torso and 3D model
To analyze the effect of surface lead configuration on AF mapping of DF, different combination sets of the BSPM electrodes were defined. Those sets included uniform distributions of 8, 12, 18, 24, 32, 42 and 54 electrodes as well as a non-uniform distribution of 8 leads matching the standard precordial and upper limbs ECG electrodes distribution (see Figure 1A). The surface electrical activity was then projected on the surface of a typical adult human 3D torso model with 771 nodes and 1538 faces (see Figure 1B), in which the surface potentials were reconstructed using the ECG signals provided by the different lead sets. The electrical potentials in areas between the nodes selected as electrodes for a particular lead configuration were interpolated as previously described [6].
Two areas on the surface of the 3D torso model were assigned as being dominantly influenced by either left or right atrial electrical activity (Figure 1B): an LA area (red) covering the left, upper back and top side; and an RA area (green) covering the right, lower back and front side [6,7]. The number of electrodes in LA area was 2, 3, 4, 5, 7, 8, 10, 14 and 19 electrodes for the 8 standard, 8, 12, 18, 24, 32, 42, 54 and 66 electrodes BSPM distributions respectively, whereas the RA area was covered by 3, 4, 7, 10, 14, 20, 25, 31 and 38 electrodes respectively. The number of electrodes was then 97.7 ± 40.3 % greater in the RA region than in the LA along the different BSPM sets, due to the larger RA region covered by the BSPM vest (38 electrodes) than the LA region (19 electrodes).
Signal processing and DF
Baseline EGM and ECG signals were processed by decimation to 51.2 Hz and filtering with a Butterworth 10th-order low-pass filter with a cut-off frequency of 2 Hz. These signals were interpolated to 2048 Hz and subtracted from the original signals to remove low frequency drift [11]. Resulted potential signals were then low-pass filtered with a 10th-order Butterworth filter with a cut-off frequency of 30 Hz. Power Spectral Density (PSD) of EGMs and ECGs was computed by using Welch periodogram (2-second long Hamming window with an 8192 point Fast Fourier transform per window and 50% overlap) to determine the DFs.
RESULTS
Correspondence of panoramic invasive and full surface DF measurements
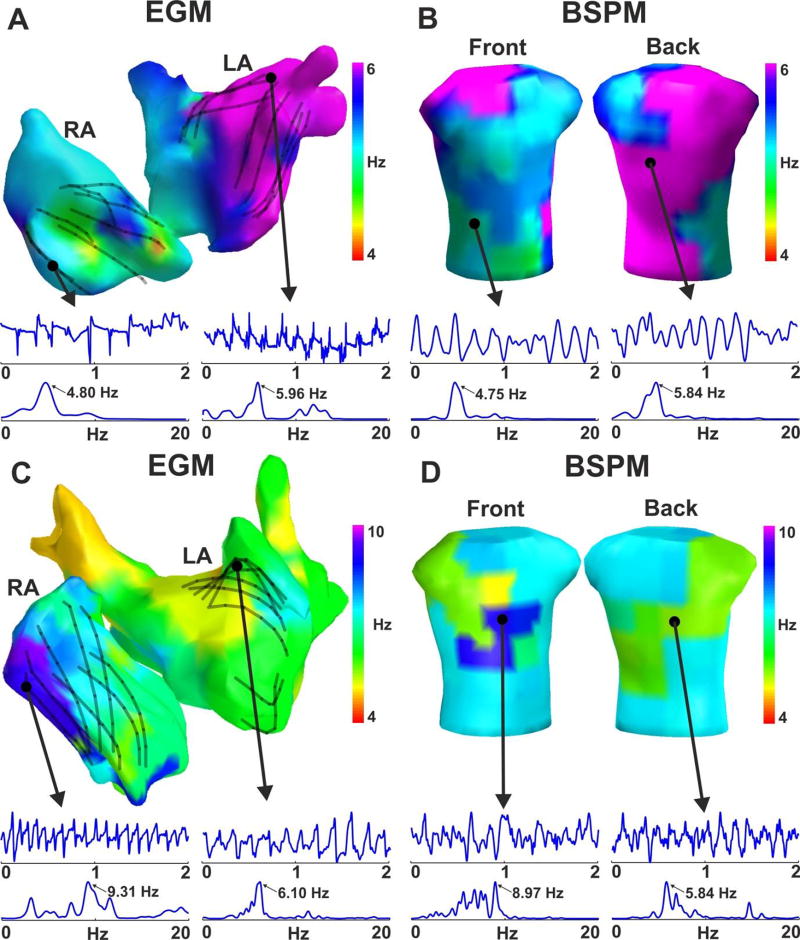
Figure 2 shows an example of the surface DF distribution and its relationship with the panoramic intracardiac DF map of two representative cases of AF with left-to-right gradient (i.e. LA-fastest patient) and right-to-left gradient (i.e. RA-fastest patient). For better anatomical orientation the DF values measured at the 64-poles catheter are displayed on the atrial shell by the DF measurement from the nearest catheter pole. The invasive panoramic DF map of patient #1 (Fig. 2A) shows a Highest DF (HDF) region located in the left pulmonary veins where the HDF was around 6 Hz, while the rest of the atrium maintained DF values lower than 5 Hz with a sample 4.8 Hz measurement site illustrated at the right atrial appendage. The surface DF map obtained with the full leads set (66 electrodes, Fig, 2B) is shown to display two well demarcated domains: a large part of the torso surface presents a DF value of 5.84 Hz corresponding to the highest DF in the LA and roughly spread over the LA influenced region shown in Figure 1B, whereas the rest of the torso depicts lower DF values around 4.75 Hz, similar to the DFs invasively measured in the RA. The panoramic invasive DF map from patient #2 (Fig. 2C) shows a similar frequency distribution with the HDF region located in the right atrial appendage (9.31 Hz) while the rest of the atrium was activated between 5 and 7 Hz (6.10Hz at the posterior LA wall). In this case the surface DF map (Fig. 2D) depicts a region in the right front side of the torso with a DF of 8.97 Hz, whereas the rest of the surface presented lower values, being 5.84 Hz the DF in the back.
Figure 2.
Example of DF distribution in panoramic recordings from 2 patients. Invasive DF distribution from multipolar basket catheters recordings (A,C) and simultaneous non-invasive DFs from BSPM (B,D) and the corresponding voltage signals and their Power Spectral Density (PSD).
Surface dominant frequencies for the full BSPM configuration
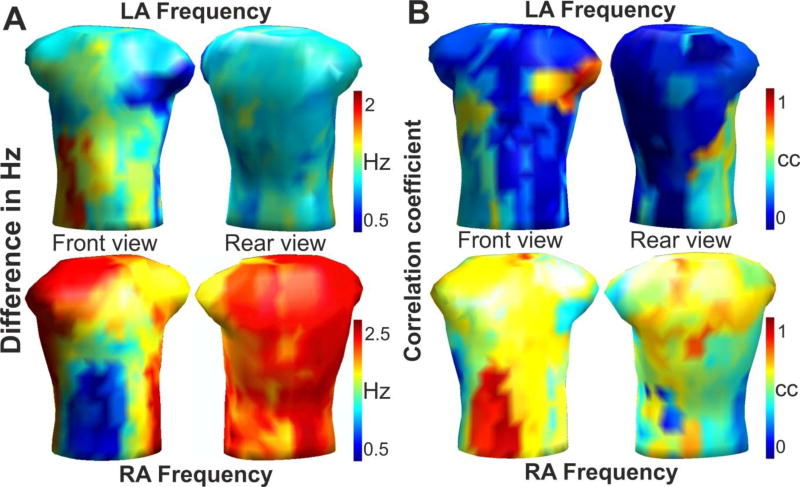
The distribution and match between the intra-atrial and surface DFs was studied for the 14 patients with discrete EGM recordings. The average frequency differences between the intracardiac maximal DF from the LA and RA and the body surface maximal DFs are depicted in Figure 3A. For each atrium, there is a torso area in which the difference between the intracavitary and non-invasive DF is minimal at <0.5 Hz (blue): the left surface side, including the left axillae, for the LA frequency; and the right front surface side of the torso for the RA frequency. The same surface regions can be identified in Figure 3B as having the highest correlation coefficient (red) between the intracavitary DF measurements from the LA and RA and the surface DF values from the BSPM. The correspondence between the maximal DFs in each atrium and the surface DFs establishes the body surface areas that are predominantly influenced by LA and RA activity and were used to define the LA and RA areas on the torso in Figure 1B.
Figure 3.
Relationship between invasive and non-invasive DF measurements. (A) Surface distribution of the average difference (in Hz) between the LA (Top) and RA (Bottom) DFs and the BSPM DF for the 14 patients mapped sequentially. (B) Surface distribution of the correlation between the LA (Top) and RA (Bottom) DFs and the BSPM DF for the same 14 patients. The areas with lowest errors in A (blue) are the areas with the highest cross-correlations in B (red).
Surface distribution of dominant frequencies for reduced-leads BSPM
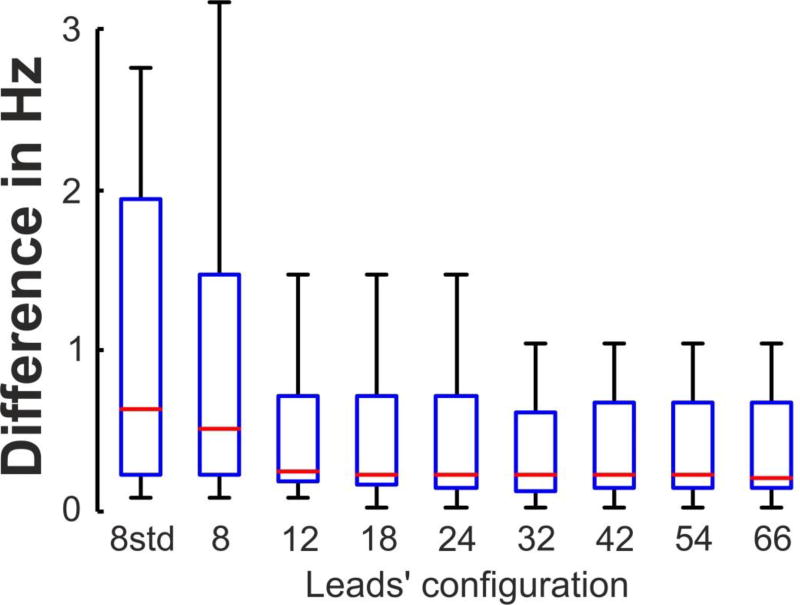
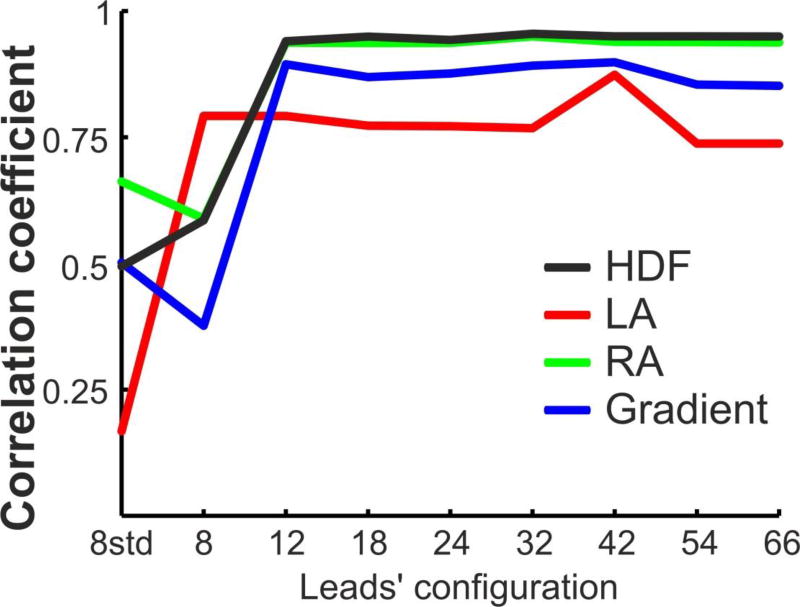
The errors in the DFs identification using the different lead sets of BSPM were quantified by the difference between their DFs and the intracavitary DFs. As shown in Figure 4 the highest DF (HDF) presented its maximal error for the standard 8-leads BSPM configuration (1.3±1.8 Hz), and this error decreased for arrangements with more leads with uniform distributions and stabilized at around 0.35 Hz for 12 or more electrodes. The coincidence between DFs obtained from intracavitary and surface recordings was also evaluated by the calculating the correlation coefficients for the highest, LA, RA and LA-RA (gradient) DFs measures for all the patient dataset (Figure 5). It is shown that the correlation between invasive and non-invasive DF measurements had low values for low number of surface leads. However, for 12 or more uniformly distributed leads the correlation coefficient reached higher and fixed values for all the lead sets: 0.75 for LA DF, 0.85 for the DF gradient, 0.94 for RA DF and 0.95 for the HDF.
Figure 4.
Difference (in Hz) between the Highest DF (HDF) obtained from invasively (EGM) and non-invasively (BSPM) recordings as a function of the leads’ configuration.
Figure 5.
Correlation of the DFs values between the EGM and BSPM signals as a function of the leads’ configuration for the 14 patients.
Patient classification from surface DF measurements for reduced-leads BSPM
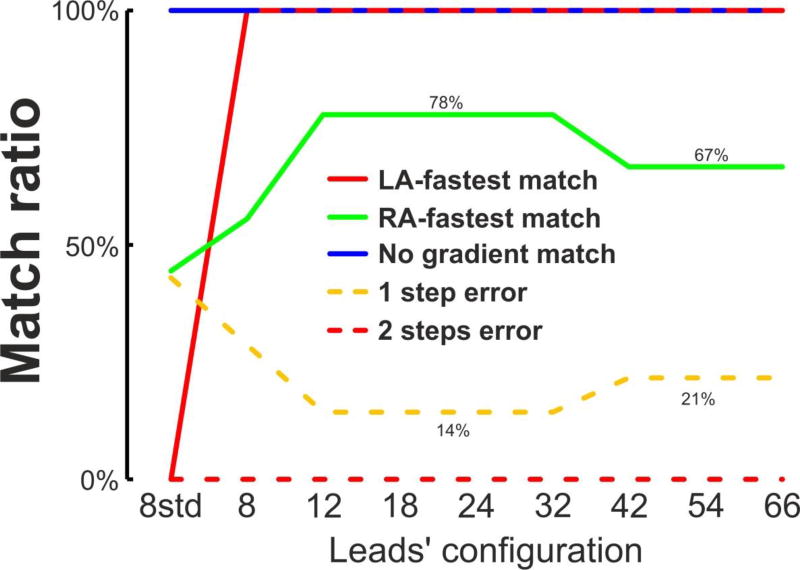
Non-invasive DF measures were used to classify the AF patients in 3 groups, according to its LA-to-RA DF gradient: (group I) LA-fastest patients, when the LA-to-RA DF was > 0.75 Hz (N=1); (group II) with no LA-to-RA DF gradient when −0.75 > LA-to-RA DF > 0.75 (N=4); and (group III) RA-fastest, when the LA-to-RA DF was < −0.75 Hz (N=9). The classification obtained with the EGM measures was used as Gold Standard and was compared with the classification carried out with the non-invasive measures (see Figure 6). The outcomes of the non-invasive classification are related as follows: LA-fastest match, when the EGM and non-invasive classification matched for LA-fastest patients (group I); no gradient match, when the EGM and non-invasive classification matched for no gradient patients (group II); RA fastest match, when the EGM and non-invasive classification matched for RA-fastest patients (group III); 1-step error, when a LA-fastest or RA-fastest patient was wrongly classified as no gradient patient and vice versa (group II to I/III or vice versa); and 2-step error when a LA-fastest patient was wrongly classified as RA-fastest patient or vice versa (group I to III or vice versa). Figure 6 shows as the DFs pattern is useful for the patient identification for lead configurations with 12 or more leads. For these leads configurations, the LA-fastest match ratio and no gradient match ratios were 100%, the RA-fastest match ratio was 78%, the 1 error ratio was 14% and the 2 errors ratio was 0%. However, there is a small decrease in the outcome ratios for 42, 54 and 66 lead where the RA-fastest match ratio decreases from 77% to 66% and the 1 error ratio increases from 14% to 21%.
Figure 6.
Patient classification with non-invasive DFs measurements..
DISCUSSION
Major findings
Body surface DF maps obtained with uniformly distributed 66 leads present a good correlation with the invasively obtained DF measures in both atria. The present study demonstrates that fastest atrial localization based on surface highest DF distribution assessment with 12 or more electrodes uniformly distributed on the body surface presents a high correlation with the higher-resolution BSPM system of 66 leads. Therefore, reduced-leads BSPM systems enable non-invasive discrimination between LA or RA atrial highest frequency sites with similar results as the higher-resolution 66-leads systems.
Mechanisms of AF maintenance and their non-invasive characterization
The mechanisms underlying AF in patients are not always clear. Recent studies utilizing new mapping methods have supported the existence of a hierarchical AF organization of activity whereby identifiable sources of fast activity [1,4] in the form of ectopic or rotor activation patterns maintain the arrhythmia [2,3], but controversies still exist [13–14]. Arguably, better and easier identification of localized AF sources would render better targets for ablation thus efforts to improve technologies for localization of AF drivers are ongoing [5–7]. Although intra-cardiac recordings are considered the most reliable method for AF characterization [2], they are not free of difficulties [15] and the need for panoramic mapping led to the development of noninvasive AF mapping methods. Noninvasive mapping methods not only would allow for relatively simpler deployment than the usage of multiple intra-cardiac electrodes, but will also enable studying patients outside of the clinical EP laboratory and pre-planning individual ablation procedures. Some of the limitations of non-invasive technologies are their reduced sensitivity to the atrial activity during fibrillation. We have recently studied the effect of the body torso on body surface mapping and found that a significant amount of atrial information is retained on the body surface recordings [6–7, 16]. These studies showed that utilizing the appropriate frequency domain processing, non-invasive analysis of the AF activity on the torso surface enables atrial drivers localization at a dominant atrium to facilitate ablation procedures [1,4].
Lead distribution in body surface electrocardiography
The number of body surface leads and their position have been broadly acknowledged to affect arrhythmia diagnostic accuracy, but in clinical practice the standard ECG leads configuration largely prevails. Indeed, the standard ECG lead set does not accurately respond to all diagnostic cardiology needs, and for this reason body surface potential mapping (BSPM) systems with a broad distribution of leads and higher spatial resolution were developed. However, today there is no standard evaluation or recommendation for the surface electrode configuration for the different cardiac diseases and AF in particular.
The number of electrodes necessary for BSPM utilization has been mostly evaluated for ventricular activity based on the quality of signals [8–11, 17]. Only few studies investigated the role of the number and distribution of BSPM leads in studying atrial electrophysiology. Although the morphology and variability of the standard ECG signal in AF has been widely studied, only few authors have considered that the standard ECG system is sensing mostly the ventricles and have proposed the use of a different arrangement of the 9 standard leads in order to increase the effectiveness in AF characterization [18]. The broader electrode settings of BSPM has been used to study atrial arrhythmias [5,19–20], but without an evaluation of accuracy for AF mechanisms characterization. In a recent study, Guillem et al studied the number of leads necessary to properly reconstruct the torso potentials during in AF signals [11]. This study showed that during atrial fibrillatory rhythms a set of 34 electrodes was able to reconstruct the surface potential with the same accuracy than systems with more leads, since the reconstruction error reaches the noise level at the recording electrodes.
In this work, we propose the use of a reduced number of uniformly distributed leads for AF HDF source inter-atrial localization, since the surface DF measurements did not increase their diagnostic information beyond a certain number of leads, in this case 12. Although previous studies have concluded that at least 30 leads are necessary to properly reconstruct the surface electrical potential [8–9,11], the present study makes use of the DF as a main signal characteristic which has been seen common in large surface regions although the individual ECG time-series within each region present considerable variations. Thus, although 30 or more leads are necessary to properly reconstruct the ECG signal shape, the DF value is common to most of these ECG signals and then 12 leads would be enough to distinguish between the left or right atrial dominance. This observation is also consistent with the natural smoothening filtering effect of the torso volume conductor that projects on the torso surface only the strongest characteristics of the atrial waves, with reduced sensitivity for the small electrical waves, no matter how high the number leads is used for mapping [6].
Limitations
The study population includes a small number of 16 patients, however we submit that the use of heterogeneous patients cohort, with paroxysmal and persistent AF as well as varying number of ablation procedures [6–7, 16], enhances the credence of our conclusions on AF inter-atrial characterization although it may not be representative of the general characteristics of a first detected paroxysmal AF, more prevalent in other AF ablation studies.
The number of leads in the LA surface region was significantly reduced compared to the number of leads in the RA surface region, due to the major covering of the full-resolution BSPM distribution of the RA surface region. This low coverage of the LA region could have provoked the underestimation of the surface LA DFs, as can be observed in the lower correlation value between invasive and noninvasive LA measurements (Figure 5) compared to the other correlation values. Further studious should solve this under-coverage by placing more ECG electrodes in the LA surface regions, concretely in the high anterior and posterior torso.
DF measurements recorded in the EGM catheters can vary inside each of the region considered, so there are atrial locations whose correlation with the surface DF may be lower or higher than reported. Nevertheless, the highest DF region was identified by performing a detailed DF map of both atria in all patients, and therefore, concordance of the highest DF with the surface measurements should hold.
This study analyses AF under the effect of the adenosine. Although previous studies have reported that Adenosine infusions accelerate the activation rate during AF by up to 50% in some regions, they also reported that the general DF distribution across the atria remained stable over time [4, 21]. Thus, although Adenosine could have affected the local DF values in our study, their hierarchical distribution across the atria and on the body surface should have been preserved. Based on the error analysis in Figure 3 we expect to be able to detect DF gradients with a reduced body surface electrode configuration in cases of DF gradients larger than about 0.5 Hz.
Conclusions
For coarse AF analysis, BSPM systems with about 12 uniformly distributed leads can achieve the same results as systems with up to 66 leads. Low-resolution BSPM systems retain the relevant clinical information that enables non-invasive discrimination between RA- or LA-fastest patients, a highly relevant information for increased ablation effectiveness. The results of this work can be the basis for the BSPM system simplification and wider clinical adoption for better non-invasive AF pre-ablation screening and planning as well as real-time EP mapping auxiliary guidance.
Acknowledgments
FA served on the advisory board of Medtronic and Sorin. OB received research support from Medtronic and St. Jude Medical. He is a cofounder and Scientific Officer of Rhythm Solutions, Inc., Research and Development Director for S.A.S. Volta Medical and consultant to Acutus Medical.
Funding
This work was supported in part by Generalitat Valenciana Grants [ACIF/2013/021]; Instituto de Salud Carlos III, Ministerio de Ciencia e Innovación [PI13/00903, PI14/00857]; Spanish Society of Cardiology [Clinical research Grants 2015]; Ministerio de Ciencia e Innovación [Red RIC] and the National Heart, Lung, and Blood Institute [P01-HL039707, P01-HL087226 and R01-HL118304].
Abbreviations
- AF
Atrial Fibrillation
- BSPM
Body surface Potential Mapping
- DF
Dominant Frequency
- ECG
Electrocardiogram
- EGM
Electrogram
- HDF
Highest Dominant Frequency
- LA
Left Atrium
- PSD
Power Spectral Density
- RA
Right Atrium
Footnotes
Conflicts of interest
The other authors have no conflict of interest. None of the companies disclosed here financed the research described in this manuscript.
References
- 1.Atienza F, Almendral J, Ormaetxe JM, Moya A, Martínez-Alday JD, Hernández-Madrid A, et al. RADAR-AF Investigators. Comparison of radiofrequency catheter ablation of drivers and circumferential pulmonary vein isolation in atrial fibrillation: a noninferiority randomized multicenter RADAR-AF trial. J Am Coll Cardiol. 2014;64:2455–67. doi: 10.1016/j.jacc.2014.09.053. [DOI] [PubMed] [Google Scholar]
- 2.Narayan SM, Krummen DE, Clopton P, Shivkumar K, Miller JM. Direct or coincidental elimination of stable rotors or focal sources may explain successful atrial fibrillation ablation: on-treatment analysis of the CONFIRM (CONventional ablation for AF with or without Focal Impulse and Rotor Modulation) Trial. J Am Coll Cardiol. 2013;62:137–147. doi: 10.1016/j.jacc.2013.03.021. [DOI] [PMC free article] [PubMed] [Google Scholar]
- 3.Haissaguerre M, Hocini M, Denis A, Shah AJ, Komatsu Y, Yamashita S, et al. Driver domains in persistent atrial fibrillation. Circulation. 2014;130:530–538. doi: 10.1161/CIRCULATIONAHA.113.005421. [DOI] [PubMed] [Google Scholar]
- 4.Atienza F, Almendral J, Jalife J, Zlochiver S, Ploutz-Snyder R, Torrecilla EG, et al. Real-time dominant frequency mapping and ablation of dominant frequency sites in atrial fibrillation with left-to-right frequency gradients predicts long-term maintenance of sinus rhythm. Heart Rhythm. 2009;6:33–40. doi: 10.1016/j.hrthm.2008.10.024. [DOI] [PMC free article] [PubMed] [Google Scholar]
- 5.Lim HS, Zellerhoff S, Derval N, Denis A, Yamashita S, Berte B, et al. Noninvasive mapping to guide atrial fibrillation ablation. Card Electrophysiol Clin. 2015;7:89–98. doi: 10.1016/j.ccep.2014.11.004. [DOI] [PubMed] [Google Scholar]
- 6.Rodrigo M, Guillem MS, Climent AM, Pedrón-Torrecilla J, Liberos A, Millet J, et al. Body surface localization of left and right atrial high-frequency rotors in atrial fibrillation patients: a clinical-computational study. Heart Rhythm. 2014;11:1584–1591. doi: 10.1016/j.hrthm.2014.05.013. [DOI] [PMC free article] [PubMed] [Google Scholar]
- 7.Guillem MS, Climent AM, Millet J, Arenal A, Fernández-Avilés F, Jalife J, et al. Noninvasive localization of maximal frequency sites of atrial fibrillation by body surface potential mapping. Circ Arrhythm Electrophysiol. 2013;6:294–301. doi: 10.1161/CIRCEP.112.000167. [DOI] [PMC free article] [PubMed] [Google Scholar]
- 8.Lux RL, Smith CR, Wyatt RF, Abildskov JA. Limited lead selection for estimation of body surface potential maps in electrocardiography. IEEE Trans Biomed Eng. 1978;25:270–276. doi: 10.1109/TBME.1978.326332. [DOI] [PubMed] [Google Scholar]
- 9.Finlay DD, Nugent CD, Donnelly MP, Black ND. Selection of optimal recording sites for limited lead body surface potential mapping in myocardial infarction and left ventricular hypertrophy. J Electrocardiol. 2008;41:264–271. doi: 10.1016/j.jelectrocard.2008.02.009. [DOI] [PubMed] [Google Scholar]
- 10.Guillem MS, Castells F, Climent AM, Bodí V, Chorro FJ, Millet J. Evaluation of lead selection methods for optimal reconstruction of body surface potentials. J Electrocardiol. 2008;41:26–34. doi: 10.1016/j.jelectrocard.2007.07.001. [DOI] [PubMed] [Google Scholar]
- 11.Guillem MS, Bollmann A, Climent AM, Husser D, Millet-Roig J, Castells F. How many leads are necessary for a reliable reconstruction of surface potentials during atrial fibrillation? IEEE Trans Inf Technol Biomed. 2009;13:330–40. doi: 10.1109/TITB.2008.2011894. [DOI] [PubMed] [Google Scholar]
- 12.Castells F, Mora C, Rieta JJ, Moratal-Pérez D, Millet J. Estimation of atrial fibrillatory wave from single-lead atrial fibrillation electrocardiograms using principal component analysis concepts. Med Biol Eng Comput. 2005;43:557–560. doi: 10.1007/BF02351028. [DOI] [PubMed] [Google Scholar]
- 13.Narayan SM, Jalife J. CrossTalk proposal: Rotors have been demonstrated to drive human atrial fibrillation. J Physiol. 2014;592:3163–3166. doi: 10.1113/jphysiol.2014.271031. [DOI] [PMC free article] [PubMed] [Google Scholar]
- 14.Allessie M, de Groot N. CrossTalk opposing view: Rotors have not been demonstrated to be the drivers of atrial fibrillation. J Physiol. 2014;592:3167–3170. doi: 10.1113/jphysiol.2014.271809. [DOI] [PMC free article] [PubMed] [Google Scholar]
- 15.Berenfeld O, Oral H. The quest for rotors in atrial fibrillation: different nets catch different fishes. Heart Rhythm. 2012;9:1440–1441. doi: 10.1016/j.hrthm.2012.04.029. [DOI] [PMC free article] [PubMed] [Google Scholar]
- 16.Pedrón-Torrecilla J, Rodrigo M, Climent AM, Liberos A, Pérez-David E, Bermejo J, et al. Noninvasive Estimation of Epicardial Dominant High-Frequency Regions during Atrial Fibrillation. J Cardiovasc Electrophysiol. 2016 doi: 10.1111/jce.12931. [DOI] [PMC free article] [PubMed] [Google Scholar]
- 17.Hoekema R, Uijen G, van Oosterom A. The number of independent signals in body surface maps. Methods Inf Med. 1999;38:119–124. [PubMed] [Google Scholar]
- 18.Ihara Z, van Oosterom A, Jacquemet V, Hoekema R. Adaptation of the standard 12-lead electrocardiogram system dedicated to the analysis of atrial fibrillation. J Electrocardiol. 2007;40:68.e1–e8. doi: 10.1016/j.jelectrocard.2006.04.006. [DOI] [PubMed] [Google Scholar]
- 19.Gerstenfeld EP, Sippens Groenewegen A, Lux RL, Lesh MD. Derivation of an optimal lead set for measuring ectopic atrial activation from the pulmonary veins by using body surface mapping. J Electrocardiol. 2000;33:179–185. doi: 10.1054/jelc.2000.20307. [DOI] [PubMed] [Google Scholar]
- 20.Sippensgroenewegen A, Peeters HA, Jessurun ER, Linnenbank AC, Robles de Medina EO, Lesh MD, et al. Body surface mapping during pacing at multiple sites in the human atrium: P-wave morphology of ectopic right atrial activation. Circulation. 1998;97:369–380. doi: 10.1161/01.cir.97.4.369. [DOI] [PubMed] [Google Scholar]
- 21.Atienza F, Almendral J, Moreno J, Vaidyanathan R, Talkachou A, Kalifa J, et al. Activation of inward rectifier potassium channels accelerates atrial fibrillation in humans: evidence for a reentrant mechanism. Circulation. 2006;114:2434–42. doi: 10.1161/CIRCULATIONAHA.106.633735. [DOI] [PubMed] [Google Scholar]


