

Abstract
Despite years of study the structural or dynamical basis for the differential reactivity and oncogenicity of Ras isoforms and mutants remains unclear. In this study, we investigated the effects of amino acid variations on the structure and dynamics of wild type and oncogenic mutants G12D, G12V and G13D of H- and K-Ras proteins. Based on data from μs-scale molecular dynamics simulations, we show that the overall structure of the proteins remains similar but there are crucial differences in dynamics and interaction networks. We identified differences in residue interaction patterns around the canonical switch and distal loop regions, and persistent sodium ion binding near the GTP particularly in the G13D mutants. Our results also suggest that different Ras variants have distinct local structural features and interactions with the GTP, variations that have the potential to affect GTP release and hydrolysis. Furthermore, we found that H-Ras proteins and particularly the G12V and G13D variants are significantly more flexible than their K-Ras counterparts. Finally, while most of the simulated proteins sampled the effector-interacting state 2 conformational state, G12V and G13D H-Ras adopted an open switch state 1 conformation that is defective in effector interaction. These differences have implications for Ras GTPase activity, effector or exchange factor binding, dimerization and membrane interaction.
Keywords: Ras proteins, conformational transitions, molecular dynamics, oncogenic mutations
Introduction
The Ras family small GTPases propagate signal from cell-surface receptors to crucial signal transduction cascades including the MAPK/ERK and PI3K/AKT pathways1. They are on/off switches that regulate cell proliferation, growth, and development by interconverting between GTP- and GDP-bound forms2. Active and inactive Ras primarily differ at two flexible switch regions: switch SI (residues 25–40) and SII (residues 60–75)3–6. The switch regions undergo nucleotide-dependent conformational changes that allow them to selectively interact with exchange factors or effectors7,8. Recent studies suggest that the bound nucleotide also affects Ras dimerization9, clustering10 and membrane binding11–14.
Despite a nearly identical catalytic domain (residues 1–166, see Figure 1), the three most common Ras isoforms in human cells (N-, H- and K-Ras) respond to extracellular stimuli in a divergent though controlled fashion15–17. As a result, their malfunction can lead to distinct cancer types. These include H-Ras mutations in thyroid18 and bladder cancers19, K-Ras mutations in lung, colorectal20 and pancreatic cancers21, and N-Ras mutations in melanomas and hematologic malignancies22,23. In general, mutant Ras is associated with about a quarter of all human cancers and K-Ras mutations account for 85% of the Ras-related cancers23–25. As a result, K-Ras has become one of the most prominent anticancer drug targets26–32. The isoforms significantly differ in sequence at the hypervariable region (HVR, residues 167–185/6) that anchors Ras to the inner leaflet of the plasma membrane. Membrane binding is achieved through a posttranslationally farnesylated C-terminus complemented by a proximal palmitoylated cysteine (N- and H-Ras) or polybasic domain (K-Ras)33. Thus the HVR regulates isoform-specific plasma membrane distribution11,13,34, but the role of the few amino acid substitutions at the catalytic domain is not clear.
Figure 1. H- and K-Ras sequence and structure.

(A) Multiple sequence alignment of the amino acids of the catalytic domain of WT H- and K-Ras proteins. The SI and SII regions are highlighted by bold font, while the sequence differences between the two proteins are highlighted in red. (B) K-Ras structure shown in cartoon with the location of the mutations studied in this work highlighted by red spheres. Similarly, isoform variations are highlighted by green spheres and labeled in green and red for K-Ras and H-Ras, respectively. (C) A snapshot from one of the simulations; the catalytic domain is in cartoon colored in dark grey and switches SI (residues 25–40) and SII (residues 60–75) are in red. Water is shown as transparent light cyan shading with magnesium, sodium and chloride ions in blue, yellow and green spheres, respectively. The bound GTP is in purple sticks.
Differential engagement with membrane, regulators or effectors defines the complexity of Ras signaling35,36. Functional differences among Ras isoforms or mutants, however, are likely determined by an intricate interplay of minimally altered interactions. This makes the interpretation of cell-based experimental data (e.g. see ref37) in terms of an underlying molecular mechanism a very challenging task. Several studies have suggested that Ras functional diversity might involve variations in the population of conformational states spanning a spectrum of inactive, intermediate and active states38–40. In addition to the bound nucleotide38,41 and mutations40,42–44 (see also more recent elegant calculations on the impact of mutations on GTP hydrolysis45–47) the population of these states may be affected by oligomerization and interaction with membrane or other partners48,11–13,49,50,48,51,52. Interaction with partner proteins can induce relatively large conformational changes especially at the switch loops 53–55. However, mutations including oncogenic somatic point mutations24,31 induce only small changes that are difficult to unambiguously link to functional consequences. In particular, mutations at positions 12 and 13 of the phosphate-binding P-loop cause only subtle local conformational changes in the average structure and yet lead to distinct cancer phenotypes22. A number of studies have suggested that oncogenic mutations vary in their effects on effector or regulator binding56–59, but little measurable changes in structure, dynamics or inter-residue interaction profile have been documented. Moreover, the vast majority of the available X-ray and NMR structures do not contain GTP but rather GDP or a non-hydrolysable GTP analog. Thus it remains unclear how mutations affect the dynamics of GTP-Ras. Based on a detailed analysis of unbiased molecular dynamics (MD) simulations, here we show that WT H- and K-Ras and their oncogenic G12D, G12V and G13D variants exhibit differential structural adaptions and fluctuations in the ns-μs timescale.
Material and Methods
We simulated the GTP-bound catalytic domain of WT H- and K-Ras, and three mutants of each: G12D, G12V and G13D. As shown in Figure 1, all the mutations considered here are on the P-loop at lobe 1 (residues 1–86) whereas the isoform variations are located at lobe 2 (residues 87–166)60.
Initial structures and system setup
For G12D K-Ras, the starting structure was downloaded from the RCSB protein data bank (pdb id: 4DSO). Since high-resolution crystal structure was unavailable for WT and G12V K-Ras, we used this same 4DSO structure to generate their initial configurations by mutating D12 to G or V. Similarly we mutated D12 to G and G13 to D in the 4DSO structure to generate a G13D mutant K-Ras structure. For WT H-Ras and its G12V and G12D variants we used the available crystal structures 1QRA, 2VH5 and 1AGP, respectively. We mutated G13 to D in the 1QRA structure to generate the starting structure of G13D H-Ras. In each case we replaced the GTP analogue to GTP and removed all other atoms/molecules in the PDB file except for waters and Mg2+. The C-terminus and anionic residues were deprotonated while the N-terminus and cationic residues were protonated assuming neutral pH. The resulting structure was placed in a cubic box containing TIP3P water molecules, and Na+ and Cl− ions were added to neutralize the system and achieve an ionic strength of 150 mM (Table S1). A minimum of 10 Å buffer between the edges of the box and protein atoms was used to ensure that the protein does not interact with its periodic images. Figure 1C shows an example of the final system configuration.
Molecular dynamics simulation
The solvated systems were energy minimized (5000 steps of conjugate gradient), gradually heated keeping the Cα and GTP heavy atoms restrained by a harmonic restraint of force constant k=4 kcal mol−1Å−2, and equilibrated with k progressively reduced to zero by decrements of 1 kcal mol−1Å−2 every 100 ps. A 2 fs time step was used with the SHAKE61 algorithm applied to covalent bonds involving hydrogen atoms. The isothermal-isobaric (NPT) ensemble and periodic boundary conditions were used. Temperature was maintained at the physiologic value of 310K using Langevin dynamics with a damping coefficient of 10 ps−1. The Nose-Hoover Langevin piston method was used with a piston period of 200 fs and decay time interval of 100 fs to maintain constant pressure at 1.0 atm. Short-range van der Waals interactions were smoothly switched off between 10 Å and 12 Å, with a 14 Å cutoff used for non-bonded pair list updates. Long-range electrostatic interactions were computed using the Particle Mesh Ewald (PME) method62 with grid density of about one grid point per Å. Each system was simulated for 1 μs with NAMD2.1163 using the CHARMM27 empirical force field and cMAP dihedral angle correction64.
Residue contact analysis
Coarse-grained residue-residue contact analysis has been successfully used to examine dynamic interactions in proteins60,65,66. While sufficient for most applications, residue-residue contact would miss cases in which, for example, a side chain reorientation occurs while backbone contact remains intact. In order to capture subtle conformational changes that might be missed by the traditional approach, we developed a version that splits the residue-residue contact into backbone- and sidechain-residue contacts. Thus we defined contact based on a distance cutoff of 4.5 Å between two heavy atoms of the (i) backbone of residue i and backbone or side chain of residue j (backbone-residue contact) and (ii) side chain of the ith residue and backbone or side chain of the jth residue (sidechain-residue contact). Backbone (bij) and sidechain (sij) binary contact state variables were then assigned a value of 1 if contact exists and 0 otherwise. The corresponding contact probabilities 〈bij 〉 and 〈sij〉 were calculated by averaging sij and bij over the entire trajectory and then symmetrized on the maximum. Similarly, we split GTP into three contact moieties: purine, ribose and triphosphate. To quantify conformational differences between two trajectories, a single difference contact measure (dcij) was constructed using a signed Chebyshev distance to merge the difference backbone- and sidechain-residue contact probabilities:
| (1) |
where subscript m and ref denote two different trajectories. To ensure statistical significance of the observed dcij only residue pairs with interaction probability differences of ≥40% were considered.
Calculation of backbone relaxation times and NMR order parameter
Changes in entropy and allostery associated with conformational dynamics generally affect interactions of a protein with its binding partners. Likewise, differences among Ras proteins in terms of amplitude and frequency of residue fluctuations could impact intermolecular interactions. Previous studies67–71 suggested that backbone motions in Ras are mostly of small amplitude and occur on a long timescale. However, the switch regions have been shown to undergo high frequency large amplitude fluctuations41,68,69. Therefore, we first examined the dynamics of SI and SII based on the relaxation of their backbone N-H dipoles using the correlation function C(t)72 defined as
| (2) |
where P2 is the second order Legendre polynomial and μ̂ is a unit vector along the backbone amide N-H bond at times t and 0. The angle brackets denote averaging over time, time origins and N-H bonds of SI or SII. The internal backbone correlation function, Cint(t), was calculated similarly after removing the center of mass translational and rotational motions by aligning each frame to the initial structure excluding the switches.
To probe the dynamics in the entire protein including long timescale and small amplitude fluctuations, we calculated the NMR order parameter per residue, S2, using73
| (3) |
where μx,μy and μz are the x, y and z components of μ̂ of a given residue. S2 is averaged over the entire trajectory and has contributions from all internal motions irrespective of timescales.
Results and Discussion
We used eight 1μs-long unbiased MD simulations of H- and K-Ras catalytic domains to map out the structural and dynamic features behind the functional divergence of Ras isoforms and mutants. Below we describe the differential dynamics of these systems as assessed by principal component analysis, a combined backbone-residue and sidechain-residue contact analysis, relaxation order parameters, and other detailed trajectory analysis techniques.
H-Ras mutants exhibit larger global dynamics than K-Ras
Overlay of the average structure from the eight simulations (Figure 2, top) indicate no major structural differences at the core of the different Ras proteins studied in this work. The overall structure is very stable in all of the simulations, with <1.2 Å backbone root square mean deviation (RMSD) from the respective X-Ray structures (Figure 2, bottom). However, notable differences are apparent at SI and SII (Figure S1–2). For SI, the average RMSD of the mutants relative to WT is 0.75–1.6 Å (K-Ras) and 0.71–4.0 Å (H-Ras); G12D and G12V H-Ras have the largest RMSD and adopted an open SI conformation. Similarly, the RMSDs of SII are large: 1.3 – 2.4 Å for K-Ras and 0.6 – 3.2 Å for H-Ras; this is mainly due to conformational changes at the N-terminus of α2. These are mirrored by the Cα atom root-mean square fluctuations (RMSFs) per residue, which are indistinguishable among most of the proteins except at a few residues of SI and SII (Figure 3). In particular, SI is most flexible in G12D and G12V H-Ras, while it is least flexible in G13D and WT H-Ras and G12D K-Ras. All K-Ras mutants exhibit markedly less flexibility at SII. Overall, these results suggest that H-Ras proteins are more flexible than K-Ras at least for the variants studied here. This is in contrast with our earlier findings based on short (10ns-20ns) simulations of G12V and A59G H-Ras on the one hand homology-built G12V K-Ras and Q61H K-Ras on the other, where the K-Ras variants were found to be more flexible at SI, SII and other loop regions43,60.
Figure 2. Time evolution of backbone root-mean square deviations.

(Top) Time-averaged backbone structure of H-Ras and K-Ras mutants. Dashed squares high light regions with significant conformational differences. (Bottom) Time evolution of backbone RMSD from the respective initial X-Ray structure calculated after alignment excluding the flexible switch regions. Sampling was every 10 ps (black) with 10 ns-running averages (red). Color codes in this and subsequent figures are as follows. K-Ras: G12D (black), G13D (dark red), G12V (dark blue) and WT (dark green); H-Ras: G12D (grey) and G13D (light red), G12V (light blue) and WT (light green).
Figure 3. Cα root mean square fluctuation.

Backbone RMSF calculated after alignment excluding SI and SII that are highlighted by purple and cyan shadow, respectively.
To further examine the global dynamics of the simulated systems we used a previously described approach41,60. This approach entails a principal component (PC) analysis of Ras X-ray structures and projection of MD-derived conformations onto an xy-plane defined by the two PCs with the largest eigenvalues. Figure 4 shows that our proteins sample a relatively wide but largely overlapping conformational space close to the cluster of GTP-Ras X-ray structures. Despite the overall similarities, however, two important lessons could be drawn from this analysis regarding the dynamic signature of the simulated systems. First, the H-Ras systems sampled a larger conformational space than their K-Ras counterparts. This is substantiated by the observed fluctuations along PC1 due to large fluctuations of SI (Table S2). Secondly, G12D and G12V H-Ras sample regions in-between those sampled by GDP- and GTP-bound X-ray structures. This suggests that these mutants adopt an intermediate conformation, in agreement with our previous observation for G12V H-Ras60.
Figure 4. Global conformational dynamics of H- and K-Ras mutants.

Projection of simulated conformations onto the first and second principal components obtained from an analysis of Ras crystallographic structures (purple circles).
Backbone- and sidechain-residue contact analysis reveals differential interaction networks in H- and K-Ras isoforms and their P-loop oncogenic mutants
We first analyzed our trajectories using the more coarse residue-residue contact analysis described in previous reports60,65,66. We noticed that this analysis failed to capture a few differential dynamic contacts that were apparent by visual inspection. For example, side chains of E31 and D33, residues critical in effector binding74, form a metal ion-mediated salt bridge 60% of the time in WT H-Ras but almost never in G12D H-Ras. Since E31 and D33 are sequence neighbors, their backbone atoms remain close and yield a high residue-residue contact probability in both wild-type and G12D H-Ras. For these residues, the difference in contact probability between the trajectories would therefore be zero. We reasoned that a slightly more fine-grained contact analysis that entails combined sidechain-residue and backbone-residue contacts would capture the metal-mediated interaction between E31 and D33, as well as similar other dynamic interactions. Figure 5A shows the wide spectrum of backbone- and sidechain-residue contact probability patterns for H- and K-Ras mutants. As expected, residue-residue interactions occur through a combination of backbone-residue (along x-axis), side chain-residue (along y-axis), or both (the rest of the x–y plane). Figure 5B&C show the rank order probabilities of backbone-residue and sidechain-residue contacts. Despite the small variations in the number of interactions and their persistence among the mutants and isoforms, no major inter-residue contact perturbations were observed. This is consistent with the absence of global conformational changes, as described in the previous section. The difference between the sidechain- and backbone-residue rank ordered contact probabilities indicates that side chains have larger contribution to the inter-residue interaction network. The sharp transition in the sidechain-residue ranked contact probability curves indicates fewer number of transient sidechain-residue interactions than backbone-residue interactions.
Figure 5. Combined backbone-residue and sidechain-residue contact analysis.

(A) Scatter plot of sidechain-residue versus backbone-residue contacts of all possible residue pairs from all simulated systems. (B) Backbone-residue ( 〈b〉) and sidechain-residue ( 〈s〉) probability of contacts ranked by occurrence. (C) Difference in sidechain-residue (Δ〈s〉), backbone-residue (Δ〈b〉) and residue-residue (Δ〈r〉) contact probabilities between G12D and WT K-Ras. Δ〈s〉 and Δ〈b〉 were merged into a single difference measure (dc) using a signed Chebyshev distance (eq. 1). Green, purple and yellow arrows highlight a more significant change in sidechain-residue contact probability, while grey arrows highlight a change in backbone-residue contact probability that is also captured by the difference in residue-residue contact probabilities.
To compare two Ras variants we merged the sidechain- and backbone-residue contact probabilities into one measure using a signed Chebyshev distance (equation 1). Using WT and G12D K-Ras as example, Figure 5D shows how this measure preserves the largest differences in sidechain- and backbone-residue contact probabilities. However, there are some notable differences between the fine-grained and coarse-grained analyses. These include interactions of D/G12 with neighboring residues (green arrow) that are captured by the difference in sidechain-residue (Δ〈s〉) but not by residue-residue (Δ〈r〉) or backbone-residue (Δ〈b〉) contact probabilities. Similarly, the yellow and purple arrows highlight differences captured only by Δ〈s〉, including R68-Y71 and C118-S145 interactions. These observations demonstrate the additional insights that can be obtained from splitting the contact analysis into its side chain and backbone components.
Using this approach, Figure 6 shows differences in interaction patterns among all of the simulated systems. One can see that there are a large number of variations within and in the vicinity of the nucleotide-binding site, plus a few at relatively distant locations. A number of important observations can be made from Figure 6. (i) The hydroxyl group of Y32 is engaged in a hydrogen bond interaction with the backbone amide of V29 in G12V K-Ras whereas in G12D and G13D H-Ras it frequently interacts with the α– phosphate oxygen atoms. In the rest of the mutants and WT H- and K-Ras, Y32 is flexible with no significant preferred interactions. These variations may have functional significance since Y32 undergoes a major reorientation during nucleotide exchange75–77. (ii) We observe variations in the persistence of the network of interactions involving Y71 and V9, E37, D38 or R68. Many of these residues are part of a proposed dimerization interface78, and a ligand binding pocket30,79–81 whose solvent accessibility may be affected by these variations. For instance, displacement of Y71 exposes the hydrophobic cleft around residues V7, V9, F58 and F78. (iii) Most mutants show increased coupling between SII and SI relative to the WT proteins. This was made possible by the formation of transient contacts between the SII residue Y71 and the effector interacting SI residues E37 and D38. In particular, the side chain of Y71 frequently interacts with the side chain or backbone atoms of E37 or D38 in all of the mutants except G12V H-Ras, where Y71 interacts with the proximal A59. Also, Y71 sporadically couples SII and α3 through its interaction with Y96. (iv) Y96 and R68 are engaged in a stable interaction in the K-Ras proteins, but less so in G12V and WT H-Ras and it is entirely lost in G12D and G13D H-Ras. These observations strongly suggest that P-loop mutations have the potential to affect Ras self-interaction82 and membrane orientation13,49, processes that have been shown to involve α3 and SII. (v) In H-Ras proteins, α2 is elongated and Y141 and R123 form a hydrogen bond. The latter is absent in K-Ras due to the Y141F substitution. Overall, these variations in intra-protein interaction networks around the active site will likely affect GTP hydrolysis and/or GDP release, or may differentially induce indirect allosteric effects.
Figure 6. Difference contact probability networks.

Residue pairs of a protein that show |dc| of 40% or more relative to another mutant or isoform are connected by cylinders whose radius is weighted by |dc| and colored in blue (gain of interaction) or red (loss of interaction). (Top) Difference contact probabilities of K-Ras proteins from their H-Ras counterparts. (Middle) Difference contact probabilities of H-Ras mutants relative to WT H-Ras. (Bottom) Difference contact probabilities of K-Ras mutants relative to WT K-Ras. Notice that in both K-Ras and H-Ras, G12D exhibits the least difference from the WT, possibly because even a 1_s run may not be sufficient to completely relax the system in response to the mutagenesis.
Dynamics of protein-GTP interactions
Given the variable intra-protein interaction patterns described above, we wondered whether mutations at positions 12 and 13 might also affect protein-GTP interactions. This is important because these interactions can affect rates of nucleotide exchange and GTPase activity. Therefore, we first looked at the distribution of the total number of protein-GTP contacts. We found that the average number and fluctuation of these contacts are generally insensitive to mutation; the exception is G12D H-Ras that have a smaller average number of contacts. In the G13D mutants the aspartate forms an ion-mediated interaction with Oγ1 of GTP, which may affect the kinetics of nucleotide binding and release. This is consistent with biochemical experiments that found that the intrinsic rate of GDP/GTP exchange in G13D K-Ras is an order of magnitude higher than WT49. These results show that individual P-loop mutations variably affect interactions with the bound GTP in a manner that impacts function.
Earlier 31P NMR experiments on H-Ras bound to guanosine 5′-(β, γ-imido) triphosphate (GppNHp, a non-hydrolyzable GTP analogue) found two slowly exchanging conformational states (state 1 and 2), with distinct chemical shift values for the phosphate atoms of the nucleotide 38,83,84. Conformational state 2 interacts with effector proteins while state 1 favors exchange factors38,83 and/or acts as a reservoir of the GTP.Ras pool85. Our simulated structures mostly remained close to the initial state 2 configuration. For instance, interactions of T35 and G60 with GTP that are characteristic of state 2 are very similar in all mutants except G12D and G12V H-Ras (Table 1). In the latter, the average G60:N-GTP:Oγ2 and T35:Oη-GTP:Oγ3 distances are significantly larger, because the interactions were lost very early in the simulations and did not recover. This suggests that GTP-bound G12D and G12V H-Ras predominantly sample the inactive state 1 conformation, similar to the X-ray structure 2Q21 of G12V H-Ras where the switch regions are very flexible and less coupled86 and the state 1 T35S H-Ras structure bound to GppNpH87. However, despite the flexibility of the switches, G12V H-Ras forms unique and persistent interactions with the GTP ribose O1’ and O2’ via A29 and D30. These interactions appear to have attenuated the fluctuation of the switch regions when compared to G12D H-Ras. Overall, our results support the notion that SI of GTP-Ras exists in multiple conformational sates including states 1 and 2. The fact that we did not observe multiple transition events between these states suggests that inter-state transitions, particularly the transition from state 1 to state 2, are slow processes that occur on timescales greater than 1 μs.
Table 1.
Average distance of T35 and G60 from GTP.
| G60:N-GTP:Oγ2 (Å) | T35:Oη-GTP:Oγ3 (Å) | |
|---|---|---|
| WT H-Ras | 3.6±0.5 | 2.9±0.1 |
| G12D H-Ras | 7.4±1.2 | 10±2 |
| G12V H-Ras | 6.4±0.5 | 11±2 |
| G13D H-Ras | 3.3±0.4 | 2.9±0.1 |
| WT K-Ras | 3.5±0.5 | 2.8±0.1 |
| G12D K-Ras | 3.1±0.3 | 2.9±0.1 |
| G12V K-Ras | 3.4±0.6 | 2.9±0.4 |
| G13D K-Ras | 3.2±0.3 | 2.9±0.1 |
H- and K-Ras mutants exhibit differential relaxation times and backbone order
To probe effects of mutations on the relaxation times and internal motions of the switch regions, we computed the total (C(t)) and internal (Cint(t)) correlation functions of the backbone amides. Figure 7 shows that for both SI and SII, C(t) and Cint(t) are characterized by an initial steep decline followed by a slow decay. The initial decay can be linked to amide bond vibrations followed by fast local fluctuations while the slower phase can be linked to internal conformational flexibility. The C(t) plots, which describe the overall rotational motion of the switch regions, decay very slowly over an extended time, and diverge from the Cint(t) within a few nanoseconds due to molecular tumbling. Overall, Cint(t) suggests that in the 1 to 50ns time range SI has faster relaxation dynamics and is more flexible than SII. It also shows that the G13D mutation induces the slowest (and the least) and G12V the fastest (and the largest) SI relaxation within the same timescale. G12D and G13D K-Ras and G12V H-Ras exhibit a slower SII relaxation than the rest of the mutants, suggesting that the other mutants are likely to experience faster timescale transitions. These observations are supported by the calculated amide backbone order parameter per residue, S2 (Figures 8 and S3). (S2 was calculated over the entire trajectory at sampling frequency of 0.2ns, but other sampling frequencies yielded nearly identical results (Figure S4).). We calculated S2 as an average over four different time blocks representing 25, 50, 100 and 200ns time windows (Figure S3) and without block averaging representing the entire 1μs time window (Figure 8). Irrespective of the time window or the simulated system, we obtained S2 between 0.85 and 0.9 for residues at the core of the protein, consistent with a well-ordered structure. However, significantly lower S2 (0.5–0.7) were recorded for T2 and G77, and even lower values with large variations for SI, SII and some other loop regions. Comparison of the different time windows in Figure S4, or the overall data in Figure S4 with that of Figure 8, indicate that for these and other flexible regions the magnitude of the fluctuations somewhat varies with the time window selected, reflecting the existence of fluctuations at multiple timescales. However, all show qualitatively the same behavior. S2 of SI residues indicate large amplitude motions at almost all timescales, with residues 29–36 displaying the most dynamic behavior in the majority of the mutants. G13D mutants differ from the rest in their lower Y32 order parameter despite damped fluctuations elsewhere. S2 of residues 20–36 in G12D and G12V H-Ras are significantly different from their K-Ras counterparts, in agreement with our previous conclusion that these mutants sample the more dynamic state 1. Finally, despite some variations among the different timescales that we have analyzed, H-Ras proteins have smaller S2 at the loop C-terminal to helix 3 whereas K-Ras proteins are more flexible at the loop N-terminal to helix 4 (Figure S4).
Figure 7. Internal and total dynamics correlation functions.
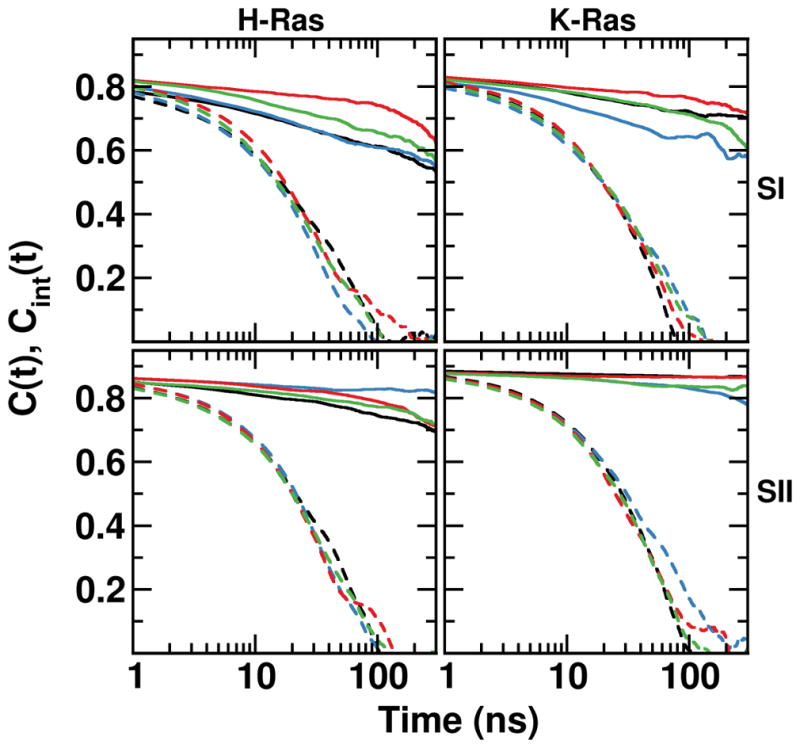
Shown are backbone amide bond dipole relaxations of the switch regions with total (C(t)) and internal (Cint(t)) correlation functions shown as dashed and solid lines, respectively. Color code as in Figure 2.
Figure 8. Order parameter of backbone amide bonds.

Residue S2 calculated over the entire trajectory at a sampling frequency of 0.2ns for H-Ras (black) and K-Ras (red). Qualitatively similar results were obtained at other time windows and sampling frequencies (Figures S3 and Figure S4).
Another notable observation is that S2 of E37 and D38 are smaller in the H-Ras mutants, suggesting a less ordered effector-binding loop and consistent with the altered SI/SII coupling captured by our difference contact analysis. The S2 profiles also indicate that SII is significantly more ordered in K-Ras than H-Ras, except for its G12V mutant. K-Ras mutants have smaller S2 at the β5-α4 loop or L8 (residues 121–123), where there are two amino acid substitutions between H- and K-Ras (AA to PS, see Figure 1); this is somewhat surprising because we anticipated P121 of K-Ras to decrease rather than increase the dynamics of L888. Conversely, H-Ras proteins harbor smaller S2 at the α3-β5 loop or L7 (residues 107–110). This appears to be due to the conservative D (H-Ras) to E (K-Ras) substitution at position 107, with E somehow rigidifying L7 and thereby affecting its interaction with solvent (see next section). This may be functionally relevant because conformational changes at α3/L7 have been shown to allosterically modulate Q61’s proximity to the nucleotide and thereby affect GTP hydrolysis89. Moreover, this loop is part of the allosteric pocket p327,28,30 and therefore the observed differential dynamics may have implications to the development of isoform-selective Ras inhibitors.
Differential solvent interactions
Visual inspection of the trajectories led to an intriguing observation, namely the active site of the G13D mutants is permanently occupied by a sodium ion. This prompted us to investigate the Na+ binding probabilities in the entire surface of the protein in all simulations (Figure 9). Binding was defined to exist if any heavy atom of a protein was within 4.5 Å of any Na+ ion of solvent. We found large Na+ contact probabilities at positions 12 and 13 in the G12D and G13D mutants (Figure 9), perhaps due to the negative charge of these residues. However, we were surprised to find similarly persistent interactions of Na+ with many other residues in SI. This is true for all systems, including WT. A closer look at the residues with >20% interaction probability revealed a Na+ that is tightly bound by GTP:Oβ3 and a number of P-loop residues (Figure 10). Figure 10 further shows that Na+ enters the site within a few nanoseconds of the production phase in G12D and G13D, and after some delay in the rest of the proteins. In G13D, once Na+ has entered its interaction was so tight that there was no exchange with bulk. In the rest of the proteins there were 1–7 exchange events or significant distance fluctuations, suggesting that binding was somewhat weaker and variable. We speculate that binding of a metal ion at this site induces displacement of Y32 away from the GTP. If so, the interaction of Y32 with the γ-phosphate of GTP commonly observed in GTP analogue-bound Ras structures, including 4DSO that was used as the starting structure of our K-Ras simulations, might not be as common in solution at physiologic ionic strength. This interpretation is supported by the lack of Y32-GTP interaction in some of the H-Ras experimental structures (e.g., 1QRA and 2Q21). However more work is required to draw a definitive conclusion, including potential force field artifacts even though those may not lead differential effects.
Figure 9. Protein-sodium interaction.

Probabilities of sodium ion binding per residue, with binding defined to exist if any heavy atom of a residue was within 4.5 Å of any sodium ion.
Figure 10. Long-residence sodium-ion binding sites.

(A) Distance between sodium ion and GTP:Oβ3. Different line colors indicate ion exchange. (B) A snapshot of G13D K-Ras showing a sodium ion interacting with GTP.
Figure 9 also reveals two other Na+ binding sites particularly in the H-Ras proteins. The first involves side chains of E3 and E76 and backbone carbonyl oxygen of Y4, providing for an ion-mediated interaction between E3 and E76 and hence a long-range communication between the N-terminus and SII. The second Na+ binding site involves side chains of D/E107 and D108 and the backbone carbonyl oxygen of G138. Sodium-protein interaction at this site is more pronounced in H-Ras, and the site has been previously shown to bind divalent ions and allosterically couple L7 to the nucleotide binding site89,90. Our results indicate that the site is capable of binding a monovalent ion as well. In addition, L7 is close to residues 161–164 and therefore metal ion binding at this site can modulate the interaction between D47/E49 and R161/R164. This can affect the allosteric inter-lobe communication through L3 (residues 46–49) and α5 that has been discussed previously41,60,71.
Finally, protein-bound water molecules have long been recognized as intimately linked to structural stability91. In a previous study, we characterized three long-residence water molecules (denoted W1, W3, and W4) that primarily interact with K16:O, A83:O and D126:O, respectively, as well others as (W2, W5, and W6) that are found in the majority of Ras X-ray structures92. All of these water molecules are detectable in our simulations, albeit with somewhat variable persistency (Figure S5). Notably, the deeply buried W4 coupling the P-loop with α3 rarely exchanges with bulk in all simulations (occupancy >90%). W1, which is coordinated by A18, H27 and V29, appeared in all simulations with 10–30% occupancy, except in WT and G13D K-Ras. W2 has a 20%–65% occupancy and bridges the backbone of K16 and the side chain of D57 in G12D/G12V K-Ras and G13D/WT H-Ras; W3 only exists in G12D H-Ras with an occupancy of 50% while W6 only occurs in G12V K-Ras and G12D H-Ras with a 40%–50% occupancy. Overall, irrespective of isoform or mutation, these structural waters exhibit substantially longer residence times than the most common ps range93. This conclusion recapitulates previous observations based on an analysis of all available Ras crystal structures and MD trajectories81,92,94.
Conclusion
Ras proteins have been studied extensively not only due to their crucial role in diverse biological processes and cancer but also because they are excellent model systems to study protein structure and dynamics. However, if and how the few amino acid differences at the catalytic domain of different isoforms affect function and how different mutations at the same position give rise to different signal outputs remained undetermined. A major goal of the current work was therefore to identify the structural and dynamic basis for the functional diversity of WT H-Ras and K-Ras and their oncogenic mutants G12D, G12V and G13D. To quantitatively compare conformational fluctuations and interaction patterns among these proteins, we conducted a 1μs unbiased MD simulation on each system and performed detailed analyses of intra-protein, protein-GTP and protein-solvent interactions. We analyzed conformational fluctuations using diverse measures of dynamic correlations, relaxation times, NMR order parameter and other techniques. The results show that the proteins we have studied harbor both shared and unique intra-protein and intermolecular interaction patterns and fluctuations. Differential dynamics and interaction patterns are particularly common in the vicinity of the GTP, but there are also variations at a number of loops distal from the active site. Key results include the following. (i) The switch regions of H-Ras proteins in general and G12V and G12D H-Ras in particular are significantly more flexible than their K-Ras counterparts. In fact, G12D and G12V H-Ras sample conformations that are distinct from the rest of the proteins, including an open switch configuration characteristic of the inactive state 1 of GTP Ras; this state has recently been characterized as a “stable pool of Ras. GTP in the GDP/GTP cycle” 85. In the rest of the simulations, the switches remain closed and similar to the available experimental structures of GTP or GTP-analogue-bound Ras. (ii) There are significant variations in intra-protein interaction networks around the active site, including enhanced coupling between the switches in most of the mutants. This was a result of an interaction between Y71 of SII and E37/D38 of the effector-binding loop. Such differences will likely affect GTP hydrolysis and/or GDP release. (iii) The simulations also revealed a previously unappreciated interaction of metal ions from solvent with the phosphate of GTP and neighboring residues. This interaction is particularly prominent in the G13D mutant of both H-Ras and K-Ras. In these mutants, entrance of a sodium ion is directly coupled with a rotation of the D13 side chain toward the phosphate moiety, where it participates in coordinating the metal ion. Ion binding also appears to be contributing to the displacement of Y32 from its position capping the GTP, and Y32 is significantly disordered in G13D mutants. This suggests a direct potential effect on nucleotide exchange that is associated with Y32 movement. (iv) We observed differences in protein-solvent interaction and fluctuations distal from the active site, including at loops L7 and L8. For example, K-Ras mutants are more dynamic at L8 than their H-Ras counterparts, indicating that effects of isoform variation and P-loop mutation are not limited to local side chain reorganizations at the active site. The observed differences in interaction with water and ions are significant in light of previous observations by us 92 and Mattos and colleagues 94 on the role of water networks on Ras allostery. (v) The differential fluctuations and interaction patterns listed above and many others described in this paper have implications for functional specialization including in GTPase activity and effector interaction. For example, oncogenicity of mutants that favor the state 1 conformation such as G13D H-Ras is likely caused by a different mechanism than those that favor state 2. We caution, however, that transition between these two states is slow and might require longer than 1 μs simulation. Quantifying the population of these states in each isoform and mutant via longer simulations or using enhanced sampling methods would be a worthy future endeavor.
Supplementary Material
Acknowledgments
We thank the Texas Advanced Computing Center (TACC) and the Extreme Science and Engineering Discovery Environment (XSEDE Project: MCB150054) for computational resources. This work was supported in part by the National Institutes of Health General Medical Sciences (Grant No. R01GM100078) and the Cancer Prevention and Research Institute of Texas (CPRIT grant No. DP150093).
References
- 1.Cox AD, Der CJ. Ras history: The saga continues. Small GTPases. 2010;1:2–27. doi: 10.4161/sgtp.1.1.12178. [DOI] [PMC free article] [PubMed] [Google Scholar]
- 2.Barbacid M. Ras genes. Annu Rev Biochem. 1987;56:779–827. doi: 10.1146/annurev.bi.56.070187.004023. [DOI] [PubMed] [Google Scholar]
- 3.Bourne HR, Sanders DA, McCormick F. The GTPase superfamily: a conserved switch for diverse cell functions. Nature. 1990;348:125–132. doi: 10.1038/348125a0. [DOI] [PubMed] [Google Scholar]
- 4.Hall BE, Bar-Sagi D, Nassar N. The structural basis for the transition from Ras- GTP to Ras-GDP. Proc Natl Acad Sci USA. 2002;99:12138–12142. doi: 10.1073/pnas.192453199. [DOI] [PMC free article] [PubMed] [Google Scholar]
- 5.Shields JM, Pruitt K, McFall A, Shaub A, Der CJ. Understanding Ras:‘it ain’t over’til it’s over’. Trends Cell Biol. 2000;10:147–154. doi: 10.1016/s0962-8924(00)01740-2. [DOI] [PubMed] [Google Scholar]
- 6.Vetter IR, Wittinghofer A. The guanine nucleotide-binding switch in three dimensions. Science. 2001;294:1299–1304. doi: 10.1126/science.1062023. [DOI] [PubMed] [Google Scholar]
- 7.Avruch J, Zhang X-f, Kyriakis JM. Raf meets Ras: completing the framework of a signal transduction pathway. Trends Biochem Sci. 1994;19:279–283. doi: 10.1016/0968-0004(94)90005-1. [DOI] [PubMed] [Google Scholar]
- 8.Wittinghofer A, Nassar N. How Ras-related proteins talk to their effectors. Trends Biochem Sci. 1996;21:488–491. doi: 10.1016/s0968-0004(96)10064-5. [DOI] [PubMed] [Google Scholar]
- 9.Nan X, et al. Ras-GTP dimers activate the mitogen-activated protein kinase (MAPK) pathway. Proc Natl Acad Sci USA. 2015;112:7996–8001. doi: 10.1073/pnas.1509123112. [DOI] [PMC free article] [PubMed] [Google Scholar]
- 10.Zhou Y, Hancock JF. Ras nanoclusters: Versatile lipid-based signaling platforms. Biochim Biophys Acta, Mol Cell Res. 2015;1853:841–849. doi: 10.1016/j.bbamcr.2014.09.008. [DOI] [PubMed] [Google Scholar]
- 11.Abankwa D, Gorfe AA, Inder K, Hancock JF. Ras membrane orientation and nanodomain localization generate isoform diversity. Proc Natl Acad Sci USA. 2010;107:1130–1135. doi: 10.1073/pnas.0903907107. [DOI] [PMC free article] [PubMed] [Google Scholar]
- 12.Mazhab-Jafari MT, et al. Oncogenic and RASopathy-associated K-RAS mutations relieve membrane-dependent occlusion of the effector-binding site. Proc Natl Acad Sci USA. 2015;112:6625–6630. doi: 10.1073/pnas.1419895112. [DOI] [PMC free article] [PubMed] [Google Scholar]
- 13.Prakash P, Gorfe AA. Membrane orientation dynamics of lipid-modified small GTPases. Small GTPases. 2016:1–10. doi: 10.1080/21541248.2016.1211067. [DOI] [PMC free article] [PubMed] [Google Scholar]
- 14.Gorfe AA, Hanzal-Bayer M, Abankwa D, Hancock JF, McCammon JA. Structure and dynamics of the full-length lipid-modified H-Ras protein in a 1,2- dimyristoylglycero-3-phosphocholine bilayer. J Med Chem. 2007;50:674–84. doi: 10.1021/jm061053f. [DOI] [PubMed] [Google Scholar]
- 15.Yan J, Roy S, Apolloni A, Lane A, Hancock JF. Ras isoforms vary in their ability to activate Raf-1 and phosphoinositide 3-kinase. J Biol Chem. 1998;273:24052–24056. doi: 10.1074/jbc.273.37.24052. [DOI] [PubMed] [Google Scholar]
- 16.Castellano E, Santos E. Functional specificity of ras isoforms so similar but so different. Genes Cancer. 2011;2:216–231. doi: 10.1177/1947601911408081. [DOI] [PMC free article] [PubMed] [Google Scholar]
- 17.Abankwa D, Gorfe AA, Hancock JF. Ras nanoclusters: molecular structure and assembly. Semin Cell Dev Biol. 2007;18:599–607. doi: 10.1016/j.semcdb.2007.08.003. [DOI] [PMC free article] [PubMed] [Google Scholar]
- 18.Namba H, Rubin SA, Fagin JA. Point mutations of ras oncogenes are an early event in thyroid tumorigenesis. Mol Endocrinol. 1990;4:1474–1479. doi: 10.1210/mend-4-10-1474. [DOI] [PubMed] [Google Scholar]
- 19.Visvanathan K, Pocock R, Summerhayes I. Preferential and novel activation of H-ras in human bladder carcinomas. Oncogene research. 1987;3:77–86. [PubMed] [Google Scholar]
- 20.Bos JL, et al. Prevalence of ras gene mutations in human colorectal cancers. Nature. 1987;327:293–297. doi: 10.1038/327293a0. [DOI] [PubMed] [Google Scholar]
- 21.Almoguera C, et al. Most human carcinomas of the exocrine pancreas contain mutant cK-ras genes. Cell. 1988;53:549–554. doi: 10.1016/0092-8674(88)90571-5. [DOI] [PubMed] [Google Scholar]
- 22.Prior IA, Lewis PD, Mattos C. A Comprehensive Survey of Ras Mutations in Cancer. Cancer Res. 2012;72:2457–2467. doi: 10.1158/0008-5472.CAN-11-2612. [DOI] [PMC free article] [PubMed] [Google Scholar]
- 23.van’t Veer LJ, et al. N-ras mutations in human cutaneous melanoma from sun-exposed body sites. Mol Cell Biol. 1989;9:3114–3116. doi: 10.1128/mcb.9.7.3114. [DOI] [PMC free article] [PubMed] [Google Scholar]
- 24.Bos JL. Ras oncogenes in human cancer: a review. Cancer Res. 1989;49:4682–4689. [PubMed] [Google Scholar]
- 25.Riely GJ, Marks J, Pao W. KRAS mutations in non-small cell lung cancer. Proc Am Thorac Soc. 2009;6:201–5. doi: 10.1513/pats.200809-107LC. [DOI] [PubMed] [Google Scholar]
- 26.Ostrem JM, Shokat KM. Direct small-molecule inhibitors of KRAS: from structural insights to mechanism-based design. Nat Rev Drug Discovery. 2016 doi: 10.1038/nrd.2016.139. [DOI] [PubMed] [Google Scholar]
- 27.Prakash P, Hancock JF, Gorfe AA. Binding hotspots on K-ras: Consensus ligand binding sites and other reactive regions from probe-based molecular dynamics analysis. Proteins Struct Funct Bioinf. 2015;83:898–909. doi: 10.1002/prot.24786. [DOI] [PMC free article] [PubMed] [Google Scholar]
- 28.Prakash P, Sayyed-Ahmad A, Gorfe AA. pMD-membrane: A method for ligand binding site identification in membrane-bound proteins. PLoS Comput Biol. 2015;11:e1004469. doi: 10.1371/journal.pcbi.1004469. [DOI] [PMC free article] [PubMed] [Google Scholar]
- 29.Hocker HJ, et al. Andrographolide derivatives inhibit guanine nucleotide exchange and abrogate oncogenic Ras function. Proc Natl Acad Sci USA. 2013;110:10201–10206. doi: 10.1073/pnas.1300016110. [DOI] [PMC free article] [PubMed] [Google Scholar]
- 30.Grant BJ, et al. Novel allosteric sites on Ras for lead generation. PLoS One. 2011;6:e25711. doi: 10.1371/journal.pone.0025711. [DOI] [PMC free article] [PubMed] [Google Scholar]
- 31.Cox AD, Fesik SW, Kimmelman AC, Luo J, Der CJ. Drugging the undruggable RAS: Mission Possible? Nat Rev Drug Discovery. 2014;13:828–851. doi: 10.1038/nrd4389. [DOI] [PMC free article] [PubMed] [Google Scholar]
- 32.Baines AT, Xu D, Der CJ. Inhibition of Ras for cancer treatment: the search continues. Future Med Chem. 2011;3:1787–808. doi: 10.4155/fmc.11.121. [DOI] [PMC free article] [PubMed] [Google Scholar]
- 33.Hancock JF, Magee AI, Childs JE, Marshall CJ. All ras proteins are polyisoprenylated but only some are palmitoylated. Cell. 1989;57:1167–1177. doi: 10.1016/0092-8674(89)90054-8. [DOI] [PubMed] [Google Scholar]
- 34.Hancock JF. Ras proteins: different signals from different locations. Nat Rev Mol Cell Biol. 2003;4:373–385. doi: 10.1038/nrm1105. [DOI] [PubMed] [Google Scholar]
- 35.Vojtek AB, Der CJ. Increasing complexity of the Ras signaling pathway. J Biol Chem. 1998;273:19925–19928. doi: 10.1074/jbc.273.32.19925. [DOI] [PubMed] [Google Scholar]
- 36.Boguski MS, McCormick F. Proteins regulating Ras and its relatives. Nature. 1993;366:643–654. doi: 10.1038/366643a0. [DOI] [PubMed] [Google Scholar]
- 37.Stolze B, Reinhart S, Bulllinger L, Fröhling S, Scholl C. Comparative analysis of KRAS codon 12, 13, 18, 61, and 117 mutations using human MCF10A isogenic cell lines. Sci Rep. 2015;5 doi: 10.1038/srep08535. [DOI] [PMC free article] [PubMed] [Google Scholar]
- 38.Spoerner M, et al. Conformational states of human rat sarcoma (Ras) protein complexed with its natural ligand GTP and their role for effector interaction and GTP hydrolysis. J Biol Chem. 2010;285:39768–39778. doi: 10.1074/jbc.M110.145235. [DOI] [PMC free article] [PubMed] [Google Scholar]
- 39.Lu S, et al. Ras conformational ensembles, allostery, and signaling. Chem Rev. 2016;116:6607–6665. doi: 10.1021/acs.chemrev.5b00542. [DOI] [PubMed] [Google Scholar]
- 40.Marcus K, Mattos C. Direct attack on RAS: intramolecular communication and mutation-specific effects. Clin Cancer Res. 2015;21:1810–1818. doi: 10.1158/1078-0432.CCR-14-2148. [DOI] [PubMed] [Google Scholar]
- 41.Grant BJ, Gorfe AA, McCammon JA. Ras conformational switching: simulating nucleotide-dependent conformational transitions with accelerated molecular dynamics. PLoS Comput Biol. 2009;5:e1000325. doi: 10.1371/journal.pcbi.1000325. [DOI] [PMC free article] [PubMed] [Google Scholar]
- 42.Futatsugi N, Tsuda M. Molecular dynamics simulations of Gly-12→ Val mutant of p21 ras: dynamic inhibition mechanism. Biophys J. 2001;81:3483–3488. doi: 10.1016/S0006-3495(01)75979-6. [DOI] [PMC free article] [PubMed] [Google Scholar]
- 43.Lukman S, Grant BJ, Gorfe AA, Grant GH, McCammon JA. The distinct conformational dynamics of K-Ras and H-Ras A59G. PLoS Comput Biol. 2010;6:e1000922. doi: 10.1371/journal.pcbi.1000922. [DOI] [PMC free article] [PubMed] [Google Scholar]
- 44.Shurki A, Warshel A. Why does the Ras switch “break” by oncogenic mutations? Proteins Struct Funct Bioinf. 2004;55:1–10. doi: 10.1002/prot.20004. [DOI] [PubMed] [Google Scholar]
- 45.Khrenova MG, Grigorenko BL, Mironov VA, Nemukhin AV. Why does mutation of Gln61 in Ras by the nitro analog NGln maintain activity of Ras-GAP in hydrolysis of guanosine triphosphate? Proteins. 2015;83:2091–9. doi: 10.1002/prot.24927. [DOI] [PubMed] [Google Scholar]
- 46.Khrenova MG, Mironov VA, Grigorenko BL, Nemukhin AV. Modeling the role of G12V and G13V Ras mutations in the Ras-GAP-catalyzed hydrolysis reaction of guanosine triphosphate. Biochemistry. 2014;53:7093–9. doi: 10.1021/bi5011333. [DOI] [PubMed] [Google Scholar]
- 47.Mironov VA, Khrenova MG, Lychko LA, Nemukhin AV. Computational characterization of the chemical step in the GTP hydrolysis by Ras-GAP for the wild-type and G13V mutated Ras. Proteins. 2015;83:1046–53. doi: 10.1002/prot.24802. [DOI] [PubMed] [Google Scholar]
- 48.Abankwa D, Gorfe AA, Hancock JF. Semin Cell Dev Biol. Vol. 18. Elsevier; 2007. Ras nanoclusters: molecular structure and assembly; pp. 599–607. [DOI] [PMC free article] [PubMed] [Google Scholar]
- 49.Prakash P, Zhou Y, Liang H, Hancock JF, Gorfe AA. Oncogenic K-Ras Binds to an Anionic Membrane in Two Distinct Orientations: A Molecular Dynamics Analysis. Biophys J. 2016;110:1125–1138. doi: 10.1016/j.bpj.2016.01.019. [DOI] [PMC free article] [PubMed] [Google Scholar]
- 50.Li Z, Cao S, Buck M. K-Ras at Anionic Membranes: Orientation, Orientation...Orientation. Recent Simulations and Experiments. Biophys J. 2016;110:1033–5. doi: 10.1016/j.bpj.2016.01.020. [DOI] [PMC free article] [PubMed] [Google Scholar]
- 51.Baussand J, Kleinjung J. Specific conformational states of Ras GTPase upon effector binding. J Chem Theory Comput. 2012;9:738–749. doi: 10.1021/ct3007265. [DOI] [PMC free article] [PubMed] [Google Scholar]
- 52.Harding A, Hancock JF. Ras nanoclusters: combining digital and analog signaling. Cell Cycle. 2008;7:127–34. doi: 10.4161/cc.7.2.5237. [DOI] [PMC free article] [PubMed] [Google Scholar]
- 53.Geyer M, et al. Conformational transitions in p21 ras and in its complexes with the effector protein Raf-RBD and the GTPase activating protein GAP. Biochemistry. 1996;35:10308–10320. doi: 10.1021/bi952858k. [DOI] [PubMed] [Google Scholar]
- 54.Herrmann C. Ras–effector interactions: after one decade. Curr Opin Struct Biol. 2003;13:122–129. doi: 10.1016/s0959-440x(02)00007-6. [DOI] [PubMed] [Google Scholar]
- 55.Pacold ME, et al. Crystal structure and functional analysis of Ras binding to its effector phosphoinositide 3-kinase γ. Cell. 2000;103:931–944. doi: 10.1016/s0092-8674(00)00196-3. [DOI] [PubMed] [Google Scholar]
- 56.Ford B, Hornak V, Kleinman H, Nassar N. Structure of a transient intermediate for GTP hydrolysis by ras. Structure. 2006;14:427–436. doi: 10.1016/j.str.2005.12.010. [DOI] [PubMed] [Google Scholar]
- 57.Hunter JC, et al. Biochemical and structural analysis of common cancer-associated KRAS mutations. Mol Cancer Res. 2015;13:1325–1335. doi: 10.1158/1541-7786.MCR-15-0203. [DOI] [PubMed] [Google Scholar]
- 58.John J, Frech M, Wittinghofer A. Biochemical properties of Ha-ras encoded p21 mutants and mechanism of the autophosphorylation reaction. J Biol Chem. 1988;263:11792–11799. [PubMed] [Google Scholar]
- 59.Herrmann C, Martin GA, Wittinghofer A. Quantitative analysis of the complex between p21 and the ras-binding domain of the human raf-1 protein kinase. J Biol Chem. 1995;270:2901–2905. doi: 10.1074/jbc.270.7.2901. [DOI] [PubMed] [Google Scholar]
- 60.Gorfe AA, Grant BJ, McCammon JA. Mapping the nucleotide and isoform-dependent structural and dynamical features of Ras proteins. Structure. 2008;16:885–896. doi: 10.1016/j.str.2008.03.009. [DOI] [PMC free article] [PubMed] [Google Scholar]
- 61.Ryckaert JPCG, Berendsen HJC. Numerical integration of the Cartesian Equations of Motion of a System with Constraints: Molecular Dynamics of n-Alkanes. J computational physics. 1977;23:15. [Google Scholar]
- 62.Darden T, York D, Pedersen L. Particle mesh Ewald: An N· log (N) method for Ewald sums in large systems. J Chem Phys. 1993;98:10089–10092. [Google Scholar]
- 63.Phillips JC, et al. Scalable molecular dynamics with NAMD. J Comput Chem. 2005;26:1781–1802. doi: 10.1002/jcc.20289. [DOI] [PMC free article] [PubMed] [Google Scholar]
- 64.Buck M, Bouguet-Bonnet S, Pastor RW, MacKerell AD., Jr Importance of the CMAP correction to the CHARMM22 protein force field: dynamics of hen lysozyme. Biophys J. 2006;90:L36–8. doi: 10.1529/biophysj.105.078154. [DOI] [PMC free article] [PubMed] [Google Scholar]
- 65.Johnson QR, Lindsay RJ, Nellas RB, Fernandez EJ, Shen T. Mapping Allostery through Computational Glycine Scanning and Correlation Analysis of Residue–Residue Contacts. Biochemistry. 2015;54:1534–1541. doi: 10.1021/bi501152d. [DOI] [PMC free article] [PubMed] [Google Scholar]
- 66.Doshi U, Holliday MJ, Eisenmesser EZ, Hamelberg D. Dynamical network of residue–residue contacts reveals coupled allosteric effects in recognition, catalysis, and mutation. Proc Natl Acad Sci USA. 2016;113:4735–4740. doi: 10.1073/pnas.1523573113. [DOI] [PMC free article] [PubMed] [Google Scholar]
- 67.Nussinov R, Tsai CJ. Allostery without a conformational change? Revisiting the paradigm. Curr Opin Struct Biol. 2015;30:17–24. doi: 10.1016/j.sbi.2014.11.005. [DOI] [PubMed] [Google Scholar]
- 68.Ma J, Karplus M. Molecular switch in signal transduction: reaction paths of the conformational changes in ras p21. Proc Natl Acad Sci USA. 1997;94:11905–11910. doi: 10.1073/pnas.94.22.11905. [DOI] [PMC free article] [PubMed] [Google Scholar]
- 69.Ma J, Karplus M. Ligand-induced conformational changes in ras p21: a normal mode and energy minimization analysis. J Mol Biol. 1997;274:114–131. doi: 10.1006/jmbi.1997.1313. [DOI] [PubMed] [Google Scholar]
- 70.Kobayashi C, Saito S. Relation between the conformational heterogeneity and reaction cycle of Ras: molecular simulation of Ras. Biophys J. 2010;99:3726–3734. doi: 10.1016/j.bpj.2010.09.063. [DOI] [PMC free article] [PubMed] [Google Scholar]
- 71.Prakash P, Gorfe AA. Lessons from computer simulations of Ras proteins in solution and in membrane. Biochim Biophys Acta, Gen Subj. 2013;1830:5211–5218. doi: 10.1016/j.bbagen.2013.07.024. [DOI] [PMC free article] [PubMed] [Google Scholar]
- 72.Villa A, Stock G. What NMR relaxation can tell us about the internal motion of an RNA hairpin: a molecular dynamics simulation study. J Chem Theory Comput. 2006;2:1228–1236. doi: 10.1021/ct600160z. [DOI] [PubMed] [Google Scholar]
- 73.Gu Y, Li DW, Bru_schweiler R. NMR order parameter determination from long molecular dynamics trajectories for objective comparison with experiment. J Chem Theory Comput. 2014;10:2599–2607. doi: 10.1021/ct500181v. [DOI] [PubMed] [Google Scholar]
- 74.Scheffzek K, et al. The Ras-RasGAP Complex: Structural Basis for GTPase Activation and Its Loss in Oncogenic Ras Mutants. Science. 1997;277:333–339. doi: 10.1126/science.277.5324.333. [DOI] [PubMed] [Google Scholar]
- 75.Hall BE, Yang SS, Boriack-Sjodin PA, Kuriyan J, Bar-Sagi D. Structure-based mutagenesis reveals distinct functions for Ras switch 1 and switch 2 in Sos-catalyzed guanine nucleotide exchange. J Biol Chem. 2001;276:27629–27637. doi: 10.1074/jbc.M101727200. [DOI] [PubMed] [Google Scholar]
- 76.Knihtila R, Holzapfel G, Mattos C. Study of Ras catalytic mechanism of intrinsic hydrolysis of GTP. FASEB J. 2013;27:831.10–831.10. [Google Scholar]
- 77.Ma J, Karplus M. Molecular switch in signal transduction: reaction paths of the conformational changes in ras p21. Proc Natl Acad Sci U S A. 1997;94:11905–10. doi: 10.1073/pnas.94.22.11905. [DOI] [PMC free article] [PubMed] [Google Scholar]
- 78.Sayyed-Ahmad A, Cho K-J, Hancock JF, Gorfe AA. Computational Equilibrium Thermodynamic and Kinetic Analysis of K-Ras Dimerization through an Effector Binding Surface Suggests Limited Functional Role. J Phys Chem B. 2016 doi: 10.1021/acs.jpcb.6b02403. [DOI] [PMC free article] [PubMed] [Google Scholar]
- 79.Sun Q, et al. Discovery of small molecules that bind to K-Ras and inhibit Sos-mediated activation. Angew Chem. 2012;124:6244–6247. doi: 10.1002/anie.201201358. [DOI] [PMC free article] [PubMed] [Google Scholar]
- 80.Maurer T, et al. Small-molecule ligands bind to a distinct pocket in Ras and inhibit SOS-mediated nucleotide exchange activity. Proc Natl Acad Sci USA. 2012;109:5299–5304. doi: 10.1073/pnas.1116510109. [DOI] [PMC free article] [PubMed] [Google Scholar]
- 81.Buhrman G, et al. Analysis of binding site hot spots on the surface of Ras GTPase. J Mol Biol. 2011;413:773–789. doi: 10.1016/j.jmb.2011.09.011. [DOI] [PMC free article] [PubMed] [Google Scholar]
- 82.Prakash P, et al. Computational and Biochemical Characterization of Two Partially Overlapping Interfaces and Multiple Weak-Affinity K-Ras Dimers. Sci Rep. 2017;7:40109. doi: 10.1038/srep40109. [DOI] [PMC free article] [PubMed] [Google Scholar]
- 83.Spoerner M, Herrmann C, Vetter IR, Kalbitzer HR, Wittinghofer A. Dynamic properties of the Ras switch I region and its importance for binding to effectors. Proc Natl Acad Sci USA. 2001;98:4944–4949. doi: 10.1073/pnas.081441398. [DOI] [PMC free article] [PubMed] [Google Scholar]
- 84.Spoerner M, et al. Conformational states of Ras complexed with the GTP analogue GppNHp or GppCH2p: implications for the interaction with effector proteins. Biochemistry. 2005;44:2225–36. doi: 10.1021/bi0488000. [DOI] [PubMed] [Google Scholar]
- 85.Matsumoto S, et al. Molecular Mechanism for Conformational Dynamics of Ras.GTP Elucidated from In-Situ Structural Transition in Crystal. Sci Rep. 2016;6:25931. doi: 10.1038/srep25931. [DOI] [PMC free article] [PubMed] [Google Scholar]
- 86.Tong L, de Vos AM, Milburn MV, Kim SH. Crystal structures at 2.2 Å resolution of the catalytic domains of normal ras protein and an oncogenic mutant complexed with GDP. J Mol Biol. 1991;217:503–516. doi: 10.1016/0022-2836(91)90753-s. [DOI] [PubMed] [Google Scholar]
- 87.Araki M, et al. Solution structure of the state 1 conformer of GTP-bound H-Ras protein and distinct dynamic properties between the state 1 and state 2 conformers. J Biol Chem. 2011;286:39644–53. doi: 10.1074/jbc.M111.227074. [DOI] [PMC free article] [PubMed] [Google Scholar]
- 88.Krieger F, Möglich A, Kiefhaber T. Effect of proline and glycine residues on dynamics and barriers of loop formation in polypeptide chains. J Am Chem Soc. 2005;127:3346–3352. doi: 10.1021/ja042798i. [DOI] [PubMed] [Google Scholar]
- 89.Buhrman G, Holzapfel G, Fetics S, Mattos C. Allosteric modulation of Ras positions Q61 for a direct role in catalysis. Proc Natl Acad Sci USA. 2010;107:4931–4936. doi: 10.1073/pnas.0912226107. [DOI] [PMC free article] [PubMed] [Google Scholar]
- 90.O’Connor C, Kovrigin EL. Characterization of the second ion-binding site in the G domain of H-Ras. Biochemistry. 2012;51:9638–9646. doi: 10.1021/bi301304g. [DOI] [PubMed] [Google Scholar]
- 91.Mattos C. Protein–water interactions in a dynamic world. Trends Biochem Sci. 2002;27:203–208. doi: 10.1016/s0968-0004(02)02067-4. [DOI] [PubMed] [Google Scholar]
- 92.Prakash P, Sayyed-Ahmad A, Gorfe AA. The role of conserved waters in conformational transitions of Q61H K-ras. PLoS Comput Biol. 2012;8:e1002394. doi: 10.1371/journal.pcbi.1002394. [DOI] [PMC free article] [PubMed] [Google Scholar]
- 93.Denisov VP, Halle B. Protein hydration dynamics in aqueous solution. Faraday Discuss. 1996;103:227–244. doi: 10.1039/fd9960300227. [DOI] [PubMed] [Google Scholar]
- 94.Kearney BM, Johnson CW, Roberts DM, Swartz P, Mattos C. DRoP: a water analysis program identifies Ras-GTP-specific pathway of communication between membrane-interacting regions and the active site. J Mol Biol. 2014;426:611–29. doi: 10.1016/j.jmb.2013.10.036. [DOI] [PubMed] [Google Scholar]
Associated Data
This section collects any data citations, data availability statements, or supplementary materials included in this article.