

Summary
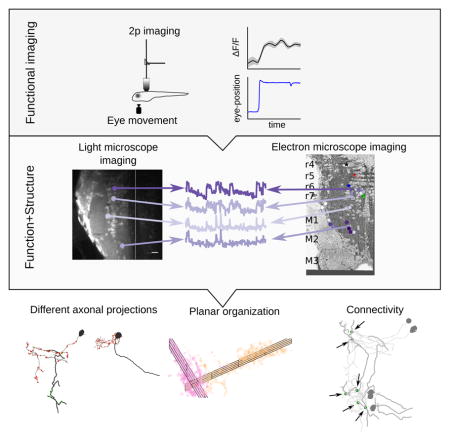
Neural integrators are involved in a variety of sensorimotor and cognitive behaviors. The oculomotor system contains a simple example, a hindbrain neural circuit that takes velocity signals as inputs, and temporally integrates them to control eye position. Here we investigated the structural underpinnings of temporal integration in the larval zebrafish by first identifying integrator neurons using two-photon calcium imaging and then reconstructing the same neurons through serial electron microscopic analysis. Integrator neurons were identified as those neurons with activities highly correlated with eye position during spontaneous eye movements. Three morphological classes of neurons were observed: ipsilaterally projecting neurons located medially, contralaterally projecting neurons located more laterally, and a population at the extreme lateral edge of the hindbrain for which we were not able to identify axons. Based on their somatic locations, we inferred that neurons with only ipsilaterally projecting axons are glutamatergic, whereas neurons with only contralaterally projecting axons are largely GABAergic. Dendritic and synaptic organization of the ipsilaterally projecting neurons suggest a broad sampling from inputs on the ipsilateral side. We also observed the first conclusive evidence of synapses between integrator neurons, which have long been hypothesized by recurrent network models of integration via positive feedback.
eTOC blurb
Vishwanathan et. al combined two-photon calcium imaging and serial section electron microscopy in the larval zebrafish to reconstruct neurons in the oculomotor integrator. They observed three classes of neurons and evidence of synaptic connections between these classes.
Introduction
Combining two-photon calcium imaging with serial electron microscopy (EM) is an emerging approach for studying the structure and function of neural circuits at cellular resolution. In the mouse retina [1] and primary visual cortex [2, 3], this approach has been used to study the structure and function of visual neurons. Here we apply this approach to a population of neurons defined by their encoding of behavioral variables, rather than stimulus variables. Namely, we focus on neurons that carry a horizontal eye position signals that are located in a hindbrain neural circuit known as the “horizontal velocity-to-position neural integrator,” or “neural integrator” for short [4, 5]. Our study is done in the larval zebrafish, which has emerged as an important model organism for investigating the relation between neural circuits and behavior [6].
The neural integrator gets its name because the transformation of eye velocity into eye position is the computational operation of integration with respect to time. Integrator neurons carry a horizontal eye position signal in their spiking during fixations, and lesion or inactivation of these cells lead to pronounced deficits in the ability to maintain gaze fixation [7, 8, 9]. Integrator neurons are thought to send their eye position signals to extraocular motor neurons through monosynaptic and polysynaptic pathways [10, 11, 12]. They are also thought to receive inputs from multiple convergent pathways that encode eye velocity for every type of eye movement [13, 14]. Therefore, the neural integrator is the “final common pathway” for all types of eye movements in fish [15, 16, 17], rodents [18], non-human primates [19, 20], and humans [21].
Most investigations of the structural underpinnings of neural integration in the oculomotor system have relied on combining single-neuron electrophysiology with light-microscopic dye fills. Intracellular recordings in goldfish hindbrain neurons that exhibited spiking correlated to eye position, followed by anatomical dye fills, show the axons of these neurons send collaterals to areas where other integrator neurons were observed [16]. Similar anatomical observations have been observed in cats [22] and nonhuman primates [23]. These observations have shaped theoretical models to propose that integration can be supported by positive feedback between these neurons [24, 25, 26, 27, 28]. More recently, calcium imaging approaches using two-photon microscopy to identify many integrator neurons have been coupled with sparse, targeted single neuron electroporation of fluorescent indicators for anatomical reconstruction [29]. All these studies have delineated the arborization and projection patterns of integrator neurons, but were limited to one or a few neurons in any individual brain and do not reveal locations and the distributions of their input and output synapses. Furthermore, although the axonal projections could indicate the presence of synapses onto dendrites of other integrator neurons, conclusive evidence has been lacking.
We combined two-photon calcium imaging and serial electron microscopy to determine both function and structure of neurons throughout the oculomotor neural integrator. We found evidence for multiple classes of neurons within the integrator population based on differences in dendritic arborization, axonal projections and synaptic distributions. These included neurons at medial locations with ipsilaterally projecting axons that were inferred to be excitatory, and neurons at more lateral locations with contralaterally projecting axons that were inferred to be inhibitory. Furthermore, we identified the locations of all chemical synapses onto and from the imaged integrator population, and inferred from ultrastructural properties of vesicles that these synapses were of the conventional rather than peptidergic variety. Finally, we report evidence for direct synaptic connectivity between integrator neurons.
Results
Combined two-photon and electron microscopy of integrator neurons
To identify integrator neurons, we performed two-photon light microscopy (LM) imaging of the caudal hindbrain in a 6 (days post fertilization – dpf) larval zebrafish following bolus loading of the calcium sensor Oregon Green BAPTA 1-AM. The functional imaging was restricted to one side where the loading was best and was performed on three planes that were ~ 8μm apart during spontaneous eye movement. Calcium signals were correlated with eye position to identify integrator somata from the imaged planes (Figure. 1A) [30]. Neurons were identified as integrator neurons if saccade-triggered eye position following an ipsiversive saccade (Figure. 1A, b arrow) was correlated with saccade-triggered average fluorescence (Figure. 1A, c first column) (Pearson coefficient r > 0.6). The integration time constants or the level of persistence was quantified as the time constant of an exponential fit to the firing rate profile determined from a deconvolution of the fluorescence data (Figure. 1A, c, dotted line, STAR methods). This resulted in the identification of 22 integrator neurons with graded levels of persistence (Figure. S1 A, B, C).
Figure 1. Functional and structural imaging of integrator neurons.

(A) (a) Top - Larval zebrafish schematic showing the region where functional imaging was performed (black box) located in the hindbrain.
Bottom - A single imaging plane showing neurons loaded with calcium indicator OGB-1. Identified integrator neurons are show in colored circles. Colors reflect the level of persistence of the neuron. Scale bar = 20μm
(b) Spontaneous eye movement (top, blue line) showing saccades (sharp vertical lines) and post-saccadic fixations (horizontal lines). Ipsilateral saccades are indicated by black arrows. Colored traces below are the changes in fluorescence from individual neurons in (a). Colors represent the persistence level of the neuron. Since integrator neurons have eye position thresholds, not all cells (green) fire throughout the eye position range observed here.
(c) Normalized fluorescence and firing rate of neurons in (a). Thick line shows the average, with shaded region showing the SEM. Dotted line is the exponential fit to determine persistence time constant, represented as log2(τ).
(B) (Top) Serial-sections for electron microscopy were collected on a tape in an automated manner. (Bottom left) Overview image of single section. The region-of-interest that corresponds to the functionally imaged area was defined by black box for high-resolution imaging. (Bottom right) All such images were aligned to generate a 3D EM volume.
(C) Registration of light microscopic volume to electron microscopic volume is used to locate the neurons that were involved in the behavior. Red arrows indicate the same features in both LM and EM. Scale bar = 20μm
(D) An example EM plane showing anatomical landmarks, Mauthner neuron (black star), Mi2 (red stars), Mi3 (blue stars) and Ca (green stars). Anatomical locations of all identified integrator neurons (colored circles) and all remaining cell bodies in the imaged EM volume (‘○’ symbol). Colors of the integrator neurons correspond to the persistence time of the neuron. Lower panel is a distribution of all neurons along the ML axis with integrator neurons overlaid. Dotted lines (cyan) are the identified somata stripes S1–3.
See also Figure. S1.
Following functional identification of integrator neurons, the tissue was fixed, stained, sectioned for serial electron microscopy and imaged at a final resolution of 5×5×45 nm (RC, ML, DV). These images were montaged and aligned to create a 3D electron microscopy volume (EM) (Figure. 1B and STAR methods). The resulting EM volume extended ventrally from the Mauthner cell axon plane by ~ 60μm, caudally from the border of rhombomere 5/6 by ~ 200μm and laterally from the midline by ~ 100μm. The LM and EM volumes were registered to each other by an affine transform, producing correspondence of labeled neurons and blood vessels (Figure. 1C, Figure. S1 D, Methods). The somata of all 22 integrator neurons from the LM volume were located in the EM volume, distributed throughout the caudal hindbrain and along the border between rhombomeres 6 and 7 (Figure. 1D, colored by time constants).
Stripe shaped patterning of somata in the hindbrain
Cell bodies in the hindbrain of the larval zebrafish follow a stereotypic stripe-like pattern of alternating cell bodies and neuropil. Cells within the same stripe typically share the same neurotransmitter identity, and morphology [31, 32, 33]. To extract this stripe-like organization, we projected the locations of all cell somata (Figure. 1D, ‘○’ symbol) from the high-resolution imaged area onto a single plane. The high-resolution EM volume contained a total of 2967 somata spread over rhombomeres 5 through 8 (Figure. 1D). The volume also contained well-known landmarks like the Mauthner neuron [34], the axon of the contralateral Mauthner neuron, neurons MiD2 and MiD3 of the reticulo-spinal network [34], and a number of commissural bundles (Figure. 1D). This procedure revealed an alternating pattern of cell somata and neuropil. We were able to locate 3 peaks of cell somata, excluding a peak that corresponds to neurons at the midline, each corresponding to a likely stripe (Figure. 1D, bottom panel, S1–3). The three stripes were labeled based on their proximity to the midline, as medial (S1), intermediate (S2) and lateral stripe (S3) respectively. The medial most stripe S1 aligns with a group of neurons that express the alx transcription factor and are predominantly glutamatergic [35, 32, 29]. The intermediate stripe S2 corresponds to neurons known to express the transcription factor dbx1b [32]. At the ventral locations explored here, integrator neurons in this stripe are almost exclusively GABAergic, while a small minority express glutamate[29] (more dorsally, this stripe is medially abutted by cells that express the engrailed-1 transcription factor which expresses glycine [35, 32]). The lateral most peak S3 of neurons corresponds with the expression of the barhl transcription factor, which is also thought to be glutamatergic [36, 32].
Anatomical properties of integrator neurons
After the identification of the integrator neurons in the EM volume, we reconstructed all 22 integrator neurons and annotated the pre- and postsynaptic locations for these neurons (STAR methods). We first describe some of the anatomical properties that were common to all integrator neurons.
Somata
The somatic locations of the 22 integrator neurons were distributed over ~23μm in the dorso-ventral (DV) axis and along the entire rostro-caudal (RC) extent of the imaged volume. The somata of integrator neurons associated with S1 were located very close to the midline and close the rostral edge of the imaged volume, close to the border between rhombomeres 6 and 7. Somata associated with S2 were distributed along the entire RC extent of the imaged volume. Finally, somata associated with S3 were located at the lateral end of the volume in rhombomere 8. The diameters of the integrator neurons were normally distributed, with a mean of 4.5±0.6μm (mean ± standard deviation). In general, the size of the somata was proportional to the persistence level of the neurons, with larger neurons exhibiting higher degree of persistence (Figure. S1 B (right), r = 0.4, p= 0.059). On average 3.3±1.5 neurites emerged from the somata, and traveled ventrally.
Synapses
We annotated 320 presynaptic (green circles, Figure. 2) and 2195 postsynaptic sites (red circles, Figure. 2) on the 22 integrator neurons. Synapses were identified by the presence of a presynaptic vesicle pool and adjacent synaptic density. The synaptic density was mainly confined to the cleft. It extended into the intracellular space diffusely on the presynaptic side, and very little on the postsynaptic side (Figure. S2 E). Synapses from or onto integrator neurons contained small vesicles, presumably containing a conventional neurotransmitter. Elsewhere in the volume we did identify synapses with dense core vesicles, presumably containing a peptide neurotransmitter (Figure. S2 A). The conventional distinction between symmetric and asymmetric synapses did not seem relevant. Symmetric synapses are associated with many flat vesicles, but flat vesicles were uncommon at all synapses in our dataset. Asymmetric synapses exhibit a strong postsynaptic density, which was not observed here (Figure. S2 E).
Figure 2. Ultrastructural features of Integrator neurons.

(A) Integrator neuron with ipsilaterally projecting axon (dark line) with presynaptic (green circles) and dendrites (light lines) with postsynaptic (red circles) locations. Parts of the axon of this integrator neuron are loosely-myelinated (yellow circle). Insets shows axons with loose myelin (colored), arrows showing individual myelin sheaths. Open arrow head shows the location of axon initiation.
(B) Integrator neuron with ipsilateral projecting axon. Axon is studded with presynaptic sites that are clustered along neurite. Inset is a 3D reconstruction of axon termination zone with a large vesicle cloud (blue) with multiple synaptic densities (yellow) opposed to the vesicles. Numbers correspond to EM insets showing the synapses. M - Mitochondria, V - Vesicles. Arrows show the synapses at those locations.
(C) Integrator neuron with contralateral projecting axon. Putative contralateral axon emerges from somata and is engulfed by glial before crossing the midline (EM insets at numbered locations G - Glia, A - Axon). Open arrowhead shows the axon initiation site.
(D) Integrator neurons with only contralaterally projecting axon. Putative axon is engulfed by glia before crossing the midline (EM insets at numbered locations G - Glia, A - Axon). Bottom EM panel shows primary cilium highlighted with yellow arrow. All the integrator somata in this volume give rise to a cilium, but it is shown for this neuron.
See also Figure. S2.
Integrator presynaptic sites
The presynaptic site was generally at a varicosity in the axon with vesicles throughout. A small, denser cluster of vesicles was typically observed immediately adjacent to the synaptic density. These features are consistent with the idea of a presynaptic active zone. The number of presynaptic sites on a neuron averaged 57.6±45.3. This is an underestimate of the number of output synapses from an integrator neuron, because all axonal arbors were cut off by the borders of the volume. If statistics are restricted to the 3 longest neurons that were more complete than others, there were 82±49.3 presynaptic sites.
Integrator postsynaptic sites
The number of postsynaptic sites on a neuron averaged 99.7±72.4. This is a reasonable estimate of the number of input synapses to an integrator neuron, because most dendritic arbors were reconstructed in their entirety.
Cell Junctions
Along the somatic membrane, a darkening of the membrane interrupted by small gaps was often observed (Figure. S2 B). The darkening persisted over multiple serial sections, suggesting that it was not an artifact of tissue preparation or imaging. These darkenings were visible between somata of integrator-integrator and integrator-non-integrator neurons. We speculate that these darkenings are some kind of cell junction. Due to limited image resolution, we cannot ascertain whether these are gap junctions, which are known to exist in the developing larval zebrafish hindbrain [37].
Dendrites
Dendrites were defined by the absence of presynaptic vesicles and the presence of synaptic densities. They typically extended from somata in the ventral direction. Dendrites were smooth rather than spiny. Some dendrites exited the imaged volume, leading to incompletely reconstructed neurons. Neurons with small dendritic arbors were completely reconstructed and did not have any dendrites that exited the imaged volume.
Axons
Neurites with presynaptic vesicles were identified as axons. Regions of transition, from dendrite to axon, we termed axon initiation sites. Example axon initiation sites are indicated in Figure. 2, showing the dendrite (neurite with red postsynaptic sites) turning into axons at the axon initiation (open arrow). The main trunk of the axon extended rostrally and ventrally (Figure. 2A, B). From the main trunk emerged medio-lateral (ML) branches, which we will term collaterals (the number of collaterals we observed were similar to numbers with light microscopy, unpublished).
We observed sheaths around some axonal segments. In some locations, we saw that the sheath wrapped around the axon a few times, loosely enough that cytoplasmic space was visible (Figure. 2A, EM panel). This fit the description of loose myelin [38], which differs from the more electron-dense compact myelin (elsewhere in the volume, data not shown). The axon of the neuron in Figure. 2A was intermittently loosely myelinated along its RC section. Collaterals emerged along the ML axis from the gaps in loose myelin, and remained unmyelinated. Such loose myelin sheaths have been previously reported in goldfish [39].
For 10/22 (45%) integrator neurons, neurites that cross the midline were identified as putative axons using several criteria. First, the putative axons were devoid of any postsynaptic sites on the ipsilateral side (Figure. 2B, D open arrow to end, no synapses). Second, before crossing the midline, the putative axon became engulfed by processes that appeared glial in nature (Figure. 2C, D, EM inset, label G). The glial engulfment is consistent with the idea of “glial bridges” that are instrumental in the guidance of axons during development [40]. Third, these putative axons were thinner than the remaining neurites of the neuron. The diameter of these putative axons were smaller to the other neurites and were similar to the diameters of conventional axons (Figure. 3F). The mean axonal diameter was less than the mean dendrite diameter, conforming to the textbook notion that axons are thinner than dendrites. Putative axons could not be conclusively identified as axons because their presynaptic sites were presumably on the contralateral side of the brain, which was not included in the imaged volume.
Figure 3. Integrator neuron projection patterns and synaptic distribution.

(A) Colored panels show three views of reconstructed integrator neurons, grouped according to their axonal projection patterns. Left, 6 integrator neuron with ipsilateral projecting axons - ipsi-only group, pink background. Middle, 9 integrator neurons with midline crossing contralaterally projecting putative-axon – contra-only, orange background. Right, 6, integrator neurons with unknown axonal projection – unknown, blue background. Axons - dark line, dendrites - light lines, red circles - postsynaptic sites, green circles - presynaptic sites.
(B) Box plot of the number of synapses in each group (Ipsi-only, Contra-only and unknown, L to R). Black line is the median (p = 0.004, Wilcoxon rank-sum test).
(C) Box plot of the Synaptic density for each group. Black lines are the medians.
(D) Normalized distribution of the synaptic pathlength. Red - postsynaptic sites, green - presynaptic sites. Colored vertical lines, with adjoining numbers represent the means of the distribution.
(E) Box plots of the intersynaptic path length for all four groups. Open circles are outliers, not shown beyond 10μm..
(F) Axonal and dendritic diameter of all neurons in each of the four groups. Grey dots are averages for each neuron and black dots are averages per group. A - Axon, D - Dendrite.
See also Figure. S3.
Small protuberances
A small fraction (~4% or 91/2195) of the postsynaptic sites were located on finger-like projections from dendrites that were enveloped by invaginations of axonal boutons (Figure. 2B, EM panel 2). These projections resemble structures found across multiple species called spinules, and are thought to be present on large, active synapses [41]
We also observed a primary cilium on all 22 integrator neurons. Primary cilium are known to be present in most, if not all mammalian cells, including neurons, and are though to be important for normal development [42]. The average cilium was typically ~ 4μm, is enriched with microtubules, and emerges from the neuron somata very close to the Golgi complex. In some cases, this primary cilium terminated inside processes that appeared glial (Sup. Figure. 2C). There was no strong orientation preference in cilia distribution (Sup. Figure. 2D).
Axonal projection patterns of integrator neurons
The reconstructed integrator neurons were then divided into three groups based on the spatial projection patterns of the axons that were identified. Below we have detailed the properties of integrator neurons from each of these groups.
Ipsilateral projection only (“ipsi-only”)
Six neurons located at the rostral edge of the volume, were observed to have only ipsilaterally projecting axons (Figure. 3A). Two representatives are shown in Figs. 2A and B. The axons were clearly identified by the presence of en-passant boutons with presynaptic vesicles. The somata were located at the rostral extent of the volume, close to the midline (Figure. 3A, Ipsi-only). The axons were oriented along the RC axis with the rostral end more ventral as compared to the caudal end. The average length of axons was ~ 260μm (see also, Table S1) with the longest reconstructed axon being 463μm. Axons at the rostral extreme of the volume appeared to overlap with the expected location of the abducens motor nucleus (based on its known position within rhombomere r5, 6 Figure. S3 A), with terminations in r4 as well. Two of the six axons had projections that terminate near the site of the abducens motor nuclei and project further rostrally (Figure. S3 B). None of the axons were observed emerging directly from the somata. Instead, dendrites bearing postsynaptic sites turned into axons with presynaptic sites, with the axon initiation site was on average located ~ 99μm from the somata. Finally, all but one of the somatas were located medial to stripe S1.
Neurons in this group had large dendritic arbors, with the dendrites arborizing over 22.5% of the total imaged volume (Figure. S4 A, B, C). The dendrites emerged laterally from somata and always extended ventrally. Only in one case the dendrites were observed to cross the midline, as indicated by the presence of postsynaptic sites confirming it as a dendrite (Figure. 3A, Ipsi. only, arrowheads). The average diameter of dendrites was significantly larger as compared to the diameter of the axons (Figure. 3F, p < 2×10⁻³, t-test).
Contralateral projection only (“contra-only”)
Nine neurons distributed over the full RC extent, with the majority located at the caudal end of the imaged volume contained exclusively contralaterally projecting putative axons (Figure. 3A, Contra only). Like the axons in the ipsi-only group, the putative contralateral axons did not emerge as axons, but started as a neurite with postsynaptic sites, that became axonal. However, unlike the ipsi-only group, the axon initiation site was much closer to the somata. On average, the axon initiation site was located ~ 22μm from the somata, which is significantly shorter than the axon initiation site for the ipsi-only group (p < 0.0003, t-test). The somata of these neurons were located close to stripe S2.
The average dendritic length was ~ 290μm (see also, Table S1), and the dendritic arbors of these neurons arborized over 8% of the total volume (Figure. S4 A, B, C). This was significantly smaller than the dendritic arbors of ipsi-only group (p < 0.01, t-test). The average diameter of dendrites significantly larger than the diameter of the axons (Figure. 3F, p < 2×10⁻⁶, t-test). The diameter of dendrites of the contra-only neurons was significantly smaller to the ipsi-only group (Figure. 3F, p < 0.005, t-test).
Projection unknown (“unknown”)
Seven neurons were located at the lateral most extent of the animal. For these neurons we did not find any neurites with presynaptic sites nor could we locate a putative axon (Figure. 3A, Unknown). We believe this is most likely because these neurons were not fully represented in the imaged volume and neurites of these neurons exit the volume before the axon was located. The average length of the dendrites for neurons from this group was ~ 220μm (see also, Table S1), and they occupied on average ~4.9% of the total volume (Figure. S4 A, B, C).
Finally, one neuron had axons with both ipsilateral and contralateral projections (Figure. S4 D). This integrator neuron was located more lateral to the neurons from ipsi-only group. The ipsilaterally projecting axon resembled the axons of the ipsi-only group of neurons (Figure. 3A), with similar tilt in the RC axis. This neuron contained a neurite that crossed the midline. We infer that this neurite is a putative contralaterally projecting axon based on the same cues that we use to identify other putative axons.
Organization of integrator neuron synapses
Neurons from these three groups had on average, 170, 84 and 40 postsynaptic (inputs) sites on their dendrites respectively (Figure. 3B, red). The axons from the ipsi-only groups had approximately 58 presynaptic (output) sites (Figure. 3B, green). The pathlength of each synaptic location from the somata revealed that the distribution of the postsynaptic sites along the dendrites among the Ipsi-only group was significantly different compared to the the contra-only and the unknown groups respectively (Figure. 3D, p = 7.2×10⁻¹³, p = 1.2×10⁻¹⁰ KS test).
We further computed the synaptic density, the number of synapses per unit length for all neurons, with the assumption that the synapses within each group were uniformly distributed along dendrites. The uniformity assumption was made because the distributions of the locations of postsynaptic sites was found to closely match the location of dendritic arbors (Figure. S4 E). We found the there were ~1.5X more input synapses on the ipsi-only group of neurons, as compared to the inputs on the contra-only group of neurons (ipsi-only group median number 0.42 inputs per micron, contra-only group 0.26 input per micron, Figure. 3C, p = 0.049, Wilcoxon-rank test). Empirically the average intersynaptic distance for the ipsi-only, contra-only and unknown groups of neurons are 1±2.3μm and 1.2±1.6μm and 2.6±4.5μm with significantly different medians (Figure. 3E, p = 1.2×10⁻¹⁰, p = 1.1×10⁻¹⁸, p = 5.2×10⁻¹⁰, Wilcoxon-rank test).
Planar organization of synaptic locations
The postsynaptic sites of the neurons from the ipsi-only and contra-only groups were observed to lie along orthogonal planes. The postsynaptic sites onto neurons from the ipsi-only group were noticed to lie roughly along a coronal plane with some tilt (Figure. 3A). Similarly, the postsynaptic sites onto neurons from the contra-only neurons were noticed to exhibit some planar organization as well. Fitting a plane through all the postsynaptic sites revealed that these planes were nearly orthogonal (82.4°) to each other (Figure. 4A).
Figure 4. Integrator neurons organization and connectivity.

(A) Planar organization of ipsi (pink) and contra (orange) projecting neurons postsynaptic sites. Grid represents the best fit plane through the cloud of points for each group. Anatomical landmarks, Mauthner neuron (black star), Mi2 (red stars), Mi3 (blue stars) and Ca (green stars). Black dotted line is the border between rhombomere r6 and 7.
(B) (Top) Stratification profile of all ipsi-only group of neurons. Two side views show the stratification of the dendrites, presynaptic and postsynaptic sites along the DV and ML axis. Dotted line represent the location of the somatic peaks that was computed in Figure 1.
(Bottom) Stratification profile of all contra-only group of neurons.
(C) Three views of synaptically connected integrator neurons. Synapses from the ipsi-only group onto another neuron from ipsi-only group are in top left (black circles) and from the ipsi-only group onto contra-only neurons are at bottom right. Black arrows represent the location of the synapses, with insets showing the electron micrograph at two representative locations, colors in the inset are representative of the cells to which the synapses belong.
See also Figure. S4.
The dendritic arbors and postsynaptic sites of neurons in these two groups displayed an inversion in the stratification depths. The dendritic arbors of the ipsi-only neurons on average were most abundant at 41.66±9.3μm ventral to its somata (Figure. 4B, top - pink line). Whereas the contra-only group was maximal around 21.1±6.9μm ventral to its somata (Figure. 4B, bottom - orange line). The number of postsynaptic sites closely followed this inversion. Although relative to the bottom of the cranium, because many of the contra-only cells are more caudal and the brain is shallower, the depth profile may not be that different when viewed from a different origin.
Interestingly, when we overlaid the stripe patterns computed previously in Figure. 1D with the stratification profiles of the synaptic sites along the ML axis, we found that the post and presynaptic sites of the ipsi-only group was located medial to stripe S1 and lateral to S2, whereas the postsynaptic sites of the contra-only group were located very close the intermediate stripe S2. Similar organization was observed for the other group of neurons (Figure. S4 F).
Connectivity between integrator neurons
We also examined the patterns of connectivity between integrator neurons. We found 6 synapses between integrator neurons. Two synapses made by one ipsi-only neuron onto another ipsi-only neuron, and 4 synapses onto three contra-only neurons (Figure. 4C). We found that there exists varying amounts of overlap of the axons of the ipsilaterally projecting neurons (Figure. S4 H) with the dendrites of all other neurons in the volume. Specifically, the overlap at ventro-rostral locations were from axons of ipsi-only neurons onto dendrites of other ipsi-only neurons (Figure. S4 H, Ipsi–>Ipsi). Whereas, the overlap at dorso-caudal locations were from axons of ipsi-only neurons onto dendrites of contra-only and unknown group of neurons (Figure. S4 H, Ipsi–>Contra, Ipsi->unknown).
Discussion
We combined two-photon calcium imaging of neurons in the larval zebrafish that were encoding for a behavioral variable (eye-position) with serial section electron microscopy. This was done by registering the light microscopic volume to the electron microscopic volume to locate the same neurons. We were able to analyze in one animal 22 integrator neurons for which we had both functional and structural information. This procedure revealed the existence of distinct groups of neurons that make up the integrator circuit. This included an excitatory, ipsilaterally projecting group, an inhibitory, contralaterally projecting group and, a third, excitatory group with unknown projections. Finally, we provide the first conclusive evidence for synapses between integrator neurons.
Of the 22 integrator neurons, six had exclusively ipsilaterally projecting axons. This population was most closely associated with the first somata stripe S1, which is thought to contain mostly excitatory, glutamatergic neurons [29]. The majority of synapses onto the dendrites of these neurons were along a plane approximately normal to the RC axis, whereas the axonal boutons of these neurons were oriented along the RC axis. This is reflected in the approximately orthogonal organization of the pre and postsynaptic sites onto these neurons (Figure. S4 G). This suggests that these neurons are setup to sample broadly from axons that are oriented along the RC axis, including those from other integrator neurons. It has long been theorized that positive feedback via recurrent excitation could be a possible mechanism that can explain long persistent time scales of neuronal activity [26, 27, 43]. Indeed, we observed conclusive chemical synapses from one ipsilaterally projecting integrator neuron onto another ipsilaterally projecting integrator neuron. These facts point to the ipsi group of neurons as a candidate that could support positive feedback over recurrent excitation in the integrator circuit.
The second major group of neurons that we reconstructed were the nine contralaterally projecting neurons. The somatic locations of these neurons was most closely associated with the intermediate somal stripe S2, a grouping composed largely of GABAergic neurons at the DV depth investigated here [29]. The dendrites of these neurons arborized over a smaller area, and stratified more dorsally as compared to the ipsilaterally projecting group of neurons. The postsynaptic inputs on the dendrites of these cells were along a plane that contained the RC axis. This suggests that these neurons sample narrowly from inputs along the RC axis. Inputs along the ML axis, however, would be sampled more broadly by these neurons. In the goldfish oculomotor integrator, contralaterally projecting neurons are thought to be involved in coordinating activity between the two sides, where each side acts as an independent integrator [9, 44]. Although, we have not reconstructed the contralateral side of the axons, evidence from light microscopic images of contralaterally projecting neurons shows projections that terminate in the dendritic field of the opposing population of inhibitory integrator neurons [29].
The majority of the remaining integrator neurons were located at the lateral edge of the animal corresponding to the lateral most stripe S3, where neurons are predominantly glutamatergic [32]. Since these neurons are close to the edge of the imaged volume, in all cases, we were unable to trace many neurites from these cells; hence, the axonal projection pattern remains unknown. We also found one neuron, located along stripe S2, that had both an ipsilateral axon and contralaterally projecting putative axon. The potential role of these neurons remains unknown.
The ipsilaterally projecting and the contralaterally projecting neurons differ in a number of properties. They have significantly different dendritic morphologies, axonal projections, and distributions of postsynaptic sites along their dendrites. The ipsi-only group of neurons had approximately twice as many postsynaptic input sites as the contra-only only group. In both cases, initiation of the axons was from a neurite that contained postsynaptic sites that then gave rise to presynaptic sites. This feature could be important to influence the activity of neurons as these locations are proximal to the somata. For example, inhibitory synapses at such locations could have a shunting effect on the postsynaptic neuron. The integration time constants of these neurons show graded levels of persistent activity. Time constants of contralaterally projecting neurons were significantly different from the unknown projecting neurons, with the unknown projecting neurons showing faster dynamics (Figure. S1 D).
Our sample of 22 reconstructed integrator neurons is a fraction of the roughly 100 integrator neurons estimated to exist on one side of the goldfish brain [45]. We observed 6 chemical synapses from two ipsilaterally projecting integrator neurons onto other integrator neurons. This observation may be an underestimate of integrator connectivity, for a few reasons. First, there are many neurons in the imaged volume that carried no usable fluorescence signal at all, largely because they did not take up enough calcium indicator. Some of these neurons are likely to be integrator neurons overlooked by our study, and are potential postsynaptic partners of the reconstructed neurons in our sample. Second, the imaged volume was limited in the DV extent. Thus there were likely integrator neurons outside the imaged volume, and they could receive synapses from our reconstructed integrator neurons. Furthermore, only three axonal arbors were fully or mostly reconstructed; the rest appeared substantially cut off as their axons left the volume, this is also evidenced by the fact that only two of the six ipsilaterally projecting axons project to the abducens motor nuclei, contrary to dye fill experiments, where all ipsilateral axons project to the abducens. Third, we had no possibility of finding connections between neurons on opposite sides of the brain, because only one side of the brain was imaged. Therefore, it is difficult to know whether the two neurons that made synapses onto other integrator neurons are an exceptional case, or representative of a larger population that was incompletely sampled.
Here we presented ultrastructural anatomical details of different types of integrator neurons and evidence of synaptic connectivity between these neurons and present an approach that can be used to uncover general rules of connectivity and validate hypothesized theories of temporal integration. More definitive information about precise connectivity patterns between integrator neurons awaits a future experiment with an imaged volume that is large enough to encompass all integrator neurons, and a fluorescent calcium indicator that labels a higher percentage of integrator neurons. Nonetheless, our findings to date can already be used to guide models of temporal integration with constraints in the form, density, and geometry of interactions between integrator neurons.
Star Methods Text
Contact for reagent and resource sharing
For further information regarding the any resources and reagents please contact ashwinv@princeton.edu.
Experimental model and subject details
All zebrafish larvae experimental procedures were approved by Weill Cornell Medical College’s Institutional Animal Care and Use Committee. We used nacre mutant zebrafish larva, 6 days of age for all experiments.
Method details
Two-photon calcium imaging
A nacre mutant zebrafish larva, 6 days of age, was anesthetized in 100 mg/L tricaine-methanesulfonate (MS222, VWR TCT0941- 025G) for about 1 minute and then quickly mounted dorsal side up with droplets of 1.7% low temperature agarose (Sigma A0701-100G) on the lid of a 35mm petri dish containing a bed of hardened 1% agarose (Invitrogen 15510-027). The larva was then covered in 50 mg/L MS222. The larva was bulk-loaded [46, 47] with calcium sensitive dye Oregon Green 488 BAPTA-1 AM (5 mM, in DMSO with 5% pluronic, Invitrogen, O-6807) by inserting a capillary through the dorsal skin surface over the lateral edge of the right side of the hindbrain just caudal to the cerebellum, at ~30° decline relative to the dorsal surface. Following recovery, hindbrain of the animal was imaged at 790nm on predefined planes at 1 Hz. The imaging was performed unilaterally on three pre-defined planes ~ 8μm apart, below the level of the Mauthner neuron.
The integrator neurons were identified in a manner similar to a previously described method [48, 49]. Briefly, correlations for every pixel over a 5 min acquisition period was determined for eye position and eye velocity. A region-of-Interest (ROI) was then drawn over the pixels where the majority were correlated to one of these variables. The fluorescence was reported as change in fluorescence for each frame relative to the average fluorescence, divided by the average. Saccadic fluorescence traces were displayed over an 8 sec window starting 1 sec before the end of the saccade. The firing rates were computed over a 6 second fixation period beginning 1 sec after the end of the saccade. The firing rates were computed by deconvolving the average fluorescent traces with a calcium impulse response function (CIRF) as described previously [30]. The integrator time constants were calculated by fitting an exponential function (Matlab ezfit) to to the firing rates. The time constants for the fits were capped at 100 sec.
Serial section electron microscopy
The animal was immersed in a fixative mixture of 2% paraformaldehyde and 2.25% glutaraldehyde buffered in 65 mM cacodylate buffer. The skin over the hindbrain was removed for good ultrastructure preservation and homogeneous staining of the tissue. Then it was thoroughly washed in 0.1M cacodylate buffer with 4% sucrose before staining. The tissue was stained using a conventional ROTO procedure [50]. Briefly, the specimen was stained in 1% reduced osmium tetroxide with potassium ferrocyanide for 2 hr on ice. The tissue was then washed 4x 30 min in 0.1M cacodylate buffer, also on ice. This was then followed by amplification in 1% sodium thiocarbohydroazide (TCH) for 15 min followed by 3×5 min washes in water and another round of incubation in 1% osmium tetroxide for 1 hr. The tissue was then washed 3×15 min in water and incubated with 1% aqueous uranyl acetate overnight. The following day the tissue was washed 3×15 min in water and incubated for 30 min in Lead aspartate solution, followed by washing and dehydration with a series of ethanol washes, followed by propylene oxide (PO) washes. The tissue was then infiltrated in decreasing gradients of PO and EPON for 24 hrs and baked for 48 hrs at 60 C. Following hardening, the tissue block face was coarsely trimmed and a rectangular mesa was defined for serial sectioning. Care was taken to orient the specimen to permit sectioning along the horizontal axis. Serial sections from the above animal were collected approximately from the level of the Mauthner axon at a thickness of 45 nm. The serial sections were then adhered to a silicon wafer, using double sided carbon tape (TEDpella), the wafers were coated with a thin film of carbon to make them conductive. The serial sections were collected using the automatic tape-collecting ultramicrotome (ATUM) [51, 52]. Each wafer was imaged in a Zeiss Sigma field emitting scanning electron microscope in the backscattered electron mode using a custom software interface to collected the images [51]. For the high-resolution each section was imaged at a lateral resolution of 5nm/pixel in a region of interest that roughly corresponded with the area imaged on the light microscopic. The EM volume we imaged contained 15791 image tiles (8000×8000 pixels each) or ~ 1011 pixels. The imaged volume was 220×112×57μm3 (RC X ML X DV).
Registration of light microscope and electron microscope volumes
The EM images were aligned using the TrakEM2 plugin in Fiji [53]. Briefly, individual images were imported into the TrakEM2 framework and montaged using affine and elastic transforms. The images were then registered in z using a similar approach, where the first pass was performed using affine transforms, followed by elastic transforms. All the alignment was performed on a machine with 32 virtual cores and 120GB RAM.
To locate the cells that were involved in the integrator circuit, we first made use of the fact that gross morphological features including blood vessels and the mauthner axon were easily identified in both the LM and EM stacks. Once enough such features were identified in the LM stack, interpolated at EM step sizes, we located these same landmarks in the high-res EM stack. Each pair of landmarks (one from the LM volume and one from the EM volume) was then used to calculate a global affine transform that was applied to transform the LM volume to be overlaid on the EM volume using the TrakEM2 plugin in Fiji [53]. Following this first round of registration, we then identified 7 cells at different locations throughout the volume that were easily identified in both data sets and performed a second round of alignment.
Reconstructions
The reconstruction of the identified neurons was performed using the TrakEM2 plugin in Fiji/ImageJ. One expert (AV) traced all neurons and annotated all pre- and postsynaptic sites. A second expert (EA) identified locations at which the skeletons looked unusual (sharp turns or closely spaced branch points). EA reviewed the images at all of these locations (typically a few per neuron), and reached consensus with AV. A few locations were judged ambiguous in the sense that image defects made it impossible to interpret the locations with certainty. At such ambiguous locations, we erred on the side of incomplete tracing.
A second round of tracing was then carried out using a semi-automated, volume based reconstruction method similar to the ‘eyewire’ platform (http://eyewire.org). This process involved semiautomatic reconstruction of neurons with two tracers (not the authors), where the second tracer was able to view the first tracer’s reconstructions. A third expert tracer (A.V) reviewed all sites where the first two tracers differed to provide consensus. The final trace included all those neurites where the majority agreed. This ensured that each cell was covered by at least 2 tracers. This semi-automated process revealed that the axon of one cell was previously under-reconstructed and another dendrite from a different cell was over-reconstructed. The remaining 20/22 cells remained the same between both methods.
Having real-time volume based tracing provides shape based context to tracers. This is useful to detect error. For example, if a neurite is falsely merged it is often the case that its diameter is different as compared to the neurite being reconstructed. Similarly, at locations where the neurites are very thin, we can often reconstruct all the neurites abutting the neurite being traced to eliminate false positives,
Since the section thickness was 45nm, neurites that were parallel to the cutting plane were sometimes hard to follow during reconstruction. This typically leads to problems when tracing very thin neurites (typically axons) that can be hard to follow. In such instances is it useful to keep track of internal organelles and other cues such as contrast to eliminate ambiguous locations. After such techniques are applied, the end result is that every cell has at most one or two truly ambiguous locations. The ambiguity might be caused by a thin neurite parallel to the sectioning plane, or deteriorated ultrastructure (due to electroporation, poor fixation, or possibly developmental pruning of axons). In truly ambiguous locations, we err on the side of undertracing.
The skeletonized tree structure was exported from TrakEM2 as *.swc files. These trees were then imported into Matlab using custom scripts to import .swc files as trees. For the comparison of EM traces with LM traces, the LM traces were traced using the Simple Neurite Tracer [54] plugin in Fiji, and exported as *.swc file. In total, we reconstructed 9.29 mm of neurite (2.45 mm of axonal length and 6.84 mm of dendritic length).
Quantification and Statistical Analysis
All tree lengths are reported as pathlengths unless noted otherwise. Similarly, all lengths to a pre- or postsynaptic site are reported as pathlengths. We defined the axon initiation site as the parent node of the first presynaptic site. All neurites that are not axonal are defined as dendritic. All nodes of the tree were thus divided as axonal nodes or dendritic nodes. Pathlengths were generated for a tree over all axonal nodes or all dendritic nodes, and the length of the tree was the sum of all axonal length and dendritic length. A collateral was defined as all those segments of an axon, that emerged from the central axonal shaft. All axonal nodes were divided into collateral and non-collateral nodes. The completeness of cells was decided based on the number of neurites that exited the cells, the fewer that exited, the more complete the cell,
The diameter of the axon and dendrites for each tree was generated by drawing a line segment along the cross-section at random locations along the tree. Many such line segments were drawn across the entire extent of the tree. The values are reported as a mean across all dendrites and axons.
Arbor densities of the dendrites was computed by projecting all the axonal or dendritic nodes along the desired plane and reported in a normalized scale. Arbor volumes were computed using the Matlab function convhull. To infer the neurotransmitter identity from the stripe organization of the cell bodies, we annotated the location of all the cell bodies from a low-resolution stack. The cell density was then computed by projecting all the cells along the desired axis. This process picked out the peaks that were visible in the EM images. The location of a stripe was defined as the local peak that emerged from the cell density projecting analysis. The planar organization of the postsynapses and presynapses were fit to a plane using the planefit function, available on the Matlab central repository.
To locate the border between r6 and r7 we followed a similar approach that was performed previous using light microscopic imaging and the expression of the hox genes [55, 49, 29]. Briefly reticulospinal cells were identified based on the ultrastructure, that was very different form the remaining cells in the area. These cells were rich in mitochondria and gave rise to a large myelinated axon that joined the medial longitudinal fasciculus. We fit a plane to the reticulospinal neurons, and identified a point on this plane that bisected Mi3 neuron located in r6 and Ca neuron located in r7. The tilt of this border from previous studies was observed to be 0.37 based on transgene expression patterns. This line that bisected the locations of Mi3 and Ca was moved 0.37μm caudally for every micron ventrally based on [49, 29]. The resulting line is where we differentiate the border of r6 and r7.
Data and Software availability
All reconstructed neuron traces will be uploaded to the neuromorpho.org repository for download. The traces can be imported and analyzed using the Matlab tool box for analysis, treestoolbox.org.
Key Resources Table
Supplementary Material
Article Highlights.
Correlated Light and electron microscopy from larval zebrafish
Electron microscopic reconstruction of neurons encoding for eye movement behavior
Classification of neurons by axonal projections
Planar organization of dendrites
Synaptic connections between integrator cells
Acknowledgments
We are grateful to Juan Carlos Tapia, Richard Schalek and Ken Hayworth for assisting us with tissue preparation, the ATUM serial sectioning procedure, and the WaferMapper software for EM imaging. Stephan Saalfeld, Albert Cardona, and Ignacio Arganda-Carreras answered questions about the TrakEM2 plugin for FIJI/ImageJ. Uygar Sümbül assisted with importing skeletons into MATLAB. We thank Jim Hudspeth for sharing reagents and tissue processing protocols, Heather Sullivan for tissue processing and optimization, Ashleigh Showler, Gurion Marks and Anjin Xianyu for assistance with reconstructions and alignment, and Melanie Lee for sharing light microscopic images of neurons. We benefited from helpful discussions with Jim Hudspeth, David Tank and Kanaka Rajan. KD acknowledges the support of NIH Training grant EY007138-16. EA acknowledges funding from the Burroughs Wellcome Career Award at the Scientific Interface, the Searle Scholars program, the Simons Collaboration on the Global Brain, NSF CRCNS grant 1208088, and NIH grant R01027036. HSS acknowledges funding from the Mathers Foundation, Gatsby Foundation, Human Frontier Science Program, NIH/NINDS award 5R01NS076467, and ARO MURI award W911NF-12-1-0594.
Footnotes
Author contributions
Conceptualization, Methodology, and Writing: A.V, E. A., and H.S.S. Formal Analysis: A.V. and H.S.S. Data Curation: A.V. Visualization: A.V. Investigation: K.D performed two-photon calcium imaging. A.V. acquired serial section EM images with assistance from J.W.L., and assembled the resulting image stack. K.D, A.R. registered the calcium images with the EM images. A.V. and E. A. reconstructed neurons with help from A.R. Funding Acquisition: E.A. and H.S.S.
Publisher's Disclaimer: This is a PDF file of an unedited manuscript that has been accepted for publication. As a service to our customers we are providing this early version of the manuscript. The manuscript will undergo copyediting, typesetting, and review of the resulting proof before it is published in its final citable form. Please note that during the production process errors may be discovered which could affect the content, and all legal disclaimers that apply to the journal pertain.
References
- 1.Briggman KL, Helmstaedter M, Denk W. Wiring specificity in the direction-selectivity circuit of the retina. Nature. 2011;471:183–188. doi: 10.1038/nature09818. [DOI] [PubMed] [Google Scholar]
- 2.Bock DD, Lee WCA, Kerlin AM, Andermann ML, Hood G, Wetzel AW, Yurgenson S, Soucy ER, Kim HS, Reid RC. Network anatomy and in vivo physiology of visual cortical neurons. Nature. 2011;471:177–182. doi: 10.1038/nature09802. [DOI] [PMC free article] [PubMed] [Google Scholar]
- 3.Lee W, Bonin V, Reed M, Graham BJ, Hood G. Anatomy and function of an excitatory network in the visual cortex. Nature. 2016:532. doi: 10.1038/nature17192. [DOI] [PMC free article] [PubMed] [Google Scholar]
- 4.Major G, Tank D. Persistent neural activity: prevalence and mechanisms. Current Opinion in Neurobiology. 2004;14:675–684. doi: 10.1016/j.conb.2004.10.017. [DOI] [PubMed] [Google Scholar]
- 5.Joshua M, Lisberger SG. A tale of two species: Neural integration in zebrafish and monkeys. Neuroscience. 2015;296:80–91. doi: 10.1016/j.neuroscience.2014.04.048. [DOI] [PMC free article] [PubMed] [Google Scholar]
- 6.Friedrich RW, Jacobson GA, Zhu P. Circuit Neuroscience in Zebrafish. Current Biology. 2010;20:R371–R381. doi: 10.1016/j.cub.2010.02.039. [DOI] [PubMed] [Google Scholar]
- 7.Cannon SC, Robinson DA. Loss of the neural integrator of the oculomotor system from brain stem lesions in monkey. Journal of Neurophysiology. 1987;57:1383–1409. doi: 10.1152/jn.1987.57.5.1383. [DOI] [PubMed] [Google Scholar]
- 8.Chéron G, Godaux E. Disabling of the oculomotor neural integrator by kainic acid injections in the prepositus-vestibular complex of the cat. The Journal of physiology. 1987;394:267–290. doi: 10.1113/jphysiol.1987.sp016870. [DOI] [PMC free article] [PubMed] [Google Scholar]
- 9.Aksay E, Olasagasti I, Mensh BD, Baker R, Goldman MS, Tank DW. Functional dissection of circuitry in a neural integrator. Nature Neuroscience. 2007;10:494–504. doi: 10.1038/nn1877. [DOI] [PMC free article] [PubMed] [Google Scholar]
- 10.Baker R, Berthoz A, Delgado-Garcia J. Monosynaptic excitation of trochlear motoneurons following electrical stimulation of the prepositus hypoglossi nucleus. Brain research. 1977;121:157–161. doi: 10.1016/0006-8993(77)90445-0. [DOI] [PubMed] [Google Scholar]
- 11.Baker R, Delgado-Garcia J, Alley K. Morphological and physiological demonstration that prepositus hypoglossi neurons terminate on medial rectus motoneurons. Proc Int Union Physiol Sci 1977 [Google Scholar]
- 12.McCrea RA, Baker R, Delgado-Garcia J. Afferent and efferent organization of the prepositus hypoglossi nucleus. Progress in brain research. 1979;50:653–665. doi: 10.1016/S0079-6123(08)60863-8. [DOI] [PubMed] [Google Scholar]
- 13.Kaneko CR. Eye movement deficits following ibotenic acid lesions of the nucleus prepositus hypoglossi in monkeys II. Pursuit, vestibular, and optokinetic responses. Journal of Neurophysiology. 1999;81:668–681. doi: 10.1152/jn.1999.81.2.668. [DOI] [PubMed] [Google Scholar]
- 14.McFarland JL, Fuchs AF. Discharge patterns in nucleus prepositus hypoglossi and adjacent medial vestibular nucleus during horizontal eye movement in behaving macaques. Journal of Neurophysiology. 1992;68:319–332. doi: 10.1152/jn.1992.68.1.319. [DOI] [PubMed] [Google Scholar]
- 15.Pastor AM, De la Cruz RR, Baker R. Eye position and eye velocity integrators reside in separate brainstem nuclei. Proceedings of the National Academy of Sciences. 1994;91:807–811. doi: 10.1073/pnas.91.2.807. [DOI] [PMC free article] [PubMed] [Google Scholar]
- 16.Aksay E, Baker R, Seung HS, Tank DW. Anatomy and Discharge Properties of Pre-Motor Neurons in the Goldfish Medulla That Have Eye-Position Signals During Fixations. Journal of Neurophysiology. 2000;84:1035–1049. doi: 10.1152/jn.2000.84.2.1035. [DOI] [PubMed] [Google Scholar]
- 17.Aksay E, Gamkrelidze G, Seung HS, Baker R, Tank DW. In vivo intracellular recording and perturbation of persistent activity in a neural integrator. Nature Neuroscience. 2001;4:184–193. doi: 10.1038/84023. [DOI] [PubMed] [Google Scholar]
- 18.van Alphen AM, Stahl JS, De Zeeuw CI. The dynamic characteristics of the mouse horizontal vestibulo-ocular and optokinetic response. Brain research. 2001;890:296–305. doi: 10.1016/s0006-8993(00)03180-2. [DOI] [PubMed] [Google Scholar]
- 19.Robinson DA. Integrating with neurons. Annual review of neuroscience. 1989:12. doi: 10.1146/annurev.ne.12.030189.000341. [DOI] [PubMed] [Google Scholar]
- 20.Robinson DA. Oculomotor unit behavior in the monkey. Journal of Neurophysiology. 1970;33:393–403. doi: 10.1152/jn.1970.33.3.393. [DOI] [PubMed] [Google Scholar]
- 21.Leigh RJ, Zee DS. The Neurology of Eye Movements. Oxford University Press; USA: 2015. [Google Scholar]
- 22.McCrea RA, Baker R. Cytology and intrinsic organization of the perihypoglossal nuclei in the cat. The Journal of comparative neurology. 1985;237:360–376. doi: 10.1002/cne.902370307. [DOI] [PubMed] [Google Scholar]
- 23.Steiger HJ, Büttner-Ennever JA. Oculomotor nucleus afferents in the monkey demonstrated with horseradish peroxidase. Brain research. 1979;160:1–15. doi: 10.1016/0006-8993(79)90596-1. [DOI] [PubMed] [Google Scholar]
- 24.Kamath BY, Keller EL. A neurological integrator for the oculomotor control system. Mathematical Biosciences. 1976;30:341–352. [Google Scholar]
- 25.Seung HS. How the brain keeps the eyes still. Proc Natl Acad Sci USA. 1996;93:13339–13344. doi: 10.1073/pnas.93.23.13339. [DOI] [PMC free article] [PubMed] [Google Scholar]
- 26.Seung HS, Lee DD, Reis BY, Tank DW. Stability of the Memory of Eye Position in a Recurrent Network of Conductance-Based Model Neurons. Neuron. 2000;26:259–271. doi: 10.1016/s0896-6273(00)81155-1. [DOI] [PubMed] [Google Scholar]
- 27.Fisher D, Olasagasti I, Tank DW, Aksay ERF, Goldman MS. A modeling framework for deriving the structural and functional architecture of a short-term memory microcircuit. Neuron. 2013;79:987–1000. doi: 10.1016/j.neuron.2013.06.041. [DOI] [PMC free article] [PubMed] [Google Scholar]
- 28.Gonçalves PJ, Arrenberg AB, Hablitzel B, Baier H, Machens CK. Optogenetic perturbations reveal the dynamics of an oculomotor integrator. Frontiers in Neural Circuits. 2014:8. doi: 10.3389/fncir.2014.00010. [DOI] [PMC free article] [PubMed] [Google Scholar]
- 29.Lee MM, Arrenberg AB, Aksay ERF. A Structural and Genotypic Scaffold Underlying Temporal Integration. The journal of neuroscience. 2015;35:7903–7920. doi: 10.1523/JNEUROSCI.3045-14.2015. [DOI] [PMC free article] [PubMed] [Google Scholar]
- 30.Miri A, Daie K, Burdine RD, Aksay E, Tank DW. Regression-Based Identification of Behavior-Encoding Neurons During Large-Scale Optical Imaging of Neural Activity at Cellular Resolution. Journal of Neurophysiology. 2011;105:964–980. doi: 10.1152/jn.00702.2010. [DOI] [PMC free article] [PubMed] [Google Scholar]
- 31.Higashijima SI, Mandel G, Fetcho JR. Distribution of prospective glutamatergic, glycinergic, and GABAergic neurons in embryonic and larval zebrafish. The Journal of comparative neurology. 2004;480:1–18. doi: 10.1002/cne.20278. [DOI] [PubMed] [Google Scholar]
- 32.Kinkhabwala A, Riley M, Koyama M, Monen J, Satou C, Kimura Y, Higashijima SI, Fetcho J. A structural and functional ground plan for neurons in the hindbrain of zebrafish. Proceedings of the National Academy of Sciences of the United States of America. 2011;108:1164–1169. doi: 10.1073/pnas.1012185108. [DOI] [PMC free article] [PubMed] [Google Scholar]
- 33.Koyama M, Kinkhabwala A, Satou C, Higashijima SI, Fetcho J. Mapping a sensory-motor network onto a structural and functional ground plan in the hindbrain. Proceedings of the National Academy of Sciences of the United States of America. 2011;108:1170–1175. doi: 10.1073/pnas.1012189108. [DOI] [PMC free article] [PubMed] [Google Scholar]
- 34.Lee RK, Eaton RC, Zottoli Sj. Segmental arrangement of reticulospinal neurons in the goldfish hindbrain. The Journal of comparative neurology. 1993;329:539–556. doi: 10.1002/cne.903290409. [DOI] [PubMed] [Google Scholar]
- 35.Kimura Y, Okamura Y, Higashijima SI. alx, a zebrafish homolog of Chx10, marks ipsilateral descending excitatory interneurons that participate in the regulation of spinal locomotor circuits. The Journal of neuroscience: the official journal of the Society for Neuroscience. 2006;26:5684–5697. doi: 10.1523/JNEUROSCI.4993-05.2006. [DOI] [PMC free article] [PubMed] [Google Scholar]
- 36.Colombo A, Reig G, Mione M, Concha ML. Zebrafish BarH-like genes define discrete neural domains in the early embryo. Gene Expression Patterns. 2006;6:347–352. doi: 10.1016/j.modgep.2005.09.011. [DOI] [PubMed] [Google Scholar]
- 37.Jabeen S, Thirumalai V. Distribution of the gap junction protein connexin 35 in the central nervous system of developing zebrafish larvae. Frontiers in Neural Circuits. 2013;7:91. doi: 10.3389/fncir.2013.00091. [DOI] [PMC free article] [PubMed] [Google Scholar]
- 38.Caley DW, Butler AB. Formation of central and peripheral myelin sheaths in the rat: an electron microscopic study. The American journal of anatomy. 1974;140:339–347. doi: 10.1002/aja.1001400303. [DOI] [PubMed] [Google Scholar]
- 39.Rosenbluth J, Palay SL. The fine structure of nerve cell bodies and their myelin sheaths in the eighth nerve ganglion of the goldfish. The Journal of Biophysical and Biochemical Cytology. 1961:9. doi: 10.1083/jcb.9.4.853. [DOI] [PMC free article] [PubMed] [Google Scholar]
- 40.Barresi MJF, Hutson LD, Chien CB, Karlstrom RO. Hedgehog regulated Slit expression determines commissure and glial cell position in the zebrafish forebrain. Development (Cambridge, England) 2005;132:3643–3656. doi: 10.1242/dev.01929. [DOI] [PubMed] [Google Scholar]
- 41.Petralia RS, Wang YX, Mattson MP, Yao PJ. Structure, Distribution, and Function of Neuronal/Synaptic Spinules and Related Invaginating Projections. NeuroMolecular Medicine. 2015;17:211–240. doi: 10.1007/s12017-015-8358-6. [DOI] [PMC free article] [PubMed] [Google Scholar]
- 42.Guemez-Gamboa A, Coufal NG, Gleeson JG. Primary cilia in the developing and mature brain. Neuron. 2014;82:511–521. doi: 10.1016/j.neuron.2014.04.024. [DOI] [PMC free article] [PubMed] [Google Scholar]
- 43.Joshua M, Medina JF, Lisberger SG. Diversity of Neural Responses in the Brainstem during Smooth Pursuit Eye Movements Constrains the Circuit Mechanisms of Neural Integration. The journal of neuroscience. 2013;33:6633–6647. doi: 10.1523/JNEUROSCI.3732-12.2013. [DOI] [PMC free article] [PubMed] [Google Scholar]
- 44.Debowy O, Baker R. Encoding of eye position in the goldfish horizontal oculomotor neural integrator. Journal of Neurophysiology. 2011;105:896–909. doi: 10.1152/jn.00313.2010. [DOI] [PMC free article] [PubMed] [Google Scholar]
- 45.Aksay E, Baker R, Seung HS, Tank DW. Correlated discharge among cell pairs within the oculomotor horizontal velocity-to-position integrator. The Journal of neuroscience: the official journal of the Society for Neuroscience. 2003;23:10852–10858. doi: 10.1523/JNEUROSCI.23-34-10852.2003. [DOI] [PMC free article] [PubMed] [Google Scholar]
- 46.Brustein E, Marandi N, Kovalchuk Y, Drapeau P, Konnerth A. “In vivo” monitoring of neuronal network activity in zebrafish by two-photon Ca2+ imaging. Pflügers Archiv. 2003;446:766–773. doi: 10.1007/s00424-003-1138-4. [DOI] [PubMed] [Google Scholar]
- 47.Smetters D, Majewska A, Yuste R. Detecting action potentials in neuronal populations with calcium imaging. Methods (San Diego, Calif) 1999;18:215–221. doi: 10.1006/meth.1999.0774. [DOI] [PubMed] [Google Scholar]
- 48.Miri A, Daie K, Arrenberg AB, Baier H, Aksay E, Tank DW. Spatial gradients and multidimensional dynamics in a neural integrator circuit. Nature Neuroscience. 2011;14:1150–1159. doi: 10.1038/nn.2888. [DOI] [PMC free article] [PubMed] [Google Scholar]
- 49.Daie K, Goldman MS, Aksay ERF. Spatial patterns of persistent neural activity vary with the behavioral context of short-term memory. Neuron. 2015;85:847–860. doi: 10.1016/j.neuron.2015.01.006. [DOI] [PMC free article] [PubMed] [Google Scholar]
- 50.Tapia JC, Kasthuri N, Hayworth KJ, Schalek R, Lichtman JW, Smith SJ, Buchanan J. High-contrast en bloc staining of neuronal tissue for field emission scanning electron microscopy. Nature Protocols. 2012;7:193–206. doi: 10.1038/nprot.2011.439. [DOI] [PMC free article] [PubMed] [Google Scholar]
- 51.Hayworth KJ, Morgan JL, Schalek R, Berger DR, Hildebrand DGC, Lichtman JW. Imaging ATUM ultrathin section libraries with WaferMapper: a multi-scale approach to EM reconstruction of neural circuits. Frontiers in Neural Circuits. 2014;8:68. doi: 10.3389/fncir.2014.00068. [DOI] [PMC free article] [PubMed] [Google Scholar]
- 52.Kasthuri N, Hayworth KJ, Berger DR, Schalek RL, Conchello JA, Knowles-Barley S, Lee D, Vázquez-Reina A, Kaynig V, Jones TR, et al. Saturated Reconstruction of a Volume of Neocortex. Cell. 2015;162:648–661. doi: 10.1016/j.cell.2015.06.054. [DOI] [PubMed] [Google Scholar]
- 53.Cardona A, Saalfeld S, Schindelin J, Arganda-Carreras I, Preibisch S, Longair M, Tomancak P, Hartenstein V, Douglas RJ. TrakEM2 software for neural circuit reconstruction. PLoS ONE. 2012;7:e38011. doi: 10.1371/journal.pone.0038011. [DOI] [PMC free article] [PubMed] [Google Scholar]
- 54.Longair MH, Baker DA, Armstrong JD. Simple Neurite Tracer: open source software for reconstruction, visualization and analysis of neuronal processes. Bioinformatics. 2011;27:2453–2454. doi: 10.1093/bioinformatics/btr390. [DOI] [PubMed] [Google Scholar]
- 55.Ma LH, Grove CL, Baker R. Development of oculomotor circuitry independent of hox3 genes. Nature Communications. 2014;5:4221. doi: 10.1038/ncomms5221. [DOI] [PMC free article] [PubMed] [Google Scholar]
- 56.Lister JA, Robertson CP, Lepage T, Johnson SL, Raible DW. nacre encodes a zebrafish microphthalmia-related protein that regulates neural-crest-derived pigment cell fate. Development (Cambridge, England) 1999;126:3757–3767. doi: 10.1242/dev.126.17.3757. [DOI] [PubMed] [Google Scholar]
- 57.Sümbül U, Song S, McCulloch K, Becker M, Lin B, Sanes JR, Masland RH, Seung HS. A genetic and computational approach to structurally classify neuronal types. Nature Communications. 2014;5:3512. doi: 10.1038/ncomms4512. [DOI] [PMC free article] [PubMed] [Google Scholar]
Associated Data
This section collects any data citations, data availability statements, or supplementary materials included in this article.