

Abstract
Objective(s):
Determination of stages of colon cancer is done by biopsy usually after surgery. Metabolomics is the study of all the metabolites using LC-MS and 1HNMR spectroscopy with chemometric techniques. The stages of colon cancer were detected from patients’ sera using 1HNMR.
Materials and Methods:
Five ml blood was collected from 16 confirmed patients referred for colonoscopy. One group of eight patients were diagnosed with stage 0 to I colon cancer and the second group of 8 patients with II-IV stage colon cancer. Sera were sent for 1HNMR. The differentiating metabolites were identified using HMDB and the metabolic cycles from Metaboanalyst.
Results:
Six metabolites of which pyridoxine levels lowered, and glycine, cholesterol, taurocholic acid, cholesteryl ester and deoxyinosine increased.
Conclusion:
The different stages of cancer were identified by the main metabolic cycles such as primary bile acid biosynthesis, purine and vitamin B metabolic pathways and the glutathione cycle.
Keywords: Colon cancer, 1HNuclear Magnetic -Resonance Spectroscopy, Metabolomics, Serum, Staging
Introduction
Colorectal cancer (CRC) is the fourth most common cause of death from cancer all over the world affecting 1.23 million individuals per year (9.7% of overall cancers) and is the fourth cause of death from cancer worldwide (8% of total cancer deaths). The incidence of CRC in the developed countries like North America and Europe is decreasing from 58/100,000 in 1992 to 38.5/100,000 in 2009 due to regular screening techniques (1).
In Iran as a consequence of life style changes, the rate has increased to 38 per 100,000 in 2009 from 6 to 7.6 in 1996 (2, 3). Regular screening like flexible sigmoidoscopy, colonoscopy, double-contrast barium enema, fecal occult blood test, and fecal immunochemical test are part of CRC prevention. All of the tests except the last two are invasive and time-consuming, but they have been effective in lowering cancer rates in the US and Europe.
Colon cancer, like all other types, begins as small, non-cancerous (benign) clumps of cells called adenomatous polyps. As time passes, some of these polyps become cancerous and it usually takes about 10-15 years for them to develop into colorectal cancer. However, as diagnosis takes place in the early stages, colon cancer can be treated by surgery and other standard therapies. Pathology of the colon cancer tumors is determined either by biopsy or histopathology and can be classified as stage 0 when only the mucosa of the colon wall is affected by abnormal cells. Stage I is denoted when cancer cells have entered the muscle layer from the mucosa of the colon. Stage II is divided into three stages IIA where cancer has gone from the muscle layer to colon serosa, IIB has spread from the serosa but has not affected nearby organs and stage IIC is when cancer has gone from the serosa to the nearby organs. Stage III cancer is once again divided into IIIA where cancer has reached the lymph nodes, IIIB has developed into the submucosa and in IIIC it has grown through the wall of the colon or rectum (including the visceral peritoneum) but has not reached nearby organs and stage IV cancer has disseminated throughout the body like the lung, liver, abdominal wall, or ovary (4).
Genomics deals with twenty-five thousand genes and proteomics analyzes a hundred thousand proteins, but the physiological effect of these is finally seen in the production of metabolites. Metabolomics is the new omics which studies fifteen hundred metabolites using high throughput technology like 1HNMR spectroscopy or mass spectrometry combined with chemometric techniques and different databases for identification of metabolites and metabolic cycles (5, 6). As it provides important data on chemical organizations, it is widely used for providing data information on disease process, biochemical functions and drug toxicity (7). This method is used in disease diagnosis (8), biomarker screening (9) and safety assessment of chemicals (10) for the presence and/or grading of different cancers such as prostate cancer (11), brain cancer (12), and breast cancer (13). Modeling of the spectra readings were carried out using chemometric methods like Partial Least Squares (PLS) of Orthogonal Signal Correction (OSC) and then the differentiating metabolites were identified using Human Metabolome Database (HMDB) or any other metabolic database (14). There are several studies with metabolomics distinguishing colon cancer patients from normal using feces, tissues and sera with mass spectrometry. Reports distinguishing the different stages of colon cancer using magic angle spinning 1HNMR and mass spectrometry have been recently published (15, 16).
We have used the sera of colon cancer patients for recognition of different stages in confirmed colon cancer patients (17). The discriminating metabolites were recognized by OSC-PLS modeling and identified using the HMDB (14) and metabolic cycles recognized by Metaboanalyst Database (16).
Materials and Methods
Sample collection
Five ml blood was collected from people who were on a liquid diet for at least 48 hr and were referred to the Gastroenterology at Amir Alam Hospital, Tehran for colonoscopy. One group comprised 8 patients with stage 0 to I colon cancer and a second group made up of 8 patients with II, III and IV stage colon cancer. All stages were confirmed by biopsy. Sera were separated and stored at -80 ºC. All patients filled up a consent form before serum collections, as per the requirements of Pasteur Institute Ethics Committee and the study protocol conforms to the ethical guidelines of the 1975 Declaration of Helsinki as reflected in a priori approval by the institution’s human research committee.
Sample preparation and 1HNMR spectroscopy
The protocol was carried out as described earlier (17). A mixture of 600 µl serum was mixed with 70 µl D2O and internal reference 1 mM sodium 2-trimethylsilylpropionate (TMSP). The test was carried out in a 5 mm NMR tube at room temperature and data acquisition was performed. For NMR data assembly, one dimensional 1HNMR spectra were obtained on a Bruker DRX-500 NMR spectrometer operating a 500.13 MHZ and Carl Purcell Meiboom Gill (CPMG) 90-(t-180-tn-acquisiton). The variables of the signal intensities and chemical shifts were integrated and were written into the Excel file. The normal intensities of both the groups were recorded into the MATLAB file. The matrices were 0 for stages 0, I and 1 for stage II, III and IV in the MATLAB file. OSC filters were used to remove noise from the spectrum hilew. PLS was carried out to separate the samples and differentiating metabolites identified from the outliers numbers corresponding to the chemical shifts in the excel file.
Identification of metabolites
The metabolites corresponding to the differentiating chemical shiftsin the sera were identified using HMDB (http://www.hmdb.ca/metabolites) (14). Analysis of metabolites was carried out using Metaboanalyst software (16).
Results
Spectra obtained from the two groups are shown in Figure 1. The spectra for all the metabolites had increased except for pyridoxine which showed a decrease. OSC-PLS showed a very good separation of the two matrices (Figure 2). The loading plot in Figure 3 shows the levels of differentiating metabolites. The differentiating metabolites identified by HMDB are seen in Table 1. The metabolites were entered into the Metaboanalyst software and the important metabolic pathways were identified. Results from fold enrichment analysis depicting the important differentiating pathways are seen in Figure 4 with their P-values.
Figure 1.

Spectra of the two groups with differentiated metabolites; horizontal axis depicting chemical shifts of the metabolites in ppm with TMSP as reference and y axis shows signal intensitiesproportional to molar concentrations
Figure 2.

Score plot of PLS after OSC shows very good separation of samples; odd numbers indicate 0, I colon cancer stages and even numbers II, III and IV colon cancer stages samples
Figure 3.
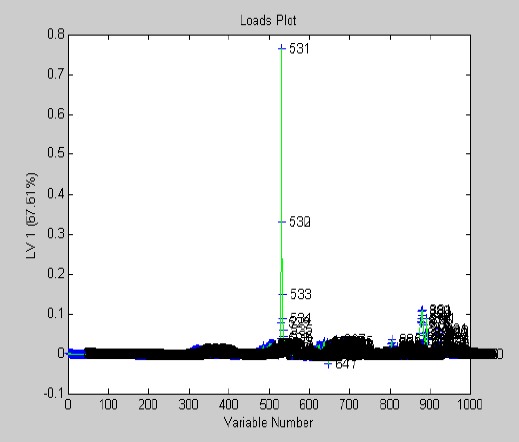
Loading plot with levels of differentiating metabolites in the two groups
Table 1.
Metabolites separating the two groups of samples identified by HDMB; ascending and descending levels of metabolites in the serum are depicted by arrows
| Number | Metabolite names | Levels in serum | |
|---|---|---|---|
| Stage 0, I | Stage II, III, IV | ||
| 1 | Deoxydinosine | ↓ | ↑ |
| 2 | Pyroxidine | ↑ | ↓ |
| 3 | Glycine | ↓ | ↑ |
| 4 | Taurochoilic acid | ↓ | ↑ |
| 5 | Cholesteryl Ester ce (18:2(9z,12z)) | ↓ | ↑ |
| 6 | Deoxycholic acid | ↓ | ↑ |
Figure 4.

Plot of Fold Enrichment Analysis showing the main metabolic pathways affected in the two groups of colon cancer stages
Discussion
We have distinguished the different stages of confirmed colon cancer using 1HNMR metabolomics. Stages 0 and I were in one group and stages II, III, and IV were in the other. The stages were well separated as shown in the score plot (Figure 2), the loading plot showed the presence of 6 metabolites of which 5 had increased in the stages of II, III, and IV.
The metabolites detected included deoxyinosine which is a nucleoside involved in purine metabolism and participates in RNA synthesis. Modified nucleosides in the urine have been regarded as potential tumor biomarkers since 2006 (18), and the use of different liquid chromatographies like LC-MS in addition with chemometrics has made this event more likely. In Taiwan, urinary nucleosides have been studied as biomarkers of the breast, colon, lung, and gastric cancer, but the results of the six targeted nucleosides were good only for breast and gastric cancers and not the other two cancers (19). Deoxyinosine levels in our study are seen to increase in the stages of II, III and IV cancer as purine metabolism is reported to be high in tumors turnovers (20). Purine metabolism is also seen as an important differentiating metabolite between the two groups.
Pyridoxine is one of the other metabolites which participate in the vitamin B6 metabolic pathway. Increasing evidence prove that vitamin B6 (of which pyridoxine is part of its family) has a protective effect on colon cancer cells (21). High concentrations of vitamin B6 are seen to stimulate IGBF1, p53, and p21 which are defensive factors against colon cancer. There is increasing evidence that dietary supplemental vitamin B6 suppresses colon damage, epithelial cell proliferation and protein expression of HSP70 and HO-1, the targets for anti-tumor agents, in rats exposed to 1,2 dimethyl hydrazine. It is observed that pyridoxine levels are lowered in the stages of II, III, and IV as compared to stage 0 and I (23).
Cholesterol, taurocholic acid, and deoxycholic acid are three related metabolites participating in bile acid biosynthesis whose levels had increased in the II and III stage groups. Cholesterol is an essential constituent of the plasma membrane and rigidifies it. Bile acids are cholesterol derivatives with detergent properties; they may alter the stability of the membrane lipid bilayer causing unspecific cell damage resulting in the focal destruction of the intestinal epithelium. Bile acids are components normally seen in the intestine and have been suggested as the tumor promoting agents since 1939. Their high physiological concentrations can cause nitrosative and oxidative effects, mutations and DNA damage along with the development of apoptosis and mutations. Bile acids are known to be carcinogenic, with high-fat diets modulating bile acid homeostasis and altered levels of bile acids leading to colorectal pathogenesis (24). For example, a bile acid-supplemented diet in mice has been shown to induce colorectal cancer directly, suggesting that bile acids are carcinogenic (25). The fecal ratio of lithotomic acid to deoxycholic acid, a risk factor for colon cancer is also reduced in rats fed on a high-fat diet along with vitamin B6 (26). Deoxycholic acid, one of the bile acids is seen to be higher in the serum of individuals with adenoma. Bile acids induce DNA damage in colon cells with oxidative DNA damage, a likely component and is linked to increased risk of colon cancer. A rapid effect on cells of high bile acid exposure is the generation of reactive nitrogen species, disruption of the cell membrane and mitochondria induction of DNA damage, mutation, apoptosis and development of reduced apoptosis capability upon chronic exposure (27).
Glycine is an important amino acid associated with different cycles in colon cancer and seen to increase in the second, third and fourth stages as compared to stages 0 and I. High glycine consumption was seen in 60 types of cancer cells (28). Recent developments suggest one of the possible drivers of oncogenesis is hyperactivation of the one-carbon metabolism which engage the folate and methionine cycles and hence incorporate carbon units from amino acids including serine and glycine which make varied products such as lipids, nucleotides, and proteins (29). A glycine cleavage system is active in some cells which produce ammonia, carbon dioxide and a carbon unit for the methylation of tetrahydrofolate. In some cells, threonine can also be converted to glycine through an aldol cleavage. Glycine can also be generated from many other sources, including choline, betaine, dimethylglycine and sarcosine (also known as N-methylglycine), through a series of reactions that involve demethylation (30). An increase in circulating concentrations of gastrin or gastrin precursors such as progastrin and glycine-extended gastrin has been proposed to promote the development of CRC (31). Interesting results are shown by mass spectrometry on tissues which indicate that regional contents of glutamate, glutamine, glycine, leucine/isoleucine/hydroxyproline, phenylalanine, and alanine were significantly elevated in metastatic tumors versus parenchyma of tumor-bearing livers (32).
Research carried out on Ki-ras mutations (a codon which is molecular on/off switch) might have an effect on the survival rate of CRC patients and that the specific codon 12 glycine/valine mutations might play a role in the progression of this cancer, thus leading to a higher risk of disease relapse or death in 30%. Furthermore, when this mutation is present in the third stage, this risk goes up as far as 50% (33). In this study, glycine level is seen to increase in the II, III, and IV stage groups.
Conclusion
Glycine is also a constituent of glutathione metabolism which is one of the important cycles in which it participates. The glutathione/glutathione-S-transferase enzyme detoxification system in the colon is important for protection against carcinogens. An association of low colonic glutathione/glutathione-S-transferase activity levels and high clinical risk for the development of CRC has been observed (34). A significant association was found in another study between glutathione-S-transferase (GST) activity in the mucosa along the gastro-intestinal tract and corresponding tumor incidence. Low activity of this enzyme was correlated with high tumor incidence and vice versa (35). This enzyme and its isozymes also play a significant role in response to different chemotherapy drugs (36).
It can be stated that the stages of colon cancer 0. I and II, III and IV could be separated by sera of colon cancer patients using metabolomics on spectra of 1HNMR. The metabolites which separated the two groups were deoxyinosine, pyridoxine, glycine, taurocholic acid, CE and deoxycholic acid. Of the metabolic cycles, the main ones were bile acid biosynthesis, glutathione metabolism, and vitamin B6 metabolism.
Acknowledgment
We wish to acknowledge the Pasteur Institute of Iran for funding the project.
We thank the Pathology Department of Mehr Hospital, Tehran for their kind cooperation.
This is part of a MSc thesis carried out by Mahsheed Mehrabanfar from Payame Noor University.
The authors declare that there is no conflict of interest.
References
- 1.Seer Stat Fact Sheets. Colon and Rectum Cancer National cancer institute. Available at: http://seer.cancer.gov/statfacts/html/colorect.html .
- 2.Safaee A, Fatemi SR, Ashtari S, Vahedi M, Moghimi-Dehkordi B. Four years incidence rate of colorectal cancer in Iran a survey of national cancer registry data implications for screening. Asian Pac J Cancer Prev. 2012;13:26952–2698. doi: 10.7314/apjcp.2012.13.6.2695. [DOI] [PubMed] [Google Scholar]
- 3.Ansari R, Mahdavinia M, Sadjadi A, Nouraie M, Kamangar F, Bishehsari F, et al. Incidence and age distribution of colorectal cancer in Iran results of a population-based cancer registry. Cancer Lett. 2006;240:143–147. doi: 10.1016/j.canlet.2005.09.004. [DOI] [PubMed] [Google Scholar]
- 4.Colon Cancer Treatment (PDQ®)-National cancer institute. Available at: http://www.cancer.gov/cancertopics/pdq/treatment/colon/Patient/p.2 .
- 5.Nicholson JK, Lindon JC, Holmes E. Metabonomics: understanding the metabolic responses of living systems to pathophysiological stimuli via multivariate statistical analysis of biological NMR spectroscopic data. Xenobiotica. 1999;12:1181–1189. doi: 10.1080/004982599238047. [DOI] [PubMed] [Google Scholar]
- 6.Fiehn O. Metabolomics-the link between genotypes and phenotypes. Plant Mol Biol. 2002;12:155–171. [PubMed] [Google Scholar]
- 7.Jeremy K, Connelly NG, Lindon JC, Holmes E. Metabonomics: a platform for studying drug toxicity and gene function. Nat Rev Drug Discov. 2002;12:153–162. doi: 10.1038/nrd728. [DOI] [PubMed] [Google Scholar]
- 8.Claudino WM, Quattrone A, Biganzoli L, Quattron A, Pestrin M, Bertini I, et al. Metabolomics: available results, current research projects in breast cancer, and future applications. J Clin Oncol. 2007;12:2840–2846. doi: 10.1200/JCO.2006.09.7550. [DOI] [PubMed] [Google Scholar]
- 9.Xue R, Lin Z, Deng C, Dong L, Liu T, Wang J, et al. Serum metabolomics investigation on hepatocellular carcinoma patients by chemical derivatization followed by gas chromatography/mass spectrometry. Rapid Commun Mass Spectrom. 2008;12:3061–3068. doi: 10.1002/rcm.3708. [DOI] [PubMed] [Google Scholar]
- 10.Wei L, Liao P, Wu H, Li X, Pei F, Li W, et al. Toxicological effects of cinnabar in rats by NMR-based metabolic profiling of urine and serum. Toxicol Appl Pharm. 2008;12:417–429. doi: 10.1016/j.taap.2007.11.015. [DOI] [PubMed] [Google Scholar]
- 11.Van Asten JJ, Cuijpers V, Hulsbergen-van De Kaa C, Soede-Huijbregts C, Witjes JA, Verhofstad A, et al. High-resolution magic angle spinning NMR spectroscopy for metabolic assessment of cancer presence and Gleason score in human prostate needle biopsies. MAGMA. 2008;12:435–442. doi: 10.1007/s10334-008-0156-9. [DOI] [PubMed] [Google Scholar]
- 12.Astrakas LG, Zurakowski D, Tzika AA, Zarifi MK, Anthony DC, De Girolami U, et al. Noninvasive magnetic resonance spectroscopic imaging biomarkers to predict the clinical grade of pediatric brain tumors. Clin Cancer Res. 2004;12:8220–8228. doi: 10.1158/1078-0432.CCR-04-0603. [DOI] [PubMed] [Google Scholar]
- 13.Jagannathan NP, Sharma U. Breast tissue metabolism by magnetic resonance spectroscopy metabolites. 2017;7:25. doi: 10.3390/metabo7020025. doi:10.3390/metabo7020025. [DOI] [PMC free article] [PubMed] [Google Scholar]
- 14.Wishart DS, Jewison T, Guo AC, Wilson M, Knox C, Liu Y, et al. HMDB 3.0 —The Human resonance spectroscopy. Metabolomics. 2009;12:292–301. [Google Scholar]
- 15.Farshidfar F, Weljie AM, Kopciuk KA, Hilsden R, McGregor SE, Buie WD, et al. A validated metabolomic signature for colorectal cancer: exploration of the clinical value of metabolomics. Br J Cancer. 2016;115:848–857. doi: 10.1038/bjc.2016.243. [DOI] [PMC free article] [PubMed] [Google Scholar]
- 16.Xia J, Mandal R, Sinelnkoviv Broadhurst D, Wishart D. MetaboAnalyst 2.0--a comprehensive server for metabolomic data analysis. Nucleic Acids Res. 2012:40. doi: 10.1093/nar/gks374. [DOI] [PMC free article] [PubMed] [Google Scholar]
- 17.Zamani Z, Arjmand M, Vahabi F, IshaqHosseini SM, Fazeli SM, Sadeghi S, et al. A Metabolic study on colon cancer using 1H nuclear magnetic resonance spectroscopy. Biochem Res Int. 2014;2014:348712. doi: 10.1155/2014/348712. [DOI] [PMC free article] [PubMed] [Google Scholar]
- 18.Seidel A, Seidel P, Manuwald O. Modified nucleosides as biomarkers for early cancer diagnose in exposed populations. Environ Toxicol. 2015;30:956–967. doi: 10.1002/tox.21970. [DOI] [PubMed] [Google Scholar]
- 19.Hsu WY, Chen CJ, Huang YC, Tsai FJ, Jeng LB, Lai CC. Urinary nucleosides as biomarkers of breast, colon, lung, and gastric cancer in Taiwanese. PLoS One. 2013;8:e81701. doi: 10.1371/journal.pone.0081701. [DOI] [PMC free article] [PubMed] [Google Scholar]
- 20.Dustin G Brown, Sangeeta Rao, Tiffany L Weir, Joanne O’Malia, Marlon Bazan, Regina J. Brown, Elizabeth P. Ryan Metabolomics and metabolic pathway networks from human colorectal cancers, adjacent mucosa, and stool. Cancer Metab. 2016;4:11. doi: 10.1186/s40170-016-0151-y. Published online 016 Jun 6. doi:10.1186/s40170-016-0151-y. [DOI] [PMC free article] [PubMed] [Google Scholar]
- 21.Komatsu S, Yanaka N, Matsubara K, Kato N. Antitumor effect of vitamin B6 and its mechanisms. Biochim Biophys Acta. 2003;1647:127–130. doi: 10.1016/s1570-9639(03)00076-1. [DOI] [PubMed] [Google Scholar]
- 22.Zhang P, Suidasari S, Hasegawa T, Yanaka N, Kato N. Vitamin B₆activates p53 and elevates p21 gene expression in cancer cells and the mouse colon. Oncol Rep. 2014;31:2371–2376. doi: 10.3892/or.2014.3073. [DOI] [PubMed] [Google Scholar]
- 23.Kayashima T, Tanaka K, Okazaki Y, Matsubara K, Yanaka N, Kato N. Consumption of vitamin B6 reduces colonic damage and protein expression of HSP70 and HO-1, the anti-tumor targets, in rats exposed to 1,2-dimethylhydrazine. Oncol Lett. 2011;2:1243–1246. doi: 10.3892/ol.2011.370. [DOI] [PMC free article] [PubMed] [Google Scholar]
- 24.Ajouz H, Mukherji D, Shamseddine A. Secondary bile acids: an under-recognized cause of colon cancer. World J Surg Oncol. 2014;12:164. doi: 10.1186/1477-7819-12-164. [DOI] [PMC free article] [PubMed] [Google Scholar]
- 25.Payne CM, Bernstein C, Dvorak K. Hydrophobic bile acids, genomic instability, Darwinian selection, and colon carcinogenesis. Clin Exp Gastroenterol. 2008;1:19–47. doi: 10.2147/ceg.s4343. [DOI] [PMC free article] [PubMed] [Google Scholar]
- 26.Okazaki Y, Utama Z, Suidasari S, Zhang P, Tanaka N, Tomotake H, et al. Consumption of vitamin B(6) reduces fecal ratio of lithocholic acid to deoxycholic acid, a risk factor for colon cancer, in rats fed a high-fat diet. J Nutr Sci Vitaminol. 2012;5:366–370. doi: 10.3177/jnsv.58.366. [DOI] [PubMed] [Google Scholar]
- 27.Bayerdörffer E, Mannes GA, Richter WO, Ochsenkühn T, Wiebecke B, Köpcke W, et al. Increased serum deoxycholic acid levels in men with colorectal adenomas. Gastroentero-logy. 1993;104:145–151. doi: 10.1016/0016-5085(93)90846-5. [DOI] [PubMed] [Google Scholar]
- 28.Jain M, Nilsson R, Sharma S, Madhusudhan N, Kitami T, Souza AL, et al. Metabolite profiling identifies a key role for glycine in rapid cancer cell proliferation. Science. 2012;336:1040. doi: 10.1126/science.1218595. [DOI] [PMC free article] [PubMed] [Google Scholar]
- 29.Locasale JW. Serine, glycine and one-carbon units: cancer metabolism in a full circle. Nat Rev Cancer Aug. 2013;13:572–583. doi: 10.1038/nrc3557. [DOI] [PMC free article] [PubMed] [Google Scholar]
- 30.Zhang WC, Shih-Chang N, Yang H, Rai A, Umashankar S, Ma S, et al. Glycine decarboxylase activity drives non-small cell lung cancer tumor-initiating cells and tumorigenesis. Cell. 2012;148:259–272. doi: 10.1016/j.cell.2011.11.050. [DOI] [PubMed] [Google Scholar]
- 31.Paterson AC, Macrae FA, Pizzey C, Baldwin GS, Shulkes A. Circulating gastrin concentrations in patients at increased risk of developing colorectal carcinoma. J Gastroenterol Hepatol. 2014;29:480–486. doi: 10.1111/jgh.12417. [DOI] [PubMed] [Google Scholar]
- 32.Tour S, Sugiura Y, Kubo A, Ohmura M, Karakawa S, Mizukoshi T. Microscopic imaging mass spectrometry assisted by on-tissue chemical derivatization for visualizing multiple amino acids in human colon cancer xenografts. Proteomics. 2014;14:810–819. doi: 10.1002/pmic.201300041. [DOI] [PubMed] [Google Scholar]
- 33.Andreyev HJ, Norman AR, Cunningham D, Oates J, Dix BR, Iacopetta BJ, et al. Kirsten ras mutations in patients with colorectal cancer: the ‘RASCAL II’ study. J Cancer. 2001;85:692–696. doi: 10.1054/bjoc.2001.1964. [DOI] [PMC free article] [PubMed] [Google Scholar]
- 34.Grubben MJ, Nagengast FM, Katan MB, Peters WH. The glutathione biotransformation system and colorectal cancer risk in humans. Scand J Gastroenterol Suppl. 2001:68–76. doi: 10.1080/003655201753265479. [DOI] [PubMed] [Google Scholar]
- 35.Haug U, Poole EM, Xiao L, Curtin K, Duggan D, Hsu L, et al. Glutathione peroxidase tagSNPs: Associations with rectal cancer but not with colon cancer. Genes Chromosomes Cancer. 2012;51:598–605. doi: 10.1002/gcc.21946. [DOI] [PMC free article] [PubMed] [Google Scholar]
- 36.Jankova L, Robertson G, Chan C, Tan KL, Kohonen-Corish M, Fung CL-S, et al. Glutathione S-transferase Pi expression predicts response to adjuvant chemotherapy for stage C colon cancer: a matched historical control study. BMC Cancer. 2012;12:196. doi: 10.1186/1471-2407-12-196. [DOI] [PMC free article] [PubMed] [Google Scholar]