

Abstract
Purpose
The Microarray Innovations in Leukemia study assessed the clinical utility of gene expression profiling as a single test to subtype leukemias into conventional categories of myeloid and lymphoid malignancies.
Methods
The investigation was performed in 11 laboratories across three continents and included 3,334 patients. An exploratory retrospective stage I study was designed for biomarker discovery and generated whole-genome expression profiles from 2,143 patients with leukemias and myelodysplastic syndromes. The gene expression profiling–based diagnostic accuracy was further validated in a prospective second study stage of an independent cohort of 1,191 patients.
Results
On the basis of 2,096 samples, the stage I study achieved 92.2% classification accuracy for all 18 distinct classes investigated (median specificity of 99.7%). In a second cohort of 1,152 prospectively collected patients, a classification scheme reached 95.6% median sensitivity and 99.8% median specificity for 14 standard subtypes of acute leukemia (eight acute lymphoblastic leukemia and six acute myeloid leukemia classes, n = 693). In 29 (57%) of 51 discrepant cases, the microarray results had outperformed routine diagnostic methods.
Conclusion
Gene expression profiling is a robust technology for the diagnosis of hematologic malignancies with high accuracy. It may complement current diagnostic algorithms and could offer a reliable platform for patients who lack access to today's state-of-the-art diagnostic work-up. Our comprehensive gene expression data set will be submitted to the public domain to foster research focusing on the molecular understanding of leukemias.
INTRODUCTION
Microarray studies have identified gene expression signatures associated with distinct clinical subtypes of leukemia.1 In studies of both pediatric and adult acute lymphoblastic leukemia (ALL), patients can be classified according to specific gene expression profiles.2–10 Characteristic signatures, for example, those identified in acute myeloid leukemia (AML) subtypes with t(15;17), t(8;21), inv(16), or t(11q23)/MLL, have been confirmed not only with different DNA oligonucleotide microarray designs,11,12 but also by using a principally different microarray technology.13 Furthermore, gene expression analyses of nearly 1,000 patients led to the discovery of distinct expression signatures, not only specific among adult acute and chronic leukemia subtypes, but also in comparison to nonleukemia and healthy bone marrow specimens.14
Because microarray assays can analyze the expression of multiple genes in parallel, they have been proposed as a robust test method for diagnostic usage in a clinical laboratory. However, published data in this area have been derived from relatively small, single-center studies involving archival samples. Here, we report results from 3,334 patients who were analyzed as part of an international study group formed around the European LeukemiaNet (ELN) in 11 laboratories across three continents (seven from the ELN, three from the United States, and one in Singapore). The collaborative Microarray Innovations in Leukemia (MILE) study program was designed to assess the clinical accuracy of gene expression profiles (compared with current routine diagnostic work-up) of 16 acute and chronic leukemia subclasses, myelodysplastic syndromes (MDSs), and a so-called “none of the target classes” control group that included nonmalignant disorders and normal bone marrow.
METHODS
Study Design
There were two stages in the MILE research study: a retrospective biomarker discovery phase (stage I) using commercially available whole-genome microarrays (HG-U133 Plus 2.0; Affymetrix, Santa Clara, CA) and an independent validation phase (stage II) that was performed in a prospective manner using a newly designed custom chip (AmpliChip Leukemia; Roche Molecular Systems, Pleasanton, CA). Before each stage of the study, designated laboratory operators at each site were trained on the corresponding sample preparation protocol and had demonstrated proficiency in the technology.15 The individual steps of the sample preparation workflow are available online. All samples in this study were obtained from untreated patients at the time of diagnosis. Cells used for microarray analysis were collected from the purified fraction of mononuclear cells after Ficoll density centrifugation. The study design adhered to the tenets of the Declaration of Helsinki and was approved by the ethics committees of the participating institutions before its initiation. The sponsor collected the anonymized patient data and performed the final statistical analysis. All authors had full access to both the primary local microarray data and the final analysis.
Microarray Data Preprocessing and Exploratory Analyses
Data preprocessing included a summarization and quantile normalization step to generate probe set level signal intensities for each microarray experiment and was performed as previously described.16 Data visualization and exploratory analyses were performed with Partek Genomics Suite software version 6.3 (Partek, St Louis, MO) and R software version 2.5.1 (http://www.r-project.org), including the Affy, MADE4, and Heatplus packages.17 A margin tree graph was generated following a method previously established in the use of high-dimensional classification of cancer microarray data.18 The margin tree is learned in an unbiased manner and emerges naturally in a mathematical procedure. All microarray raw data were deposited in National Center for Biotechnology Information's Gene Expression Omnibus database (http://www.ncbi.nlm.nih.gov/geo/) under series accession number GSE13204.19
Custom Chip Design
The AmpliChip Leukemia research microarray was specifically customized for the classification of leukemias.20 The chip contained 1,480 distinct probe sets with 11-μm feature size. The source of the probe set design was based on the commercially available Affymetrix HG-U133 Plus 2.0 microarray. One thousand four hundred fifty-seven probe sets were used for generating normalized signal intensities of disease-related genes, and 23 probe sets interrogated control sequences and housekeeping genes. Three hundred ninety-eight probe sets were tiled in triplets to increase the robustness of the algorithm performance.
Algorithm Training for Classification Analysis
For multiclass classification, an all-pairwise approach was performed using trimmed mean of differences between perfect match and mismatch intensities with quantile normalization (DQN) signals.16 For 18 classes, there were 153 distinct class pairs. For every class pair, a linear binary classifier was formed with support vector machines.21,22 For this classifier, n was the number of used probe sets. The classifier for class pair (i, j) (i < j) consisted of (n + 1) coefficients, w[0; i, j], w[1; i, j], …, w[n; i, j]. Normalized expression signals were denoted by x[1], …, x[n]. The decision function for class pair (i, j) was f(x; i, j) = w[0; i, j] + w[1; i, j] * x[1] + … + w[n; i, j] * x[n]. If f(x; i, j) > 0, a vote was added to class i; if f(x; i, j) < 0, a vote was added to class j. If f(x; i, j) = 0, 0.5 votes were added to class i, and 0.5 votes were added to class j. This process was repeated for all class pairs to obtain the votes for all classes. If there was a unique class with the maximal vote, the call was this particular class. If there was a tie of two or more classes with the maximal vote, an indeterminable call was assigned. The step of probe set selection was included in every cross-validation run and was performed to select the top 100 differentially expressed probe sets with the maximal absolute values of t statistic for every class pair. Subsequently, the union of the selected probe sets of all class pairs was used for every binary classifier.
RESULTS
Marker Discovery Phase Using Whole-Genome Microarrays
During stage I of the study, 2,143 whole-genome microarray analyses were performed. Each center had previously diagnosed the samples as part of their daily routine diagnostic work-up, using their local gold standard diagnostic methods, including cytomorphology, immunophenotyping, cytogenetics, and other molecular genetic tests. Each specimen then was assigned based on these previous diagnostic test reports to one of the 18 MILE study categories (C1 to C18) for microarray analysis. Seventeen classes had been selected as representing standard subclasses of acute and chronic leukemias, as well as MDS. Class 18 included healthy bone marrow specimens and nonleukemia conditions, such as megaloblastic anemia, hemolysis, iron deficiency, or idiopathic thrombocytopenic purpura, and was considered to be none of the target classes.
Despite strict quality criteria, 47 samples (2.2%) had to be excluded as a result of low technical quality of the gene expression profiles. The remaining 2,096 samples are listed in Table 1. The samples were not equally distributed among the participating laboratories but were variably contributed depending on each center's expertise (eg, center 10 included chronic lymphocytic leukemia [CLL] specimens and center 7 analyzed cases of pediatric leukemias). Consistent with the actual incidence of the respective categories, lower sample numbers were submitted for certain uncommon subtypes, including mature B-cell ALL with t(8;14) (C1) and AML with inv(16)/t(16;16) (C11). All other classes comprised more than 30 samples each (range, 36 to 448 samples).
Table 1.
Overview of Stage I Samples
| Class | Diagnosis | Study Center (No. of samples) |
Total No. of Samples | ||||||||||
|---|---|---|---|---|---|---|---|---|---|---|---|---|---|
| 1 | 2 | 3 | 4 | 5 | 6 | 7 | 8 | 9 | 10 | 11 | |||
| C1 | Mature B-ALL with t(8;14) | 2 | 2 | 2 | 5 | 1 | 1 | 13 | |||||
| C2 | Pro-B-ALL with t(11q23)/MLL | 6 | 12 | 10 | 1 | 33 | 5 | 1 | 2 | 70 | |||
| C3 | c-ALL/pre-B-ALL with t(9;22) | 27 | 10 | 15 | 7 | 8 | 39 | 4 | 12 | 122 | |||
| C4 | T-ALL | 42 | 1 | 19 | 17 | 4 | 38 | 44 | 9 | 174 | |||
| C5 | ALL with t(12;21) | 16 | 23 | 1 | 18 | 58 | |||||||
| C6 | ALL with t(1;19) | 5 | 11 | 2 | 9 | 3 | 1 | 5 | 36 | ||||
| C7 | ALL with hyperdiploid karyotype | 1 | 14 | 2 | 14 | 2 | 7 | 40 | |||||
| C8 | c-ALL/pre-B-ALL without t(9;22) | 50 | 29 | 28 | 2 | 59 | 42 | 3 | 24 | 237 | |||
| C9 | AML with t(8;21) | 7 | 1 | 2 | 13 | 5 | 1 | 11 | 40 | ||||
| C10 | AML with t(15;17) | 2 | 2 | 8 | 5 | 4 | 3 | 13 | 37 | ||||
| C11 | AML with inv(16)/t(16;16) | 6 | 4 | 3 | 4 | 6 | 3 | 2 | 28 | ||||
| C12 | AML with t(11q23)/MLL | 4 | 4 | 5 | 6 | 17 | 1 | 1 | 38 | ||||
| C13 | AML with normal karyotype + other abnormalities | 2 | 60 | 1 | 12 | 63 | 117 | 19 | 9 | 41 | 27 | 351 | |
| C14 | AML complex aberrant karyotype | 4 | 3 | 2 | 28 | 2 | 1 | 6 | 2 | 48 | |||
| C15 | CLL | 15 | 35 | 41 | 81 | 45 | 32 | 199 | 448 | ||||
| C16 | CML | 5 | 44 | 15 | 12 | 76 | |||||||
| C17 | MDS | 28 | 71 | 3 | 1 | 56 | 44 | 3 | 206 | ||||
| C18 | Non-leukemia and healthy bone marrow | 19 | 19 | 17 | 16 | 3 | 74 | ||||||
| Total | 2,096 | ||||||||||||
NOTE. Two thousand ninety-six high-quality analyses were performed by 11 different study centers from seven countries across three continents. Eighteen diagnostic gold standard categories are given by their class subtype labels of C1 to C18 and are listed for each participating laboratory (laboratories 1 to 11).
Abbreviations: B-ALL, B-cell acute lymphoblastic leukemia; MLL, myeloid/lymphoid or mixed-lineage leukemia; pre, precursor; c-ALL, childhood acute lymphoblastic leukemia; T-ALL, T-cell acute lymphoblastic leukemia; ALL, acute lymphoblastic leukemia; AML, acute myeloid leukemia; CLL, chronic lymphocytic leukemia; CML, chronic myelogenous leukemia; MDS, myelodysplastic syndrome.
Several approaches were selected to perform exploratory data analyses. First, supervised hierarchical clustering was performed to confirm whether the selected classes would indeed harbor distinct gene expression signatures for the 2,096 whole-genome gene expression profiles. Strong differences were observed in the respective signatures for classes C1 to C18 (Fig 1).
Fig 1.

Supervised hierarchical clustering. The exploratory whole-genome clustering analysis was performed for all classes (C1 to C18 in ascending order) including 2,096 samples from stage I. For every class pair, the top 100 differentially expressed probes sets with the largest absolute values of t statistic were selected. The union of these sets contained 3,556 probe sets used in the clustering.
Next, a method developed by Tibshirani and Hastie,18 established for high-dimensional classification of cancer microarray data, was applied. This method not only produces a classifier, but also gives output graphs, so-called margin trees, that indicate the relatedness of different disease entities.18 A hierarchical data tree applied to our data set of 2,096 samples is shown in Figure 2, where two major branches can be observed, one that contains mainly the B-lineage ALL categories and a second larger branch that contains the myeloid and chronic leukemias. MDS samples and nonleukemia specimens were also located in this larger branch. The binary decision tree and the hierarchical relationship among the classes can be interpreted in a top-down manner and demonstrated a meaningful organization of the 16 leukemia classes and MDS on the basis of their respective gene expression signatures.
Fig 2.

Exploratory margin tree analysis. Margin tree classification is a supervised multiclass support vector machine classification method.18 The margin tree program was applied to the stage I data set of 2,096 samples, characterized by their 18 class subtype labels (C1 to C18), and was based on 54,630 probe sets. B-ALL, B-cell acute lymphoblastic leukemia; MLL, myeloid/lymphoid or mixed-lineage leukemia; pre, precursor; c-ALL, childhood acute lymphoblastic leukemia; T-ALL, T-cell acute lymphoblastic leukemia; ALL, acute lymphoblastic leukemia; AML, acute myeloid leukemia; kt., karyotype; abn., abnormality; CLL, chronic lymphocytic leukemia; CML, chronic myelogenous leukemia; MDS, myelodysplastic syndrome.
The series of 1,292 acute leukemia samples represented in the stage I cohort were further evaluated for gene signatures that would serve as a so-called virtual immunophenotype. Fourteen distinct types of acute leukemias (C1 to C14) are displayed in a heat map of the genes encoding 21 differentiation antigens routinely used for flow cytometry (Fig 3A). For each of the three major lineages involved in leukemia (B cells, T cells, and myeloid cells), distinct clusters were observed based on the gene expression signature of the corresponding antigens. Subtype-specific patterns were identifiable, for example, the low expression of HLA-DR α and γ antigens in AML with t(15;17) (C10). Such subtype-specific patterns became even more obvious when virtual immunophenotype data were represented as a series of individual box plots for each of the 14 classes of acute leukemias (Fig 3B).
Fig 3.


Virtual immunophenotypes for 1,292 acute leukemia specimens from stage I of the Microarray Innovations in Leukemia study. (A) Microarray gene expression signal intensities of 21 differentiation antigens currently tested in flow cytometry for the diagnosis of leukemia represented by 32 probe sets. (B) Gene expression intensities for CD3G, CD19, CD33, and HLA-DRA. Each dot represents the data from a single microarray profile. B-ALL, B-cell acute lymphoblastic leukemia; T-ALL, T-cell acute lymphoblastic leukemia; AML, acute myeloid leukemia.
Algorithm Training for Classification Analysis
The classification performance of retrospective samples of stage I was investigated next by developing a prediction algorithm based on linear discriminant classification. To estimate the performance of the classifiers, three independent 30-fold cross-validations were used. For every possible pair of comparisons between the 18 distinct classes, the top 100 probe sets with the largest absolute values of t statistics were selected. The union of all selected probe sets was then used for subsequent classification of all class pairs.
When all 2,096 samples from stage I were included, the classification analysis of their whole-genome gene expression profiles demonstrated that overall, in 92.2% of samples, the gene expression classification was concordant with the initial gold-standard diagnosis (99.6% specimens with a unique call). This means that a small number of samples received indeterminable calls as a result of ties of majority votes of the classifier (Table 2). In seven of the 18 classes, the concordance was ≥ 94.6%. As detailed in the confusion matrix, lower sensitivities in predicting leukemia types were observed, in particular, for classes C1, C7, C8, C12, and C14. This can largely be explained by the biologic heterogeneity within the class and the lack of standardized gold-standard definitions. However, it is notable that all analyzed classes showed specificities greater than 98.1% and that, overall, all 18 analyzed classes could be predicted with a median sensitivity of 92.1% and a median specificity of 99.7%.
Table 2.
Whole-Genome Classification Confusion Matrix
| GS/Call | Class Prediction |
Average No. of IDC As a Result of Ties of Majority Votes | Total No. of Specimens in Every Class | CR | Sensitivity for Called Specimens | Specificity for Called Specimens | |||||||||||||||||
|---|---|---|---|---|---|---|---|---|---|---|---|---|---|---|---|---|---|---|---|---|---|---|---|
| C1 | C2 | C3 | C4 | C5 | C6 | C7 | C8 | C9 | C10 | C11 | C12 | C13 | C14 | C15 | C16 | C17 | C18 | ||||||
| C1/GS | 9.3* | — | — | — | — | — | — | 0.7† | — | — | — | — | 0.3† | — | — | — | 0.3† | 1† | 1.3 | 13 | 0.897 | 0.800 | 0.999 |
| C2/GS | — | 70* | — | — | — | — | — | — | — | — | — | — | — | — | — | — | — | — | 0 | 70 | 1.000 | 1.000 | 0.998 |
| C3/GS | — | — | 114.3* | — | — | — | 0.3† | 7.3† | — | — | — | — | — | — | — | — | — | — | 0 | 122 | 1.000 | 0.937 | 0.997 |
| C4/GS | — | — | — | 166.3* | — | — | — | 1.7† | — | — | — | — | 4† | — | — | — | 0.3† | 0.7† | 1 | 174 | 0.994 | 0.961 | 0.997 |
| C5/GS | — | — | — | — | 53.7* | — | — | 4.3† | — | — | — | — | — | — | — | — | — | — | 0 | 58 | 1.000 | 0.925 | 0.997 |
| C6/GS | — | 2† | — | — | — | 33* | — | 1† | — | — | — | — | — | — | — | — | — | — | 0 | 36 | 1.000 | 0.917 | 1.000 |
| C7/GS | — | — | — | — | — | — | 30.3* | 9.7† | — | — | — | — | — | — | — | — | — | — | 0 | 40 | 1.000 | 0.758 | 0.995 |
| C8/GS | 1† | 3† | 5.3† | 1† | 6† | — | 10.7† | 205.3* | — | — | — | — | 0.3† | 1† | 1† | — | 1.7† | — | 0.7 | 237 | 0.997 | 0.869 | 0.985 |
| C9/GS | — | — | — | — | — | — | — | — | 40* | — | — | — | — | — | — | — | — | — | 0 | 40 | 1.000 | 1.000 | 1.000 |
| C10/GS | — | — | — | — | — | — | — | — | — | 35* | — | — | 1† | — | — | — | 1† | — | 0 | 37 | 1.000 | 0.946 | 1.000 |
| C11/GS | — | — | — | — | — | — | — | — | — | — | 28* | — | — | — | — | — | — | — | 0 | 28 | 1.000 | 1.000 | 1.000 |
| C12/GS | — | — | — | 1† | — | — | — | — | — | — | — | 32* | 5† | — | — | — | — | — | 0 | 38 | 1.000 | 0.842 | 0.999 |
| C13/GS | 1† | — | — | 4.3† | — | — | — | 3† | — | 1† | — | 2† | 311.3* | 9.7† | 1.3† | 0.7† | 15.3† | — | 1.3 | 351 | 0.996 | 0.890 | 0.982 |
| C14/GS | — | — | — | — | — | — | — | — | — | — | — | — | 9.3† | 35.7* | — | — | 2.7† | — | 0.3 | 48 | 0.993 | 0.748 | 0.995 |
| C15/GS | — | — | — | — | — | — | — | — | — | — | — | — | 0.7† | — | 446* | — | 0.3† | — | 1 | 448 | 0.998 | 0.998 | 0.998 |
| C16/GS | — | — | 1† | — | — | — | — | — | — | — | — | — | — | — | — | 72* | 0.3† | 2.7† | 0 | 76 | 1.000 | 0.947 | 0.999 |
| C17/GS | — | — | — | — | — | — | — | — | — | — | — | — | 11† | — | — | — | 184.3* | 7.7† | 3 | 206 | 0.985 | 0.908 | 0.981 |
| C18/GS | — | — | — | — | — | — | — | 1† | — | — | — | — | — | — | 1† | 1† | 14† | 57* | 0 | 74 | 1.000 | 0.770 | 0.994 |
NOTE. Classification prediction results for 2,096 samples from stage I as analyzed by three 30-fold cross validations. Gold standard classes are given in rows C1/GS to C18/GS; the columns C1 to C18 list the average numbers of calls, rounded with up to 1 decimal place, for every class in three independent runs of cross-validations. This model uses trimmed mean of differences between perfect match and mismatch intensities with quantile normalization (DQN) signal intensities obtained from HG-U133 Plus 2.0 microarrays.
Abbreviations: IDC, indeterminable calls; CR, call rate [(No. of specimens–IDC)/No. of specimens]; GS, gold standard.
Values indicate correct prediction results.
Values represent misclassifications for each class.
Classification Algorithm Testing on an Independent Patient Cohort
After completion of stage I, the participating laboratories prospectively collected 1,191 samples as an independent validation cohort. Similar to stage I, only samples were included where a full gold standard diagnostic work-up had been completed by the laboratories so that each specimen would be grouped into one of the 18 study classes before microarray analysis. Experiments were performed using a standardized procedure and a customized chip, the AmpliChip Leukemia microarray. Of the 1,191 stage II gene expression profiles, 1,152 (96.7%) passed the quality criteria and were further processed for microarray classification. When using a prediction model, trained on the whole-genome gene expression profiles from stage I, the overall accuracy for all 18 classes of this independent test cohort using the custom chip was 88.1% (overall call rate, 99.6%). Similar to the stage I data set, miscalls were predominantly observed for the interface of C7/C8 in ALL and in the MDS-AML continuum. The predicted accuracies for CLL, chronic myelogenous leukemia, and MDS in stage II were 98.7%, 93.0%, and 81.5%, respectively.
When focused on an acute leukemia–type diagnostic algorithm, the overall prediction accuracy for all called samples markedly increased to 91.5% (overall call rate, 98.1%). As shown by the confusion matrix in Table 3, 100% correct predictions were observed for five leukemia types (C1, C2, C6, C9, and C11), each of which represented leukemias with discrete disease-defining fusion genes. Lower accuracies were observed for the interface of C7/C8 in ALL, as well as for more intrinsically heterogeneous subtypes such as C12 and C14 in AML. Nonetheless, eight of the 14 represented acute leukemia types were concordant with the gold standard in ≥ 95.0% of the analyses. When summarized over all acute leukemia subtypes, this focused classification scheme resulted in a 95.6% median sensitivity and a 99.8% median specificity for the eight ALL and six AML classes included in the classifier (C1 to C14, n = 693). This result reinforces the strength of microarray technology, which offers high positive prediction accuracy based on a standardized, robust, and objective molecular assay.
Table 3.
Independent Testing Set of Acute Leukemias
| GS/Call | Class Prediction |
Average No. of IDC As a Result of Ties of Majority Votes | Total No. of Specimens in Every Class | CR | Sensitivity for Called Specimens | Specificity for Called Specimens | |||||||||||||
|---|---|---|---|---|---|---|---|---|---|---|---|---|---|---|---|---|---|---|---|
| C1 | C2 | C3 | C4 | C5 | C6 | C7 | C8 | C9 | C10 | C11 | C12 | C13 | C14 | ||||||
| C1/GS | 4* | — | — | — | — | — | — | — | — | — | — | — | — | — | 1 | 5 | 0.800 | 1.000 | 0.999 |
| C2/GS | — | 23* | — | — | — | — | — | — | — | — | — | — | — | — | 0 | 23 | 1.000 | 1.000 | 0.998 |
| C3/GS | — | — | 53* | — | — | — | — | 8† | — | — | — | — | 1† | — | 0 | 62 | 1.000 | 0.855 | 0.995 |
| C4/GS | — | — | — | 75* | 1† | — | — | 1† | — | — | — | — | 1† | — | 1 | 79 | 0.987 | 0.962 | 0.992 |
| C5/GS | — | — | — | — | 59* | — | — | 5† | — | — | — | — | — | — | 0 | 64 | 1.000 | 0.922 | 0.995 |
| C6/GS | — | — | — | — | — | 10* | — | — | — | — | — | — | — | — | 0 | 10 | 1.000 | 1.000 | 0.997 |
| C7/GS | — | — | — | — | — | — | 22* | 12† | — | — | — | — | — | — | 1 | 35 | 0.971 | 0.647 | 0.989 |
| C8/GS | 1† | 1† | 2† | — | 2† | 2† | 7† | 141* | — | — | — | — | — | — | 2 | 158 | 0.987 | 0.904 | 0.950 |
| C9/GS | — | — | — | — | — | — | — | — | 16* | — | — | — | — | — | 0 | 16 | 1.000 | 1.000 | 1.000 |
| C10/GS | — | — | — | — | — | — | — | — | — | 19* | — | — | 1† | — | 0 | 20 | 1.000 | 0.950 | 0.998 |
| C11/GS | — | — | — | — | — | — | — | — | — | — | 20* | — | — | — | 0 | 20 | 1.000 | 1.000 | 1.000 |
| C12/GS | — | — | — | 1† | — | — | — | — | — | — | — | 15* | 1† | — | 0 | 17 | 1.000 | 0.882 | 1.000 |
| C13/GS | — | — | 1† | 3† | — | — | — | — | — | 1† | — | — | 148* | 1† | 6 | 160 | 0.963 | 0.961 | 0.985 |
| C14/GS | — | — | — | 1† | — | — | — | — | — | — | — | — | 4† | 17* | 2 | 24 | 0.917 | 0.773 | 0.998 |
NOTE. Classification prediction results for 693 prospectively collected acute leukemia samples from stage II. Gold standard classes are given in rows C1/GS to C14/GS; the prediction results are displayed for each sample in columns C1 to C14.
Abbreviations: IDC, indeterminable calls; CR, call rate [(No. of specimens–IDC)/No. of specimens]; GS, gold standard.
Values indicate correct prediction results.
Values represent misclassifications for each class.
During the process of clarifying discrepant results (ie, comparing microarray classifier predictions against the gold-standard diagnoses submitted to the study database), in 51 (7.4%) of 693 acute leukemia samples, discrepancies could be resolved. A first category of 22 (43%) of 51 discrepant samples were explained either because of erroneous entries into case report forms or wrong sample labels (n = 13, 25%) or because the respective diagnoses were revised after central independent expert review of karyotypes using the definition of AML with complex aberrant karyotypes from Schoch et al23 (n = 9, 18%).
A second category of 29 (57%) of 51 discrepant samples could be interpreted as samples in which the chip-based prediction had outperformed the laboratories' own gold standard diagnostic result (overall, 29 of 693 samples; 4.2%). These samples were split between specimens in which subsequent retesting of leftover material confirmed the predicted acute leukemia subtype as classified by the microarray (n = 14) and specimens in which re-evaluation of initial diagnostic reports including morphology or DNA index values led to the confirmation of the microarray classification result (n = 15). More detailed information on the discrepant results analyses performed on these samples is available online (Appendix Tables A1-A3 and Figures A1-A4, online only).
DISCUSSION
In 2005, the International MILE Study Group was formed around the ELN (Gene Expression Profiling Working Group) in 11 laboratories across three continents. In two stages, the clinical accuracy of gene expression profiles of 16 acute and chronic leukemia subclasses, MDS, and a so-called “none of the target classes” control group was compared with current routine diagnostic work-up in 3,334 patients. Gold standard diagnostic methods were not standardized between centers. Each center integrated the available results from their own laboratory workflow and assigned each sample into one of the 18 MILE study microarray categories.
In stage I of the study, only 2.2% of samples failed the strict quality criteria, leaving 2,096 of 2,143 samples to be used in the training of a robust diagnostic classification algorithm. As demonstrated by various exploratory data analyses, each of the 18 diagnostic categories was characterized by a specific underlying gene expression program. The accuracy of this training cohort was estimated by cross-validation and was 92.2% for the 18 classes (median specificity, 99.7%). In seven of the 18 classes, the concordance was ≥ 94.6%. A high prediction precision of 100% was observed, in particular, for the group of acute leukemias with specific chromosomal aberrations [eg, as demonstrated for pro-B-ALL with t(11q23)/MLL or the core binding factor leukemias AML with t(8;21) or AML with inv(16)/t(16;16)]. Lower sensitivities were seen in entities with biologic heterogeneity within the class (eg, AML with a complex aberrant karyotype [74.8%] or ALL with a hyperdiploid karyotype [75.8%]). However, it is notable that all analyzed classes showed specificities greater than 98.1% and that, overall, all 18 analyzed classes could be predicted with a median sensitivity of 92.1% and a median specificity of 99.7%. Thus, in terms of sensitivity and specificity, the gene expression results alone compared favorably with the laboratories' own gold-standard classification.
The potential clinical utility of microarray-based diagnostics was then validated in stage II including another 1,152 patients, a cohort that represented an independent and blinded validation set for the classification algorithms developed in stage I. Overall, in stage II, the observed accuracy of the classifier prediction across all 18 classes was 88.1%. The accuracy increased to 91.5% when focused on acute leukemias, representing all 14 distinct classes. In eight of the 14 represented acute leukemia classes, microarray diagnoses were concordant with the gold standard diagnoses in ≥ 95.0% of the analyses.
To our knowledge, this is thus far the largest gene expression microarray profiling study in hematology and oncology, and it clearly underlines the robust performance of this method and demonstrates the possibility of completely standardized laboratory procedures combined with sophisticated data algorithms. This is in contrast to other, far more subjective methods routinely used for leukemia diagnosis today, such as cytomorphology and metaphase cytogenetics. The next step would now be an objective and unbiased discussion on how to position microarray technology in a routine diagnostic workflow and whether it is suitable to helpfully support or even replace some of the existing gold-standard techniques. For example, an array-based test cannot, in all cases, replace multiparameter flow cytometry or reverse transcriptase polymerase chain reaction–based detection of molecular fusion genes, which is routinely applied to define the starting point for clinically relevant detection of minimal residual disease.24,25
In one possible scenario, one could restrict the microarray technique to the classification of acute leukemias because CLL and chronic myelogenous leukemia are readily diagnosed by standard immunophenotyping, cytogenetics, and molecular tests. An acute leukemia classification microarray may then have utility in patients for whom a conventional cytogenetic analysis is not available, either because of no analyzable mitoses or poor quality of banded chromosomes.26,27
Although our study concept had to define up front the most necessary leukemia entities and not all recurrent cytogenetic subtypes according to the new WHO classification of 200828 were represented by the actual data set, most subtypes with current clinical relevance are covered. As a further intended use, this microarray technique may also serve to classify leukemia in developing countries that currently lack expertise to perform the current labor-intensive and sophisticated diagnostic approaches.
Finally, the investigators of the MILE study submitted their gene expression database to the public domain (Gene Expression Omnibus Accession No. GSE13204) to foster research elucidating the molecular understanding of leukemias. Future refinements need to include additional signatures for prognostically important subsets of patients with AML with normal cytogenetics.12,13,29,30 Such signatures have already been tentatively identified by a number of groups.31–37 Microarray analysis can even be applied to investigate expression signatures of other novel markers such as WT1,38 detect a specific pattern for RUNX1-mutated AML,39 and discover predictive signatures for response to both currently used and novel targeted treatment regimens.
Acknowledgment
We acknowledge the excellent technical assistance of Sonja Schindela, Luca Trentin, Marta Campo Dell'Orto, Traci Lyn Toy, W. Kent Williams, Letha Phillips, Verena Novak, Simona Tavolaro, Monica Messina, Véronique Pantesco, Eva Lumbreras, William Overman, Dr Li Cai, Cecilia S. N. Kwok, Pei Tee Huan, and Dr Lu Yi. We further thank Dr Xiaoying Chen and Dr Philip X. Xiang for data analysis support and generation of the Gene Expression Omnibus microarray data set. We are grateful to Dr Jeff Lawrence, Karen Yu, James Zhe Sun, and Li Qiu for support throughout the conduct of the study and appreciate the work of Dr Wen Wei, Nang Tan, and Julie Tsai in assay development and study logistics. We also appreciate the help of Dr Claudia Haferlach for independent expert review of karyotypes, as well as Dr Wolfgang Kern's and Dr Susanne Schnittger's support in reviewing immunophenotypes and providing guidance on the sampling process for the study, respectively. For providing samples through multiple networks from France, we thank Dr Claude Preudhomme, Lille, and Dr Pascale Cornillet-Lefèvre, Reims for ALFA and GOELAMS AML samples and annotations, Dr Frédéric Davi, AP-HP La Pitié-Salpêtrière and Dr Florence Cymbalista, AP-HP Avicenne, for “Groupe LLC” CLL samples and annotations, and Dr Elizabeth Macintyre, AP-HP Necker, for GRAALL adult acute lymphoblastic leukemia samples and annotations. Additional participating investigators included Dr Evelyn S. Koay (National University of Singapore) and Dr James R. Downing (St Jude Children's Research Hospital, Memphis, TN).
Appendix
Summary Information for Four Virtual Immunophenotype Markers
As shown in Figure 3A, the clustering analysis displays the microarray gene expression signal intensities of differentiation antigens currently tested in flow cytometry for the diagnosis of leukemia. The heat map includes the gene expression of 21 markers for n = 1,292 acute leukemia specimens from stage I of the MILE study. The antigens and their corresponding Affymetrix probe set identifiers are given in rows and individual gene expression profiles of the samples are given in columns. The samples are distributed across the 14 classes of adult and pediatric acute leukemias and are displayed in ascending order according to their cell lineage type. The signal used was DQN1. Pearson's dissimilarity was used as distance measurement. Complete linkage was used to segregate the clusters. High-abundant transcripts are colored in red and low-expressed genes are colored in green. The signal was normalized across samples before clustering.
As shown in Figure 3B, the box-plot analysis displays the microarray gene expression signal intensities of differentiation antigens currently tested in flow cytometry for the diagnosis of leukemia. In each panel, n = 1,292 acute leukemia specimens from stage I of the MILE study are included, and each dot represents the data from a single microarray profile. The samples are presented in series of 14 box-and-whisker plots and are distributed across the 14 classes of adult and pediatric acute leukemias (C1 to C14). In each panel, the gene expression intensities for the markers CD3G, CD19, CD33, and HLA-DRA are given on the Y axis. In each box-and-whisker plot, the median (line), interquartile range, and 10th and 90th percentile values are indicated. CD19 showed broad expression within the B cell leukemias and, as expected, low expression levels in AML with t(8;21) (Class 9; Kita K et al: Blood 80:470-477, 1992; Hurwitz CA: Blood 80:3182-3188, 1992). The panel with CD3-gamma chain clearly visualized the expression of this T-cell specific cell surface antigen, although CD3-epsilon chain is most commonly investigated in immunophenotyping studies. In the acute myeloid leukemia series, a few samples also expressed this T cell marker, which could be interpreted as evidence of biphenotypic features. As expected, CD33 was strongly expressed in the myeloid leukemias but also demonstrated some expression in a few cases of ALL with t(9;22) (Class 3). Lastly, for HLA-DRA a low gene expression was observed in only two classes, T-ALL (Class 4), and AML with t(15;17) (Class 10). Table A1 summarizes underlying statistical parameters for the virtual immunophenotyping panel as shown in Figure 4B. Each marker is summarized by the included number of acute leukemia samples per class (N, Class), mean microarray gene expression signal intensity (Mean), and standard deviation (StdDev). The intensity signal used was Pn.16
Microarray Analysis
The individual steps of the sample preparation workflow, along with modifications and improvements of the methodology as compared to the manufacturer's recommendations, were as follows. All samples were prepared from purified mononuclear cells after Ficoll density gradient centrifugation. Briefly, all patient samples were diluted with an equal amount of sterile phosphate-buffered saline (PBS), and the diluted cell suspension was carefully laid over 15 mL of Ficoll-Paque in a 50-mL conical centrifuge tube. After centrifugation (30 minutes, 400xg, no brakes on), the mononuclear cell layer was found at the interphase and was carefully removed for subsequent washing of the mononuclear cells with buffer. The purified cell pellets then were resuspended and counted. As published elsewhere, 5 million cells yield sufficient total RNA for microarray analysis.20
Of note, previous experience with microarray technology was not mandatory. In fact, four of the 11 laboratories had no previous experience with the Affymetrix gene expression microarray sample preparation assay (centers 1, 9, 10, and 11). For each sample preparation assay for stage I of the study, total RNA was converted into double-stranded cDNA by reverse transcription using a cDNA Synthesis System kit including an oligo(dT)24 – T7 primer (Roche Applied Science, Mannheim, Germany) and Poly-A control transcripts (Affymetrix, Santa Clara, CA). This initial step of the sample preparation protocol did not specify a fixed amount of total RNA but permitted a user-friendly range of 1.0 to 8.0 μg of total RNA input for the cDNA synthesis step. In stage I of the study, a variety of total RNA preparation methods were used, for example, column-based purifications and TRIzol-based preparations (Invitrogen, Carlsbad, CA). The generated cDNA was purified using the GeneChip Sample Cleanup Module (Affymetrix). Labeled cRNA then was generated using the Microarray RNA target synthesis kit (Roche Applied Science) and in vitro transcription labeling nucleotide mix (Affymetrix). The generated cRNA was purified using the GeneChip Sample Cleanup Module (Affymetrix) and quantified using the NanoDrop ND-1000 spectrophotometer (NanoDrop Technologies). For each preparation, 11.0 μg cRNA was fragmented with 5X fragmentation buffer (Affymetrix) in a final reaction volume of 25 μL. Incubation steps during cDNA synthesis, in vitro transcription reaction, and target fragmentation were performed using the Hybex Microarray Incubation System (SciGene) and Eppendorf ThermoStat plus instruments (Eppendorf). Hybridization, washing, staining, and scanning protocols for the HG-U133 Plus 2.0 microarrays were performed on Affymetrix GeneChip instruments (Hybridization Oven 640, Fluidics Station FS450, Scanner GCS3000) as recommended by the manufacturer.
Given that the workflow that was used in stage I of the study was time-consuming and laborious, several modifications were introduced to reduce the complexity of the assay for the second part of the MILE study. Compared to the configuration of commercially available kits from Roche Applied Science and Affymetrix, more user-friendly reagent formulations resulted in both fewer pipetting steps and shorter incubation periods. Pre-formulated master-mix reagent vials allowed a preparation of eight specimens in parallel for microarray analysis in less than 9 hours.
In detail, 1.0 to 8.0 μg of total RNA was converted into double-stranded cDNA by reverse transcription following a cDNA synthesis protocol, but now was performed using pre-mixed oligo(dT)24 – T7 primer (Roche Applied Science), poly-A control transcripts (Affymetrix), enzymes, and master-mix reagents. In stage II of the study, all centers adhered to a standardized procedure to prepare the total RNA for microarray analysis from fresh sample lysates of 5 × 10⁶ mononuclear cells with a column-based extraction method as previously described (RLT lysis buffer, Qiagen, Hilden, Germany).3 The generated cDNA was purified using the AmpliLute cDNA Purification kit (Roche Molecular Systems, Pleasanton, CA). Labeled cRNA was generated in an in vitro transcription reaction using pre-formulated enzymes and master-mix reagents from the Microarray RNA Target Synthesis kit (Roche Applied Science) and in vitro transcription labeling nucleotide mix (Affymetrix). The generated cRNA was purified using the AmpliLute IVT cRNA Purification kit (Roche Molecular Systems) and quantified using the NanoDrop ND-1000 spectrophotometer (NanoDrop Technologies). In each preparation, an amount of up to 11.0 μg cRNA was fragmented with 5X fragmentation buffer (Roche Molecular Systems) in a final reaction volume of 25 μl. The shortened incubation steps during cDNA synthesis, 60 minutes for first-strand synthesis and 120 minutes for second-strand synthesis, were reduced to 40 minutes for first-strand synthesis and 60 minutes for second-strand synthesis, respectively, as well as cRNA target fragmentation, where the 35-minute incubation period was reduced to a 20-minute incubation period, performed using the Hybex Microarray Incubation System (SciGene) and ThermoStat Plus (Eppendorf) instruments. Hybridization, washing, staining, and scanning protocols, respectively, were performed on Affymetrix GeneChip instruments (Hybridization Oven 640, Fluidics Station FS450, Scanner GCS3000 with autoloader carousel).
Because stage II was performed with the custom AmpliChip Leukemia research microarray, washing and staining protocols for the Fluidics Station FS450 were slightly adapted to fit the smaller microformat of the chip.
In total, 2,143 HG-U133 Plus 2.0 and 1191 custom AmpliChip Leukemia microarray gene expression profiles from individual patients were generated during the MILE study. As part of the operator assay training and proficiency testing, 204 HG-U133 Plus 2.0 analyses during Stage I and 252 HG-U133 Plus 2.0 during Stage II, respectively, were performed using cell line total RNA and (data not shown). All microarray image files (.dat and .cel data) were generated using default Affymetrix microarray analysis parameters (GCOS software version 1.2 or higher). For each gene expression profile a detailed data quality report was generated to define the overall quality of each microarray experiment. Quality parameters monitored, besides total RNA yield and cRNA yield, included: (i) background noise (Q value), (ii) percentage of probe sets called present (Liu WM et al: Bioinformatics 18:1593-1599, 2002), (iii) scaling factor, and (iv) 3' probes to 5' probes intensity ratios of the housekeeping gene GAPDH (Staal FJ et al: Leukemia 20:1385-1392, 2006).
The thresholds to pass the quality acceptance criteria were as follows: (i) purified amount of total RNA per sample lysate of mononuclear cells was ≥ 0.5 μg for the HG-U133 Plus 2.0 microarray and ≥ 1.0 μg for the AmpliChip Leukemia microarray; (ii) cRNA yield of each target preparation was ≥ 5.0 μg; and (iii) percentage of present called probe sets was ≥ 20% for the HG-U133 Plus 2.0 microarray and ≥ 25% for the AmpliChip Leukemia microarray.
An exploratory whole-genome hierarchical clustering analysis was performed for all classes (C1 to C18 in ascending order), including the 2,096 samples from stage I. For every class pair (Ci, Cj) (i = 1, … , 17, j = i + 1, … , 18), the top 100 differentially expressed probe sets with largest absolute values of t-statistic were selected in a supervised manner. The union of them contained 3,556 probe sets. Clustering of the probe sets (genes) was done with Pearson's dissimilarity and complete linkage algorithm. Samples were grouped by class number. The Dn3 expression signals, that is, the DQN signals normalized to quantiles of the beta distribution with parameters p = 1.2 and q = 3.0, were used. Red cells depict genes with higher expression compared with the mean signal intensities, and green cells depict genes with lower expression compared with the mean signal intensities.
Margin tree classification is a multi-class support vector machine (SVM) classification method.18 In contrast with other algorithms, this method not only provides a classification result but also produces output graphs for additional interpretation of the organization of classes in a data set.
The margin tree graph is a part of the output of the algorithm and is based on a binary decision tree in a top-down manner, using the optimal margin classifier at each split point. With its putative grouping of the classes, it provides a useful interpretability of a complex data set. The height of a tree node is equal to the SVM margin of separation between bifurcating subclasses of samples. The margins are always non-negative. The length of a terminal branch in the tree is arbitrary. The margin tree program was applied to the stage I data set of 2,096 samples, characterized by their 18 class subtype labels (C1 to C18), and was based on 54,630 probe sets. For construction of the tree, all of the classifiers in the margin tree used all of the genes. The cross-validation accuracy of margin tree classification is comparable to that of all-pairwise SVM (data not shown). As shown in Figure 2, two major branches can be observed, one that contained mainly the B lineage ALL categories and a second larger branch that contained the myeloid and chronic leukemias. MDS samples and non-leukemia specimens were also located in this larger branch. The binary decision tree and the hierarchical relationship among the classes can be interpreted in a top-down manner. In the ALL branch, the algorithm easily defined a distinct gene expression signature for classification for ALL with t(1;19) (Class 6) and Pro-B-ALL with t(11q23)/MLL (Class 2). It further branches out ALL with t(12;21) (Class 5), followed by ALL with hyperdiploid karyotype (Class 7), on the basis of their distinctive gene expression profiles. At the end of that branch, the algorithm enabled the distinction between c-ALL/Pre-B-ALL without the translocation t(9;22) (Class 8) and c-ALL/Pre-B-ALL with the translocation t(9;22) (Class 3), while clearly underlining their biological similarity.
In the right-hand branch of the other major arm of the margin tree, the distinction started with three lymphoid leukemias: CLL (Class 15) was separated first, followed by mature B-ALL with t(8;14) (Class 1) and T-ALL (Class 4). Toward the end of the tree, AML with normal karyotype or other abnormalities and AML with complex aberrant karyotypes (Class 13 and Class 14) were separated from CML (Class 16). Finally, that branch ended with the most difficult distinction between MDS (Class 17) and the group of healthy bone marrow specimens and non-leukemia conditions (Class 18). Within that second branch, a subtree was observed that contained the four AML subtypes with recurrent balanced chromosomal aberrations, that is, AML with t(8;21) (Class 9), AML with t(15;17) (Class 10), AML with inv(16)(t(16;16) (Class 11), as well as AML with t(11q23)/MLL (Class 12). Thus, both types of core binding factor leukemias, AML with t(8;21) and AML with inv(16)(t(16;16), were grouped together. In summary, the exploratory tree-based classifier demonstrated a meaningful organization of the 16 leukemia classes and MDS.
Cases of AML Misclassified
As demonstrated in Figure A4, both in the training data from stage I and in the testing data from stage II misclassifications of some AML cases into the T-ALL category occurred. The AML samples that were misclassified as T-ALL did indeed demonstrate lower levels of CEBPA expression as compared with AML samples not misclassified into T-ALL. The plots indicate the expression of CEBPA, represented by probe set 204039_at, and CD3delta, represented by probe set 213539_at, for both stages of the MILE study. Differences of expression levels of CEBPA are given for the group of AML cases miscalled as T-ALL and the group of AML specimens not called T-ALL by the prediction algorithm.
Lineage Assignments
With respect to general data on lineage assignments of acute and chronic leukemias in stage II, analyzing 14 standard subtypes of acute leukemia—eight ALL and six AML classes (n = 693), represented as Class 1 to Class 14—a classification scheme reached 95.6% median sensitivity and 99.8% median specificity. Overall, within this cohort of acute leukemias 680 of 693 cases were correctly assigned the category of acute leukemias. A remainder of 13 cases was either given a category of MDS (n = 9), “none of the targets” (n = 1), or an indeterminable call (IDC) was assigned (n = 3). In no case was a patient with an acute leukemia incorrectly assigned and considered to have a chronic leukemia.
The predicted accuracies for CLL (n = 237) and CML (n = 43) in stage II were 98.7% and 93.0%, respectively. If both types of chronic leukemias were combined, the accuracy reached 97.9%. Among miscalls for the 280 cases of chronic leukemias in total, n = 4 cases were observed with wrong assignments of a chronic leukemia sample into the category of acute leukemias. In no case was a chronic leukemia assigned into the class of “none of the targets.”
In addition, for the 693 acute leukemias in stage II, the following results were obtained if a classification algorithm was grouping the major lineages types together. For acute lymphoblastic leukemias (n = 436), in two cases the lineage assignment was wrongly given as acute myeloid leukemia. With respect to 257 acute myeloid leukemias, in six cases the lineage assignment was wrongly given as acute lymphoblastic leukemia. Thus, the overall correct lineage assignment was 97%.
With respect to lineage assignments for chronic leukemias, no miscalls were observed between categories CLL and CML. However, three cases of CLL (total 237) were given a call as ALL (n = 2) and MDS (n = 1), respectively; three cases of CML were given a call as ALL (n = 1), AML (n = 1), and MDS (n = 1), respectively.
Fig A1.

Overview of the Microarray Innovations in Leukemia (MILE) study timeline and corresponding number of microarray analyses for each study phase. There were two stages in the MILE research study: a retrospective biomarker discovery phase (stage I) using commercially available whole-genome microarrays (HG-U133 Plus 2.0, Affymetrix, Santa Clara, CA), and the independent validation phase (stage II) that was performed in a prospective manner using a focused and newly designed custom chip (AmpliChip Leukemia, Roche Molecular Systems, Pleasanton, CA). Before each stage of the study, designated laboratory operators were trained during a prephase on the corresponding sample preparation protocol and microarray workflow.15
Fig A2.

Microarray analysis. Each center was provided with identical laboratory supplies and equipment for microarray analysis, including reagent kits, enzymes, spectrophotometer (NanoDrop ND-1000, NanoDrop Technologies, Wilmington, DE), and two heat block instruments (ThermoStat Plus, Eppendorf, Hamburg, Germany; Hybex incubation system, SciGene, Sunnyvale, CA). Each laboratory designated specific test operators, and all operators were individually trained during a 5-day course on a standardized sample preparation protocol for microarray analysis using commercially available total RNA from the MCF-7 and HepG2 cell lines (Ambion, Austin, TX). Detailed results on this prephase program have been published elsewhere.15
Fig A3.
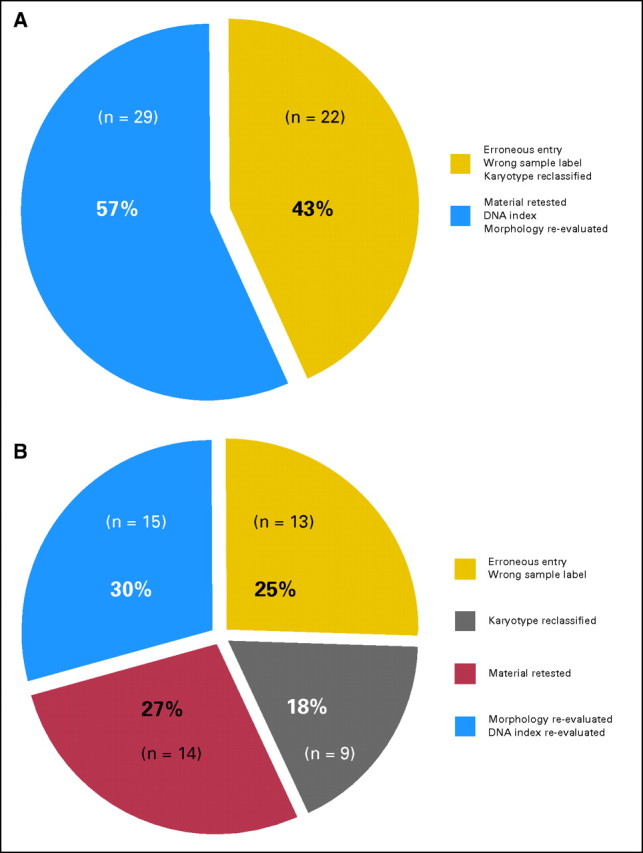
Stage II samples with discrepancies between gold-standard methods and array prediction. The figure summarizes 51 (7.4%) of 693 cases of acute leukemias from stage II where re-examination of the microarray classification result had led to a revision of the laboratories′ originally submitted gold standard. In 22 (43%) of 51 cases, errors were considered to be human errors (Fig A3A). These 43% of cases are split between 13 cases where sample information had been entered with erroneous information into the study database and nine cases where the sample karyotype category had to be reclassified after independent expert review following the definition from Schoch et al23 (Fig A3B). However, in a larger group of 29 (57%) of 51 cases, the microarray prediction turned out to be better than the gold standard. These 29 cases were further distributed between two subcategories, namely, (i) material was re-tested by RT-PCR or FISH assays (14 cases), and (ii) re-evaluation of morphology, DNA index, or other information from the initial diagnostic report (15 cases). Table A2 gives a more detailed overview on the type of tie-breaking molecular assay to resolve discrepancies between original gold standard (GS) and the microarray prediction result.
Fig A4.

Cases of AML misclassified as T-ALL. (A,C) Cross-validation training dataset from stage I. (B,D) Independent test data from stage II. There are recent data available that AML cases with CEBPA silencing have T-lineage features and exhibit a distinctive gene expression profile37 (Wouters BJ et al: Blood 113:3088-3091, 2009). Hypermethylation of the proximal CEBPA promoter was identified in a small subset of AMLs with low CEBPA mRNA expression.37 Here, an analysis was performed to investigate the gene expression intensity of CEBPA and a correlation with misclassification of AML cases by the microarray prediction algorithm into the category of T-ALL. The identity of the corresponding cases is given in Table A3.
Table A1.
Summary Information for Four Virtual Immunophenotype Markers
| Gene | B-ALL |
T-ALL C4 | B-ALL |
AML |
||||||||||
|---|---|---|---|---|---|---|---|---|---|---|---|---|---|---|
| C1 | C2 | C3 | C5 | C6 | C7 | C8 | C9 | C10 | C11 | C12 | C13 | C14 | ||
| CD3G | ||||||||||||||
| No. of samples | 13 | 70 | 122 | 174 | 58 | 36 | 40 | 237 | 40 | 37 | 28 | 38 | 347 | 52 |
| Mean | 688.9 | 240.2 | 269.4 | 3,308.5 | 342.2 | 249.5 | 248.3 | 293.1 | 266.9 | 284.3 | 227.2 | 377.5 | 266.7 | 327.5 |
| SD | 616.1 | 80.4 | 131.8 | 1,993.0 | 377.7 | 92.6 | 66.5 | 253.8 | 152.2 | 134.6 | 73.9 | 772.7 | 213.0 | 242.3 |
| CD19 | ||||||||||||||
| No. of samples | 13 | 70 | 122 | 174 | 58 | 36 | 40 | 237 | 40 | 37 | 28 | 38 | 347 | 52 |
| Mean | 4,321.3 | 7,883.6 | 8,943.7 | 329.6 | 8,511.8 | 10,916.4 | 6,693.8 | 7,594.0 | 1,369.1 | 436.1 | 347.1 | 374.6 | 425.6 | 361.1 |
| SD | 2,835.5 | 3,251.8 | 4,909.7 | 269.3 | 3,294.0 | 3,809.3 | 2,691.5 | 3,875.3 | 996.6 | 312.2 | 121.7 | 131.9 | 677.6 | 233.8 |
| CD33 | ||||||||||||||
| No. of samples | 13 | 70 | 122 | 174 | 58 | 36 | 40 | 237 | 40 | 37 | 28 | 38 | 347 | 52 |
| Mean | 566.8 | 340.1 | 717.6 | 512.9 | 440.8 | 293.6 | 312.5 | 420.7 | 1,247.3 | 3,189.5 | 1,902.0 | 2,403.4 | 2,161.2 | 1,496.8 |
| SD | 236.1 | 162.9 | 572.7 | 670.4 | 251.5 | 158.2 | 79.8 | 317.4 | 629.2 | 1,257.9 | 589.7 | 843.0 | 1,191.6 | 1,033.1 |
| HLA-DRA | ||||||||||||||
| No. of samples | 13 | 70 | 122 | 174 | 58 | 36 | 40 | 237 | 40 | 37 | 28 | 38 | 347 | 52 |
| Mean | 12,984.3 | 9,308.8 | 20,571.8 | 2,139.6 | 21,225.1 | 12,662.2 | 17,434.3 | 14,811.6 | 9,789.7 | 1,170.5 | 14,290.9 | 10,643.2 | 10,098.6 | 6,796.3 |
| SD | 7,460.0 | 5,577.4 | 7,275.4 | 3,181.9 | 8,743.0 | 6,266.3 | 8,261.5 | 7,178.0 | 5,535.2 | 1,155.4 | 6,956.5 | 8,719.0 | 7,419.3 | 4,587.2 |
Abbreviations: B-ALL, B-cell acute lymphoblastic leukemia; T-ALL, T-cell acute lymphoblastic leukemia; AML, acute myeloid leukemia; SD, standard deviation.
Table A2.
Individual Parameters and Type of Tie-Breaking Molecular Analysis
| Sample No. | Original GS | Microarray | Revised GS | Change Reason and Explanation | Category |
|---|---|---|---|---|---|
| 1 | 8 | 3 | 3 | Erroneous entry/wrong sample label | A |
| 2 | 3 | 7 | 7 | Erroneous entry/wrong sample label | A |
| 3 | 8 | 7 | 7 | Erroneous entry/wrong sample label | A |
| 4 | 5 | 7 | 7 | Erroneous entry/wrong sample label | A |
| 5 | 7 | 8 | 8 | Erroneous entry/wrong sample label | A |
| 6 | 5 | 8 | 8 | Erroneous entry/wrong sample label | A |
| 7 | 7 | 8 | 8 | Erroneous entry/wrong sample label | A |
| 8 | 12 | 13 | 13 | Erroneous entry/wrong sample label | A |
| 9 | 3 | 7 | 7 | Erroneous entry/wrong sample label | A |
| 10 | 5 | 8 | 8 | Erroneous entry/wrong sample label | A |
| 11 | 6 | 2 | 2 | Erroneous entry/wrong sample label | A |
| 12 | 8 | 6 | 6 | Erroneous entry/wrong sample label | A |
| 13 | 6 | 3 | 3 | Erroneous entry/wrong sample label | A |
| 28 | 13 | 14 | 14 | Reclassified with definition of Schoch et al23 | B |
| 29 | 13 | 14 | 14 | Reclassified with definition of Schoch et al23 | B |
| 30 | 13 | 14 | 14 | Reclassified with definition of Schoch et al23 | B |
| 31 | 14 | 13 | 13 | Reclassified with definition of Schoch et al23 | B |
| 32 | 14 | 13 | 13 | Reclassified with definition of Schoch et al23 | B |
| 33 | 14 | 13 | 13 | Reclassified with definition of Schoch et al23 | B |
| 34 | 14 | 13 | 13 | Reclassified with definition of Schoch et al23 | B |
| 35 | 14 | 13 | 13 | Reclassified with definition of Schoch et al23 | B |
| 36 | 14 | 13 | 13 | Reclassified with definition of Schoch et al23 | B |
| 14 | 11 | 13 | 13 | Material retested for inv(16) → PCR negative | C |
| 15 | 13 | 11 | 11 | Material retested for inv(16) → PCR positive | C |
| 16 | 13 | 12 | 12 | Material retested for MLL rearrangement → FISH positive | C |
| 17 | 13 | 12 | 12 | Material retested for MLL rearrangement → FISH positive | C |
| 18 | 14 | 12 | 12 | Material retested for MLL rearrangement → FISH positive | C |
| 19 | 8 | 6 | 6 | Material retested for t(1;19) → PCR positive | C |
| 20 | 8 | 6 | 6 | Material retested for t(1;19) → PCR positive | C |
| 21 | 8 | 6 | 6 | Material retested for t(1;19) → PCR positive | C |
| 22 | 8 | 6 | 6 | Material retested for t(1;19) → PCR positive | C |
| 23 | 8 | 5 | 5 | Material retested for t(12;21) → PCR positive | C |
| 24 | 8 | 5 | 5 | Material retested for t(12;21) → PCR positive | C |
| 25 | 17 | 10 | 10 | Material retested for t(15;17) → PCR positive | C |
| 26 | 13 | 9 | 9 | Material retested for t(8;21) → PCR positive | C |
| 27 | 13 | 9 | 9 | Material retested for t(8;21) → PCR positive | C |
| 37 | 3 | 8 | 8 | Re-evaluation of morphology/diagnostic report/DNA index | D |
| 38 | 7 | 8 | 8 | Re-evaluation of morphology/diagnostic report/DNA index | D |
| 39 | 8 | 7 | 7 | Re-evaluation of morphology/diagnostic report/DNA index | D |
| 40 | 8 | 7 | 7 | Re-evaluation of morphology/diagnostic report/DNA index | D |
| 41 | 8 | 7 | 7 | Re-evaluation of morphology/diagnostic report/DNA index | D |
| 42 | 8 | 7 | 7 | Re-evaluation of morphology/diagnostic report/DNA index | D |
| 43 | 8 | 7 | 7 | Re-evaluation of morphology/diagnostic report/DNA index | D |
| 44 | 8 | 7 | 7 | Re-evaluation of morphology/diagnostic report/DNA index | D |
| 45 | 8 | 7 | 7 | Re-evaluation of morphology/diagnostic report/DNA index | D |
| 46 | 8 | 7 | 7 | Re-evaluation of morphology/diagnostic report/DNA index | D |
| 47 | 13 | 13 | 13 | Re-evaluation of morphology/diagnostic report/DNA index | D |
| 48 | 17 | 13 | 13 | Re-evaluation of morphology/diagnostic report/DNA index | D |
| 49 | 17 | 13 | 13 | Re-evaluation of morphology/diagnostic report/DNA index | D |
| 50 | 17 | 13 | 13 | Re-evaluation of morphology/diagnostic report/DNA index | D |
| 51 | 17 | 14 | 14 | Re-evaluation of morphology/diagnostic report/DNA index | D |
Abbreviations: GS, gold standard; PCR, polymerase chain reaction; MLL, myeloid/lymphoid or mixed-lineage leukemia; FISH, fluorescence in situ hybridization.
Table A3.
AML Samples With Misclassification Results Into the Class of T-ALL
| GEO_CEL_file_name | Gold Standard | Stage | Classification Result |
|---|---|---|---|
| N1_1164.CEL | C13 | I | T-ALL (class 4) |
| N1_1105.CEL | C13 | I | T-ALL (class 4) |
| N1_1102.CEL | C13 | I | T-ALL (class 4) |
| N1_1067.CEL | C13 | I | T-ALL (class 4) |
| N1_0882.CEL | C12 | I | T-ALL (class 4) |
| N1_1049.CEL | C13 | I | T-ALL (class 4) |
| N2_0817.CEL | C12 | II | T-ALL (class 4) |
| N2_0684.CEL | C13 | II | T-ALL (class 4) |
| N2_0398.CEL | C13 | II | T-ALL (class 4) |
| N2_0447.CEL | C13 | II | T-ALL (class 4) |
| N2_1029.CEL | C14 | II | T-ALL (class 4) |
Abbreviations: AML, acute myeloid leukemia; T-ALL, T-cell acute lymphoblastic leukemia.
Footnotes
Study supplies, instruments, and sample preparation and microarray technology training courses were provided by Roche Molecular Systems, Pleasanton, CA, as part of the AmpliChip Leukemia Research Program, a collaborative effort with the European LeukemiaNet, addressing gene expression signatures in leukemia. This study was also supported in part by Associazione Italiana per la Ricerca sul Cancro (Milan, Italy), Ministero dell'Università e della Ricerca, Fondo per gli Investimenti della Ricerca di Base, COFIN, and PRIN (Rome, Italy).
Presented in part as oral presentation at the 50th Annual Meeting of the American Society of Hematology, December 6-9, 2008, San Francisco, CA.
Authors' disclosures of potential conflicts of interest and author contributions are found at the end of this article.
AUTHORS' DISCLOSURES OF POTENTIAL CONFLICTS OF INTEREST
Although all authors completed the disclosure declaration, the following author(s) indicated a financial or other interest that is relevant to the subject matter under consideration in this article. Certain relationships marked with a “U” are those for which no compensation was received; those relationships marked with a “C” were compensated. For a detailed description of the disclosure categories, or for more information about ASCO's conflict of interest policy, please refer to the Author Disclosure Declaration and the Disclosures of Potential Conflicts of Interest section in Information for Contributors.
Employment or Leadership Position: Torsten Haferlach, MLL Munich Leukemia Laboratory (C); Alexander Kohlmann, MLL Munich Leukemia Laboratory (C); Lothar Wieczorek, Roche Molecular Systems (C); Peter R. Papenhausen, Laboratory Corporation of America (C); Wei-min Liu, Roche Molecular Systems (C); P. Mickey Williams, Roche Molecular Systems (C) Consultant or Advisory Role: Torsten Haferlach, Hoffmann-La Roche (C) Stock Ownership: None Honoraria: Torsten Haferlach, Hoffmann-La Roche; Ken I. Mills, Roche Molecular Systems; Robin Foà, Roche Molecular Systems Research Funding: Torsten Haferlach, Roche Molecular Systems; Giuseppe Basso, Roche Molecular Systems; Geertruy Te Kronnie, Roche Molecular Systems; Marie-Christine Béné, Roche Molecular Systems; John De Vos, Roche Molecular Systems; Jesus M. Hernández, Roche Molecular Systems; Wolf-Karsten Hofmann, Roche Molecular Systems; Ken I. Mills, Roche Molecular Systems; Amanda Gilkes, Roche Molecular Systems; Sabina Chiaretti, Roche Molecular Systems; Sheila A. Shurtleff, Roche Molecular Systems; Thomas J. Kipps, Roche Molecular Systems; Laura Z. Rassenti, Roche Molecular Systems; Allen E. Yeoh, Roche Molecular Systems; Peter R. Papenhausen, Roche Molecular Systems; Robin Foà, Roche Molecular Systems Expert Testimony: None Other Remuneration: None
AUTHOR CONTRIBUTIONS
Conception and design: Torsten Haferlach, Alexander Kohlmann
Collection and assembly of data: Torsten Haferlach, Lothar Wieczorek, Giuseppe Basso, Geertruy Te Kronnie, Marie-Christine Béné, John De Vos, Jesus M. Hernández, Wolf-Karsten Hofmann, Ken I. Mills, Amanda Gilkes, Sabina Chiaretti, Sheila A. Shurtleff, Thomas J. Kipps, Laura Z. Rassenti, Allen E. Yeoh, Peter R. Papenhausen, Robin Foà
Data analysis and interpretation: Torsten Haferlach, Alexander Kohlmann, Wei-min Liu, P. Mickey Williams
Manuscript writing: Torsten Haferlach, Alexander Kohlmann, Wei-min Liu
Final approval of manuscript: Torsten Haferlach, Alexander Kohlmann, Lothar Wieczorek, Giuseppe Basso, Geertruy Te Kronnie, Marie-Christine Béné, John De Vos, Jesus M. Hernández, Wolf-Karsten Hofmann, Ken I. Mills, Amanda Gilkes, Sabina Chiaretti, Sheila A. Shurtleff, Thomas J. Kipps, Laura Z. Rassenti, Allen E. Yeoh, Peter R. Papenhausen, Wei-min Liu, P. Mickey Williams, Robin Foà
REFERENCES
- 1.Wouters BJ, Lowenberg B, Delwel R: A decade of genome-wide gene expression profiling in acute myeloid leukemia: Flashback and prospects Blood 113:291–298,2009 [DOI] [PMC free article] [PubMed] [Google Scholar]
- 2.Armstrong SA Staunton JE Silverman LB, etal: MLL translocations specify a distinct gene expression profile that distinguishes a unique leukemia Nat Genet 30:41–47,2002 [DOI] [PubMed] [Google Scholar]
- 3.Campo Dell'Orto M Zangrando A Trentin L, etal: New data on robustness of gene expression signatures in leukemia: Comparison of three distinct total RNA preparation procedures BMC Genomics 8:188,2007 [DOI] [PMC free article] [PubMed] [Google Scholar]
- 4.Chiaretti S Li X Gentleman R, etal: Gene expression profile of adult T-cell acute lymphocytic leukemia identifies distinct subsets of patients with different response to therapy and survival Blood 103:2771–2778,2004 [DOI] [PubMed] [Google Scholar]
- 5.Golub TR Slonim DK Tamayo P, etal: Molecular classification of cancer: Class discovery and class prediction by gene expression monitoring Science 286:531–537,1999 [DOI] [PubMed] [Google Scholar]
- 6.Kohlmann A Schoch C Schnittger S, etal: Molecular characterization of acute leukemias by use of microarray technology Genes Chromosomes Cancer 37:396–405,2003 [DOI] [PubMed] [Google Scholar]
- 7.Kohlmann A Schoch C Schnittger S, etal: Pediatric acute lymphoblastic leukemia (ALL) gene expression signatures classify an independent cohort of adult ALL patients Leukemia 18:63–71,2004 [DOI] [PubMed] [Google Scholar]
- 8.Ross ME Zhou X Song G, etal: Classification of pediatric acute lymphoblastic leukemia by gene expression profiling Blood 102:2951–2959,2003 [DOI] [PubMed] [Google Scholar]
- 9.Ross ME Mahfouz R Onciu M, etal: Gene expression profiling of pediatric acute myelogenous leukemia Blood 104:3679–3687,2004 [DOI] [PubMed] [Google Scholar]
- 10.Yeoh EJ Ross ME Shurtleff SA, etal: Classification, subtype discovery, and prediction of outcome in pediatric acute lymphoblastic leukemia by gene expression profiling Cancer Cell 1:133–143,2002 [DOI] [PubMed] [Google Scholar]
- 11.Schoch C Kohlmann A Schnittger S, etal: Acute myeloid leukemias with reciprocal rearrangements can be distinguished by specific gene expression profiles Proc Natl Acad Sci U S A 99:10008–10013,2002 [DOI] [PMC free article] [PubMed] [Google Scholar]
- 12.Valk PJ Verhaak RG Beijen MA, etal: Prognostically useful gene-expression profiles in acute myeloid leukemia N Engl J Med 350:1617–1628,2004 [DOI] [PubMed] [Google Scholar]
- 13.Bullinger L Dohner K Bair E, etal: Use of gene-expression profiling to identify prognostic subclasses in adult acute myeloid leukemia N Engl J Med 350:1605–1616,2004 [DOI] [PubMed] [Google Scholar]
- 14.Haferlach T Kohlmann A Schnittger S, etal: Global approach to the diagnosis of leukemia using gene expression profiling Blood 106:1189–1198,2005 [DOI] [PubMed] [Google Scholar]
- 15.Kohlmann A Kipps TJ Rassenti LZ, etal: An international standardization programme towards the application of gene expression profiling in routine leukaemia diagnostics: The Microarray Innovations in LEukemia study prephase Br J Haematol 142:802–807,2008 [DOI] [PMC free article] [PubMed] [Google Scholar]
- 16.Liu WM Li R Sun JZ, etal: PQN and DQN: Algorithms for expression microarrays J Theor Biol 243:273–278,2006 [DOI] [PubMed] [Google Scholar]
- 17.Eisen MB Spellman PT Brown PO, etal: Cluster analysis and display of genome-wide expression patterns Proc Natl Acad Sci U S A 95:14863–14868,1998 [DOI] [PMC free article] [PubMed] [Google Scholar]
- 18.Tibshirani R, Hastie T: Margin trees for high-dimensional classification J Mach Learn Res 8:637–652,2007 [Google Scholar]
- 19.Barrett T Suzek TO Troup DB, etal: NCBI GEO: Mining millions of expression profiles—Database and tools Nucleic Acids Res 33:D562–D566,2005 [DOI] [PMC free article] [PubMed] [Google Scholar]
- 20.Kohlmann A Haschke-Becher E Wimmer B, etal: Intraplatform reproducibility and technical precision of gene expression profiling in 4 laboratories investigating 160 leukemia samples: The DACH study Clin Chem 54:1705–1715,2008 [DOI] [PubMed] [Google Scholar]
- 21.Chang C-C, Lin C-J: LIBSVM: A library for support vector machines http://www.csie.ntu.edu.tw/∼cjlin/libsvm
- 22.Vapnik VN: The Nature of Statistical Learning Theory 1995. New York, NY: Springer-Verlag [Google Scholar]
- 23.Schoch C Kern W Kohlmann A, etal: Acute myeloid leukemia with a complex aberrant karyotype is a distinct biological entity characterized by genomic imbalances and a specific gene expression profile Genes Chromosomes Cancer 43:227–238,2005 [DOI] [PubMed] [Google Scholar]
- 24.Kern W Haferlach C Haferlach T, etal: Monitoring of minimal residual disease in acute myeloid leukemia Cancer 112:4–16,2008 [DOI] [PubMed] [Google Scholar]
- 25.Paganin M Zecca M Fabbri G, etal: Minimal residual disease is an important predictive factor of outcome in children with relapsed ‘high-risk’ acute lymphoblastic leukemia Leukemia 22:2193–2200,2008 [DOI] [PubMed] [Google Scholar]
- 26.Byrd JC Mrozek K Dodge RK, etal: Pretreatment cytogenetic abnormalities are predictive of induction success, cumulative incidence of relapse, and overall survival in adult patients with de novo acute myeloid leukemia: Results from Cancer and Leukemia Group B (CALGB 8461) Blood 100:4325–4336,2002 [DOI] [PubMed] [Google Scholar]
- 27.Grimwade D Walker H Harrison G, etal: The predictive value of hierarchical cytogenetic classification in older adults with acute myeloid leukemia (AML): Analysis of 1065 patients entered into the United Kingdom Medical Research Council AML11 trial Blood 98:1312–1320,2001 [DOI] [PubMed] [Google Scholar]
- 28.Swerdlow SH Campo E Harris NL, etal: WHO Classification of Tumours of Haematopoietic and Lymphoid Tissues 2008. ed 4 Lyon, France: International Agency for Research on Cancer [Google Scholar]
- 29.Metzeler KH Hummel M Bloomfield CD, etal: An 86-probe-set gene-expression signature predicts survival in cytogenetically normal acute myeloid leukemia Blood 112:4193–4201,2008 [DOI] [PMC free article] [PubMed] [Google Scholar]
- 30.Radmacher MD Marcucci G Ruppert AS, etal: Independent confirmation of a prognostic gene-expression signature in adult acute myeloid leukemia with a normal karyotype: A Cancer and Leukemia Group B study Blood 108:1677–1683,2006 [DOI] [PMC free article] [PubMed] [Google Scholar]
- 31.Alcalay M Tiacci E Bergomas R, etal: Acute myeloid leukemia bearing cytoplasmic nucleophosmin (NPMc+ AML) shows a distinct gene expression profile characterized by up-regulation of genes involved in stem-cell maintenance Blood 106:899–902,2005 [DOI] [PubMed] [Google Scholar]
- 32.Bullinger L Dohner K Kranz R, etal: An FLT3 gene-expression signature predicts clinical outcome in normal karyotype AML Blood 111:4490–4495,2008 [DOI] [PubMed] [Google Scholar]
- 33.Kohlmann A Bullinger L Thiede C, etal: Gene expression profiling in AML with normal karyotype: A multicenter study investigating molecular markers in 252 cases Blood 112:751,2008abstr [Google Scholar]
- 34.Marcucci G Maharry K Radmacher MD, etal: Prognostic significance of, and gene and microRNA expression signatures associated with, CEBPA mutations in cytogenetically normal acute myeloid leukemia with high-risk molecular features: A Cancer and Leukemia Group B study J Clin Oncol 26:5078–5087,2008 [DOI] [PMC free article] [PubMed] [Google Scholar]
- 35.Verhaak RG Goudswaard CS van PW, etal: Mutations in nucleophosmin (NPM1) in acute myeloid leukemia (AML): Association with other gene abnormalities and previously established gene expression signatures and their favorable prognostic significance Blood 106:3747–3754,2005 [DOI] [PubMed] [Google Scholar]
- 36.Whitman SP Ruppert AS Radmacher MD, etal: FLT3 D835/I836 mutations are associated with poor disease-free survival and a distinct gene-expression signature among younger adults with de novo cytogenetically normal acute myeloid leukemia lacking FLT3 internal tandem duplications Blood 111:1552–1559,2008 [DOI] [PMC free article] [PubMed] [Google Scholar]
- 37.Wouters BJ Jorda MA Keeshan K, etal: Distinct gene expression profiles of acute myeloid/T-lymphoid leukemia with silenced CEBPA and mutations in NOTCH1 Blood 110:3706–3714,2007 [DOI] [PMC free article] [PubMed] [Google Scholar]
- 38.Paschka P Marcucci G Ruppert AS, etal: Wilms' tumor 1 gene mutations independently predict poor outcome in adults with cytogenetically normal acute myeloid leukemia: A Cancer and Leukemia Group B study J Clin Oncol 26:4595–4602,2008 [DOI] [PMC free article] [PubMed] [Google Scholar]
- 39.Christiansen DH, Andersen MK, Pedersen-Bjergaard J: Mutations of AML1 are common in therapy-related myelodysplasia following therapy with alkylating agents and are significantly associated with deletion or loss of chromosome arm 7q and with subsequent leukemic transformation Blood 104:1474–1481,2004 [DOI] [PubMed] [Google Scholar]