

Abstract
Purpose
A multicenter, randomized phase II trial, RECORD-3, was conducted to compare first-line everolimus followed by sunitinib at progression with the standard sequence of first-line sunitinib followed by everolimus in patients with metastatic renal cell carcinoma.
Patients and Methods
RECORD-3 used a crossover treatment design. The primary objective was to assess progression-free survival (PFS) noninferiority of first-line everolimus compared with first-line sunitinib. Secondary end points included combined PFS for each sequence, overall survival (OS), and safety.
Results
Of 471 enrolled patients, 238 were randomly assigned to first-line everolimus followed by sunitinib, and 233 were randomly assigned to first-line sunitinib followed by everolimus. The primary end point was not met; the median PFS was 7.9 months for first-line everolimus and 10.7 months for first-line sunitinib (hazard ratio [HR], 1.4; 95% CI, 1.2 to 1.8). Among patients who discontinued first-line, 108 (45%) crossed over from everolimus to second-line sunitinib, and 99 (43%) crossed over from sunitinib to second-line everolimus. The median combined PFS was 21.1 months for sequential everolimus then sunitinib and was 25.8 months for sequential sunitinib then everolimus (HR, 1.3; 95% CI, 0.9 to 1.7). The median OS was 22.4 months for sequential everolimus and then sunitinib and 32.0 months for sequential sunitinib and then everolimus (HR, 1.2; 95% CI, 0.9 to 1.6). Common treatment-emergent adverse events during first-line everolimus or sunitinib were stomatitis (53% and 57%, respectively), fatigue (45% and 51%, respectively), and diarrhea (38% and 57%, respectively).
Conclusion
Everolimus did not demonstrate noninferiority compared with sunitinib as a first-line therapy. The trial results support the standard treatment paradigm of first-line sunitinib followed by everolimus at progression.
INTRODUCTION
Inhibitors of vascular endothelial growth factor (VEGF), VEGF receptor (VEGFR), or mammalian target of rapamycin (mTOR) are standard therapy options for patients with metastatic renal cell carcinoma (mRCC). Current treatment guidelines for patients with mRCC recommend a first-line VEGF inhibitor, including sunitinib, followed by everolimus at progression.1,2
Cross-study comparisons demonstrated a differentiated toxicity profile between everolimus and sunitinib, which suggested better tolerability of everolimus.3–5 The objectives of this trial were to compare efficacy and safety of everolimus and sunitinib in first-line therapy and the sequence of everolimus followed by sunitinib at progression compared with the standard sequence. This randomized, phase II trial is, to our knowledge, the first head-to-head comparison of a VEGFR tyrosine kinase inhibitor versus an mTOR inhibitor in first-line therapy.
PATIENTS AND METHODS
Patients
The population comprised patients age 18 years or older who had measurable (by RECIST [Response Evaluation Criteria in Solid Tumors], version 1.0) clear cell or non–clear cell mRCC, with or without nephrectomy. Key eligibility criteria included no prior systemic therapy; a Karnofsky performance status of 70% or greater; adequate hematologic, liver, and kidney function; and normal left ventricular ejection fraction. Patients with brain metastases were excluded. All patients gave informed consent.
Study Design and Treatment
RECORD-3 (Renal Cell Cancer Treatment With Oral RAD001 Given Daily) was an open-label, randomized, multicenter, phase II study of everolimus versus sunitinib in a crossover treatment design (Appendix Fig A1, online only). Patients were randomly assigned in a 1:1 manner to first-line everolimus followed by sunitinib or first-line sunitinib followed by everolimus. Random assignment was stratified by Memorial Sloan-Kettering Cancer Center (MSKCC) risk criteria (ie, favorable, intermediate, or poor risk).6 Patients received first-line study drug until documented disease progression (by RECIST, version 1.0) or discontinuation as a result of unacceptable toxicity or for any other reason. At first documented disease progression, the patient was eligible to cross to second-line sunitinib or everolimus until documented progression occurred.
Everolimus and sunitinib were provided by the sponsor (Novartis Oncology, East Hanover, NJ). The everolimus dosage was 10 mg daily continually, and the sunitinib dosage was 50 mg daily in a schedule of 4 weeks on followed by 2 weeks off. Dose modifications were permitted for adverse events (AEs). Everolimus could be decreased to 5 mg daily and then to 5 mg every other day. Sunitinib could be decreased to 37.5 mg and then to 25 mg. The study was conducted in accordance with the International Conference on Harmonization Good Clinical Practice guidelines and was approved by institutional review boards or independent ethics committees of each center.
End Points and Assessments
The primary end point was to assess progression-free survival (PFS) noninferiority of first-line everolimus compared with sunitinib by investigator assessment. The key secondary end point was to compare combined PFS for first-line everolimus followed by sunitinib and first-line sunitinib followed by everolimus. Combined PFS was defined as time from random assignment to death as a result of any cause or progression after second-line treatment for patients who experienced progression in the first-line period and crossed to second-line treatment after progression. Other secondary end points were first-line objective response rate, overall survival (OS), safety, and patient-reported outcomes (PROs).
During the first-line period, tumor assessments (by RECIST, version 1.0) were performed every 12 weeks from random assignment until progression or start of another treatment. AEs, physical examination, and blood work were assessed at baseline and on day 28 of each cycle. The Functional Assessment of Cancer Therapy–Kidney Symptom Index, Disease-Related Symptoms (FKSI-DRS) questionnaire and the European Organisation for Research and Treatment of Cancer Core Quality of Life Questionnaire (EORTC QLQ-C30) were used to assess PROs at baseline, on days 1 and 28 of each cycle, and during follow-up (ie, monthly up to 3 months or until start of new anticancer therapy). Details of pharmacokinetic assessments are provided in the Appendix (online only).
The crossover period was defined as the time after the end of first-line therapy and before starting second-line therapy (with crossover to occur within 35 days of progression). Patients had a minimum 2-week period after discontinuation of the first-line drug because of progression before beginning the second-line drug. Patients crossing over were required to have baseline evaluations repeated 35 days or fewer before the first dose of second-line drug, but this timeline could be prolonged to resolve AEs. In absence of progression at the end of first-line treatment, the second-line drug was not administered, and tumor measurements were continued until documented progression occurred. During the second-line period, patients were assessed for eligibility and for efficacy and safety, as in the first-line period.
Statistical Analyses
Primary analysis was based on all randomly assigned patients (ie, intention-to-treat population). The primary end point was first-line PFS, defined as time from random assignment to progression or death before the start of second-line treatment. Patients without progression or death at data cutoff for the analysis or at the time of receiving additional anticancer therapy, including the second-line drug, were censored at their last date of adequate tumor evaluation. Two criteria were used to declare noninferiority of everolimus versus sunitinib in terms of first-line PFS. This double-criteria approach applied to RECORD-3 was discussed broadly in a separate statistical paper.7 The first criterion was that the hazard ratio (HR) estimate was smaller than a critical threshold of 1.1, which corresponded to a 1-month difference in the median first-line PFS: 10.8 months in the sunitinib arm versus 9.8 months in the everolimus arm. The second criterion required that the upper estimated one-sided 90% confidence bound was smaller than a traditional noninferiority margin of 1.27, which preserved 90% of the putative effect of sunitinib versus placebo.
In Bayesian terms, the two criteria for noninferiority declaration correspond to the following posterior probabilities requirements, assuming a noninformative prior: Pr (HR ≤ 1.1|data) ≥ 0.5 and Pr (HR ≤ 1.27|data) ≥ 90%. The parallel between the frequentist and the Bayesian approach is discussed in several statistical publications.7–9 Details are provided in the Appendix (online only).
The required number of first-line PFS events was 318,7 which was established so that fulfillment of the first criterion (estimated HR ≤ 1.1) implied the second (upper estimated one-sided 90% confidence bound ≤ 1.27). The design with these two noninferiority criteria and number of events implied acceptable operating characteristics for a phase II trial. Type I error was controlled at level .10. To obtain the power under strict equivalence, 1,000 studies were simulated, which assumed 460 patients enrolled over 20 months of recruitment, a 20% dropout rate, and a maximum of 38 months of total study duration. With 318 first-line PFS events, the power of the trial (ie, the probability of meeting both criteria) was approximately 80%.
A type I error of .10 combined with the additional criterion of an effect estimate that attained the 1.1 threshold was considered adequate, and this allowed for a feasible sample size and a reasonably high level of proof (90% probability to be better than the noninferiority margin of 1.27) that was considered sufficient for internal decision making in this phase II context. The additional criterion for the estimated effect size prevented a noninferiority conclusion in the situations in which the study, although significant, had an unconvincing effect. HR was estimated by using the Cox proportional hazard model stratified by MSKCC risk criteria.6
The key secondary end point was combined PFS for the two sequences of treatment, defined as time from random assignment to progression after second-line treatment or death as a result of any cause. Patients who did not cross over to second-line or did not experience progression after the start of a second-line drug or were alive at data cutoff for the analysis or at the time of receiving an additional anticancer therapy were censored at last date of tumor evaluation. No formal sample size and power calculation were made for combined PFS.
OS was a secondary end point that was defined as the time from random assignment to death. Data cutoff for this primary analysis was September 3, 2012. The final OS analysis will be conducted after the 3-year follow-up period.
Second-line PFS was an exploratory objective that was defined as time from the start of second-line treatment to progression or death. At primary analysis, the crossover rate was low, and second-line PFS data were immature; therefore, second-line PFS will be reported at the time of the final OS analysis.
RESULTS
Patient Population and Disposition
Patients were recruited from 83 sites in 19 countries. From October 2009 to June 2011, 471 patients were enrolled; 238 patients were assigned to first-line everolimus followed by sunitinib, and 233 patients were assigned to first-line sunitinib followed by everolimus.
The full analysis set (N = 471) included all randomly assigned patients analyzed according to study treatment and assigned stratum (Fig 1). The safety population (n = 469) included all patients who received at least one dose of study drug and had at least one safety assessment in the first-line period. The second-line safety population included the subset of patients who received at least one dose of second-line everolimus (n = 99) or sunitinib (n = 108).
Fig 1.

CONSORT diagram.(*) Under treatment at time of data cut-off (September 3, 2012) (†) Primary reasons for discontinuation are listed. FAS, full analysis set.
Among randomly assigned patients, 238 received first-line everolimus, and 231 received first-line sunitinib (2 in first-line sunitinib arm received no treatment). During the first-line period, 85% (n = 201) of patients discontinued everolimus, and 82% (n = 192) discontinued sunitinib. Among these, 108 patients crossed from everolimus to second-line sunitinib, and 99 patients crossed from sunitinib to second-line everolimus. The main reasons for not crossing over to second-line therapy were death, lack of eligibility to cross over, protocol deviation, and consent withdrawal.
Characteristics were balanced between treatment arms in the first-line setting, except for Karnofsky performance status, which favored sunitinib (Table 1). Most patients had RCC of clear cell histology. In the first-line everolimus and first-line sunitinib arms, the most common non–clear cell histologies were papillary (10% and 11% of patients, respectively) and chromophobe (2% and 3% of patients, respectively). Characteristics also were balanced between arms in the second-line setting (Appendix Table A1, online only).
Table 1.
Baseline Characteristics in the First-Line Setting
| Characteristic | Treatment Arm |
|||
|---|---|---|---|---|
| Everolimus (n = 238) |
Sunitinib (n = 233) |
|||
| No. | % | No. | % | |
| Age, years | ||||
| Median | 62 | 62 | ||
| Range | 20-89 | 29-84 | ||
| Sex | ||||
| M | 166 | 70 | 176 | 76 |
| F | 72 | 30 | 57 | 25 |
| Ethnicity | ||||
| White | 164 | 69 | 173 | 74 |
| Asian | 44 | 19 | 36 | 16 |
| Black | 7 | 3 | 7 | 3 |
| Other | 23 | 10 | 17 | 7 |
| KPS | ||||
| ≥ 90 | 158 | 66 | 181 | 78 |
| 80 | 61 | 26 | 43 | 19 |
| 70 | 18 | 8 | 8 | 3 |
| Missing | 1 | < 1 | 1 | < 1 |
| Predominant tumor histology subtype | ||||
| Clear cell | 205 | 86 | 197 | 85 |
| Non–clear cell | 31 | 13 | 35 | 15 |
| Missing | 2 | < 1 | 1 | < 1 |
| Nephrectomy | ||||
| Yes | 159 | 67 | 156 | 67 |
| No. of metastatic sites* | ||||
| ≥ 2 | 164 | 69 | 157 | 67 |
| 1 | 73 | 31 | 75 | 32 |
| 0† | 1 | < 1 | 1 | < 1 |
| Organ involvement | ||||
| Lungs | 161 | 68 | 160 | 69 |
| Bone | 58 | 24 | 48 | 21 |
| Liver | 42 | 18 | 37 | 16 |
| MSKCC prognosis | ||||
| Favorable | 70 | 29 | 69 | 30 |
| Intermediate | 132 | 56 | 131 | 56 |
| Poor | 35 | 15 | 32 | 14 |
Abbreviations: KPS, Karnofsky performance status; MSKCC, Memorial Sloan-Kettering Cancer Center.
Accounts for RECIST data.
Randomly assigned with local kidney disease and no metastatic sites per RECIST definition.
Efficacy
Results of the primary end point demonstrated that noninferiority of first-line everolimus over sunitinib was not achieved. The estimated HR of 1.4 was above the critical value of 1.1, and the one-sided 90% CI upper limit of 1.64 was above the noninferiority margin of 1.27. Consistently, in terms of posterior probabilities, the results did not meet noninferiority requirements (Table 2). The median PFS was shorter for first-line everolimus (7.9 months) than for first-line sunitinib (10.7 months; Fig 2; Table 2). Results of the Cox regression sensitivity analysis (per-protocol population) confirmed the primary analysis robustness (HR, 1.4; 95% CI, 1.1 to 1.8). By prespecified subgroup analysis of MSKCC prognosis, median PFS was longer for patients of favorable and intermediate risk treated with first-line sunitinib compared with everolimus (Table 2). By post hoc analysis, median PFS was longer for patients with clear cell and non–clear cell histology treated with first-line sunitinib compared with everolimus (Table 2). Results of the key secondary end point demonstrated that median PFS was 21.1 months for combined first-line everolimus and second-line sunitinib and 25.8 months for combined first-line sunitinib and second-line everolimus (HR, 1.3; 95% CI, 0.9 to 1.7; Fig 3A; Table 2). There were 88 PFS events (n = 150 censors) in the everolimus-then-sunitinib group and 80 PFS events (n = 153 censors) in the sunitinib-then-everolimus group. Key sources of censoring for the combined PFS end point included patients receiving first-line everolimus (16%) and sunitinib (17%) or second-line everolimus (10%) and sunitinib (13%) at data cutoff and patients who discontinued first-line everolimus (26%) and sunitinib (24%) and had not crossed to second-line treatment.
Table 2.
Summary of Key Efficacy End Points
| End Point | Treatment Arm |
Analysis |
||
|---|---|---|---|---|
| Everolimus Then Sunitinib (n = 238) | Sunitinib Then Everolimus (n = 233) | HR | 95% CI | |
| First-line PFS, months* | 1.4 | 1.2 to 1.8† | ||
| Median | 7.9 | 10.7 | ||
| Range | 5.6-8.2 | 8.2-11.5 | ||
| PFS by MSKCC prognosis | ||||
| Favorable | 1.2 | 0.8 to 1.8 | ||
| Median | 11.1 | 13.4 | ||
| Range | 8.3-15.9 | 11.0-18.2 | ||
| Intermediate | 1.5 | 1.1 to 2.0 | ||
| Median | 5.7 | 8.2 | ||
| Range | 5.1-8.1 | 7.4-11.2 | ||
| Poor | 1.7 | 1.0 to 3.1 | ||
| Median | 2.6 | 3.0 | ||
| Range | 1.4-4.2 | 2.0-8.1 | ||
| PFS by histology | ||||
| Clear cell | 1.4 | 1.1 to 1.8 | ||
| Median | 8.1 | 10.8 | ||
| Range | 5.8-8.8 | 8.3-12.3 | ||
| Non–clear cell | 1.5 | 0.9 to 2.8 | ||
| Median | 5.1 | 7.2 | ||
| Range | 2.6-7.9 | 5.4-13.8 | ||
| Combined first-line and second-line PFS | 1.3 | 0.9 to 1.7 | ||
| Median | 21.1 | 25.8 | ||
| Range | 15.0-25.9 | 16.0-NA | ||
| First-line best response | ||||
| Complete response | ||||
| No. | 1 | 3 | ||
| % | < 1 | 1 | ||
| Partial response | ||||
| No. | 18 | 59 | ||
| % | 8 | 25 | ||
| Stable disease | ||||
| No. | 137 | 121 | ||
| % | 58 | 52 | ||
| Progression | ||||
| No. | 49 | 33 | ||
| % | 21 | 14 | ||
| Nonevaluable | ||||
| No. | 33 | 17 | ||
| % | 14 | 7 | ||
Abbreviations: HR, hazard ratio; MSKCC, Memorial Sloan-Kettering Cancer Center; NA, not available; PFS, progression-free survival.
Bayesian posterior probabilities for first-line PFS: Pr (HR ≤ 1.1 | data) = 0.009; Pr (HR ≤ 1.27 | data) = 0.146I.
80% CI, 1.24 to 1.74.
Fig 2.

Progression-free survival (PFS) for first-line everolimus (EVE) and first-line sunitinib (SUN; Kaplan-Meier [K-M]).
Fig 3.
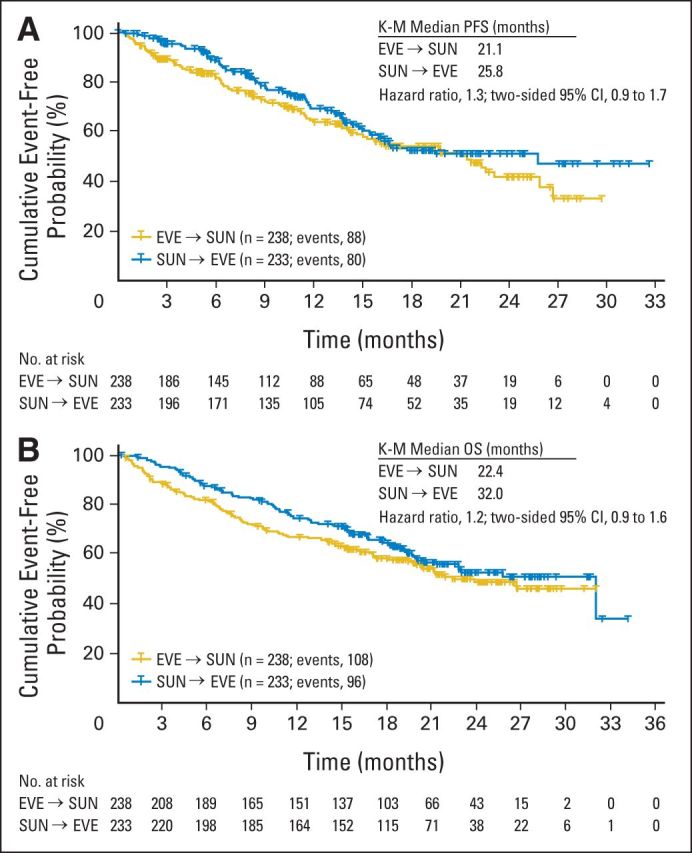
Combined first-line and second-line (A) progression-free survival (PFS; Kaplan-Meier [K-M]) and (B) overall survival (OS; K-M). EVE, everolimus; SUN, sunitinib.
Median OS was 22.4 months for first-line everolimus followed by sunitinib and was 32.0 months for first-line sunitinib followed by everolimus (HR, 1.2; 95% CI, 0.9 to 1.6; Fig 3B). Similar proportions in each sequence (first-line and second-line combined) died: 45% (n = 108) in the everolimus-then-sunitinib arm and 41% (n = 96) in the sunitinib-then-everolimus arm. More deaths occurred during first-line everolimus (14%; n = 34) than sunitinib (6%; n = 14); most deaths were a result of mRCC (10% v 2% for everolimus v sunitinib). Two on-treatment deaths (1%) were suspected to be related to first-line everolimus, and three on-treatment deaths (1%) were suspected to be related to first-line sunitinib. The rate of second-line on-treatment deaths was 3% (n = 8) for everolimus and 4% (n = 9) for sunitinib.
Treatment Administration and Safety
The median durations of therapy were 5.6 months for first-line everolimus and 8.3 months for sunitinib; the median relative dose intensities were 94% and 85%, respectively. A lower percentage required dose reductions during first-line everolimus therapy (30%) than first-line sunitinib (51%), but similar percentages required dose interruptions (67% and 68%, respectively). There was a low crossover rate (< 50%) from first-line therapy to second-line sunitinib (n = 108; 45%) or everolimus (n = 99; 43%; Table 3). The median durations of second-line therapy were 2.8 months for everolimus and 4.2 months for sunitinib; the median relative dose intensities were 98% and 87%, respectively. A higher percentage of patients required dose reductions during second-line sunitinib (37%) than everolimus (19%); similar percentages of patients required dose interruptions (58% and 53%, respectively).
Table 3.
Discontinuations and Reasons for Not Crossing Over to Second-Line Therapy
| First-Line Treatment Arm |
||||
|---|---|---|---|---|
| Everolimus (n = 238) |
Sunitinib (n = 233)* |
|||
| No. | % | No. | % | |
| Patients who discontinued first-line treatment | 201 | 85 | 192 | 82 |
| Patients who did not cross over to second-line after first-line discontinuation | 93 | 39 | 93 | 40 |
| Reason for not crossing over | ||||
| Death | 37 | 40 | 22 | 24 |
| Protocol deviation | 17 | 18 | 19 | 20 |
| Not eligible to cross over† | 23 | 25 | 27 | 29 |
| Withdrew consent | 15 | 16 | 19 | 20 |
| Lost to follow-up | 0 | 0 | 1 | < 1 |
| Not applicable‡ | 1 | < 1 | 5 | 5 |
Two patients randomly assigned to sunitinib did not receive treatment.
Ineligibility included poor performance status or decline in condition related to progressive disease (38%), brain metastases (22%), persistent adverse event (20%), and other (20%).
Patients crossed over after the cutoff date.
Common treatment-emergent AEs are listed in Tables 4 and 5 for first-line and second-line therapy, respectively. During first-line everolimus, 7% of patients experienced any-grade noninfectious pneumonitis; 1% and less than 1% of patients experienced grade 3 or 4 noninfectious pneumonitis, respectively. During second-line everolimus, 5% of patients experienced any-grade noninfectious pneumonitis; there were no occurrences of grade 3 or 4 noninfectious pneumonitis.
Table 4.
Treatment-Emergent Adverse Events With ≥ 10% Incidence During First-Line Therapy
| Adverse Event | Event Rate by Treatment Arm and Grade (%) |
|||||
|---|---|---|---|---|---|---|
| Everolimus (n = 238) |
Sunitinib (n = 231) |
|||||
| All Grades | Grade 3 | Grade 4 | All Grades | Grade 3 | Grade 4 | |
| Stomatitis | 53 | 6 | 0 | 57 | 4 | 0 |
| Fatigue | 45 | 8 | 1 | 51 | 14 | < 1 |
| Diarrhea | 38 | 4 | 1 | 57 | 8 | < 1 |
| Cough | 38 | 2 | 0 | 23 | < 1 | 0 |
| Rash | 37 | 2 | 0 | 23 | 0 | 0 |
| Nausea | 34 | 2 | 0 | 49 | 3 | 0 |
| Decreased appetite | 29 | 3 | 0 | 34 | 3 | 0 |
| Anemia | 28 | 11 | 4 | 21 | 7 | 1 |
| Peripheral edema | 28 | < 1 | 0 | 20 | 1 | 0 |
| Dyspnea | 25 | 6 | 1 | 18 | 4 | < 1 |
| Pyrexia | 23 | 1 | 0 | 16 | < 1 | 0 |
| Dysgeusia | 21 | 0 | 0 | 31 | 0 | 0 |
| Decreased weight | 21 | 1 | 0 | 14 | 1 | 0 |
| Vomiting | 21 | 2 | 0 | 30 | 3 | < 1 |
| Back pain | 19 | 2 | 0 | 22 | 2 | 0 |
| Headache | 19 | 1 | 0 | 18 | < 1 | 0 |
| Constipation | 19 | < 1 | 0 | 25 | 1 | 0 |
| Epistaxis | 17 | 0 | 0 | 20 | 1 | < 1 |
| Pruritis | 16 | < 1 | < 1 | 13 | 0 | 0 |
| Arthralgia | 16 | 1 | < 1 | 13 | 1 | 0 |
| Hyperglycemia | 16 | 6 | < 1 | 5 | 1 | < 1 |
| Abdominal pain | 15 | 3 | 0 | 13 | 4 | 0 |
| Insomnia | 15 | < 1 | 0 | 12 | 1 | 0 |
| Increased blood creatinine | 13 | 3 | 0 | 11 | 2 | < 1 |
| Pain in extremity | 13 | 1 | 0 | 16 | 1 | 0 |
| Asthenia | 12 | 1 | < 1 | 24 | 5 | < 1 |
| Dizziness | 12 | 1 | 0 | 10 | 1 | 0 |
| Dry skin | 11 | 0 | 0 | 13 | 0 | 0 |
| Pneumonia | 10 | 5 | 0 | 4 | 3 | < 1 |
| Hypertension | 10 | 4 | 0 | 36 | 12 | 0 |
| Upper abdominal pain | 8 | < 1 | < 1 | 13 | < 1 | 0 |
| Dehydration | 8 | 2 | 1 | 10 | 2 | < 1 |
| Upper respiratory tract infection | 7 | 0 | 0 | 12 | < 1 | 0 |
| Hand-foot syndrome | 6 | < 1 | 0 | 40 | 17 | 0 |
| Dyspepsia | 5 | 0 | 0 | 24 | < 1 | 0 |
| Thrombocytopenia | 4 | 1 | 0 | 26 | 9 | 4 |
| Neutropenia | 3 | 1 | 0 | 18 | 12 | 0 |
| Gastroesophageal reflux | 3 | < 1 | 0 | 10 | < 1 | 0 |
| Hypothyroidism | 2 | 0 | 0 | 23 | 1 | 0 |
| Yellow skin | 0 | 0 | 0 | 12 | 0 | 0 |
| Noncardiac chest pain | 8 | < 1 | 0 | 10 | < 1 | 0 |
NOTE. Incidence was ≥ 10% for at least one of the first-line agents.
Table 5.
Treatment-Emergent Adverse Events With ≥ 10% Incidence During Second-Line Therapy
| Adverse Event | Event Rate by Treatment Arm and Grade (%) |
|||||
|---|---|---|---|---|---|---|
| Everolimus (n = 99) |
Sunitinib (n = 108) |
|||||
| All Grades | Grade 3 | Grade 4 | All Grades | Grade 3 | Grade 4 | |
| Fatigue | 32 | 9 | 2 | 37 | 12 | 0 |
| Anemia | 26 | 15 | 0 | 10 | 3 | 2 |
| Stomatitis | 25 | 1 | 0 | 28 | 3 | 0 |
| Decreased appetite | 23 | 3 | 0 | 29 | 2 | 0 |
| Dyspnea | 21 | 5 | 1 | 14 | 4 | 0 |
| Cough | 21 | 1 | 0 | 11 | 0 | 0 |
| Rash | 19 | 0 | 0 | 8 | 0 | 0 |
| Back pain | 18 | 2 | 0 | 12 | 2 | 0 |
| Peripheral edema | 16 | 1 | 0 | 16 | 2 | 0 |
| Nausea | 15 | 2 | 0 | 37 | 4 | 0 |
| Diarrhea | 13 | 1 | 0 | 46 | 7 | 0 |
| Arthralgia | 13 | 2 | 0 | 8 | 1 | 0 |
| Insomnia | 13 | 0 | 0 | 4 | 0 | 0 |
| Hyperglycemia | 13 | 3 | 1 | 3 | 1 | 0 |
| Pyrexia | 12 | 0 | 0 | 15 | 0 | 0 |
| Epistaxis | 12 | 1 | 0 | 9 | 0 | 0 |
| Asthenia | 11 | 4 | 0 | 14 | 2 | 0 |
| Constipation | 11 | 0 | 0 | 17 | 0 | 0 |
| Pain in extremity | 10 | 2 | 0 | 14 | 1 | 0 |
| Abdominal pain | 10 | 3 | 0 | 11 | 3 | 1 |
| Decreased weight | 10 | 1 | 0 | 11 | 0 | 0 |
| Pruritus | 10 | 1 | 0 | 4 | 0 | 0 |
| Vomiting | 9 | 2 | 0 | 25 | 3 | 0 |
| Noncardiac chest pain | 9 | 1 | 0 | 11 | 2 | 0 |
| Dysgeusia | 7 | 0 | 0 | 23 | 1 | 0 |
| Dyspepsia | 6 | 0 | 0 | 16 | 1 | 0 |
| Hypertension | 3 | 1 | 0 | 27 | 12 | 0 |
| Neutropenia | 3 | 0 | 0 | 10 | 4 | 0 |
| Hand-foot syndrome | 2 | 0 | 0 | 27 | 8 | 0 |
| Thrombocytopenia | 2 | 1 | 0 | 23 | 9 | 1 |
| Hypothyroidism | 0 | 0 | 0 | 12 | 0 | 0 |
NOTE. Incidence was ≥ 10% for at least one of the second-line agents.
PROs
PRO analyses focused on the first-line period because of low crossover rate to second-line therapy. Longitudinal analysis of FKSI-DRS demonstrated improved scores over time for first-line sunitinib compared with first-line everolimus (Appendix Fig A2, online only). The time to definitive deterioration (TDD) analysis of FKSI-DRS also favored first-line sunitinib over everolimus (HR, 1.45). Alternatively, EORTC QLQ-C30 global health status scores, fatigue scores, and physical functioning scores showed no significant difference between the two arms in both TDD and the longitudinal analysis.
Because the day 1 PRO visits occurred after sunitinib patients had a 14-day break from dosing, post hoc sensitivity analyses were conducted with only data from the day 28 on-treatment visits. The FKSI-DRS longitudinal and TDD analyses, which previously favored sunitinib, were nonsignificant between arms when assessed at day 28 only (Appendix Figs 3A and 3B, online only). In the longitudinal sensitivity analysis, EORTC QLQ-C30 global health status/quality of life and fatigue scores, which were previously equivocal, demonstrated a significant benefit to everolimus (Appendix Figs 4A and 4B, online only). The longitudinal analysis of EORTC QLQ-C30 in physical functioning and all TDD analyses in EORTC QLQ-C30 scores remained comparable in the sensitivity analysis.
DISCUSSION
This study forged new ground through a head-to-head comparison of two different therapies in the first-line setting and a direct evaluation of alternative first-line and second-line sequences of therapies. The primary objective of this large, randomized, phase II trial was to demonstrate noninferiority of everolimus over sunitinib in terms of PFS during or after first-line treatment of patients with mRCC. On the basis of the first-line PFS HR estimates (point and upper bound of the one-sided 90% CI), everolimus did not demonstrate noninferiority compared with sunitinib. With respect to assessing inferiority of everolimus versus sunitinib, the estimated lower-bound one-sided 90% CI was calculated. The bound equaled 1.24, which was lower than the predefined noninferiority margin of 1.27; therefore, inferiority of everolimus versus sunitinib could not formally be concluded.10 The observed median PFS was shorter for first-line everolimus (7.9 months) than for first-line sunitinib (10.7 months; HR, 1.4; 95% CI, 1.2 to 1.8). These clinically relevant differences support the standard treatment sequence, whereby patients who experience progression on (or are intolerant of) first-line sunitinib are subsequently treated with everolimus.
Likewise, results of the combined PFS analysis and the preliminary OS results support the standard treatment paradigm. First-line PFS was also evaluated according to subsets that were based on MSKCC risk group and histology. Longer PFS for sunitinib compared with everolimus was consistent across both analyses. However, the non–clear cell and poor-risk subsets were small; each comprised approximately 15% of the study population. The ASPEN (Phase II Study of Afinitor v Sutent in Patients With Metastatic Non–Clear Cell Renal Cell Carcinoma) trial will provide additional outcome results in the non–clear cell population for everolimus versus sunitinib.
Our hypotheses for conducting this trial design was that similar combined PFS lengths would be achieved by both sequences and that everolimus would be better tolerated than sunitinib as the first-line therapy. Noninferiority of first-line everolimus compared with sunitinib was selected as the primary end point because feasibility for the combined PFS end point had not been established previously. To this point, nearly two thirds of patients were censored in analysis for this secondary end point. Therefore, caution is required when interpreting combined PFS estimates. One primary reason for the high proportion of censoring included lack of crossover to second-line study treatment after first-line progression. The RECORD-4 trial will provide additional insight into PFS with second-line everolimus for patients with clear cell mRCC.
The observed AEs were consistent with the known safety profiles of everolimus and sunitinib and differentiated by their respective mTOR inhibitor and VEGFR tyrosine kinase inhibitor class. The rate of noninfectious pneumonitis associated with everolimus was lower in this study than in the pivotal phase III trial, in which noninfectious pneumonitis occurred in 14% of patients (grade 3: 4%; grade 4: 0%).5 In this phase II study, the rate of noninfectious pneumonitis was lower regardless of whether patients were previously untreated or had experienced progression on sunitinib; rates were 7% overall (grade 3: 1%; grade 4: < 1%) in patients who received first-line everolimus and 5% overall (grades 3 and 4: 0%) in patients who received second-line everolimus. Also, results from this study and those reported in RECORD-15 demonstrate that everolimus as first- or later-line treatment in mRCC does not impair patient quality of life.
This phase II design has limitations because of the sample size, which was smaller than an equivalent confirmatory trial. Therefore, this study was not designed to deliver definitive evidence but was considered sufficient for reliable judgment regarding the potential success of a forthcoming phase III study. Two criteria were used to declare noninferiority of everolimus versus sunitinib in terms of first-line PFS7 to combine a reasonably promising treatment effect estimate and good evidence that everolimus is better than the noninferior margin. A full discussion of this double-criteria approach applied to RECORD-3 was published in a separate statistical paper.7 Operating characteristics of this design were tested through simulations and properties were deemed adequate in this phase II setting.
In summary, everolimus did not demonstrate noninferiority compared with sunitinib as a first-line therapy for patients with mRCC. The trial results support the standard treatment paradigm of first-line sunitinib followed by everolimus at progression. The safety profiles of everolimus and sunitinib were differentiated according to their respective classes.
Acknowledgment
We thank Sujata Patil, PhD, and Alexandra Vaury, MSc, for critically reviewing the statistical methods of our manuscript. Editorial assistance was provided by ApotheCom (Yardley, PA) and was funded by Novartis Pharmaceuticals.
Glossary Terms
- everolimus:
see RAD001.
- RAD001:
an orally active derivative of rapamycin, RAD001 (also known as everolimus) is an inhibitor of mammalian target of rapamycin. See mammalian target of rapamycin (mTOR).
- sunitinib:
an oral small molecular tyrosine kinase inhibitor that exhibits potent antiangiogenic and antitumor activity. Also known as SU011248 or Sutent (Pfizer, New York, NY).
Appendix
Table A1.
Baseline Characteristics in the Second-Line Setting
| Characteristic | Treatment Arm |
|||
|---|---|---|---|---|
| Everolimus (n = 99) |
Sunitinib (n = 108) |
|||
| No. | % | No. | % | |
| Age, years | ||||
| Median | 61 | 62 | ||
| Range | 29-82 | 20-89 | ||
| Sex | ||||
| M | 74 | 75 | 80 | 74 |
| F | 25 | 25 | 28 | 26 |
| Ethnicity | ||||
| White | 74 | 75 | 70 | 65 |
| Asian | 16 | 16 | 23 | 21 |
| Black | 3 | 3 | 3 | 3 |
| Other | 6 | 6 | 12 | 11 |
| KPS at first-line baseline | ||||
| ≥ 90 | 77 | 78 | 79 | 73 |
| 80 | 19 | 19 | 22 | 20 |
| 70 | 3 | 3 | 7 | 7 |
| Predominant tumor histology | ||||
| Clear cell | 83 | 84 | 92 | 85 |
| Non–clear cell | 16 | 16 | 15 | 14 |
| Missing | 0 | 0 | 1 | < 1 |
| No. of metastatic sites* | ||||
| ≥ 2 | 68 | 69 | 78 | 72 |
| 1 | 31 | 31 | 29 | 27 |
| 0† | 0 | 0 | 1 | < 1 |
| Organ involvement | ||||
| Lung | 66 | 67 | 76 | 70 |
| Bone | 23 | 23 | 27 | 25 |
| Lymph node (cervical/thoracic) | 17 | 17 | 12 | 11 |
| Liver | 14 | 14 | 15 | 14 |
| MSKCC prognosis | ||||
| Favorable | 21 | 21 | 36 | 33 |
| Intermediate | 65 | 66 | 64 | 59 |
| Poor | 13 | 13 | 8 | 7 |
Abbreviations: KPS, Karnofsky performance status; MSKCC, Memorial Sloan-Kettering Cancer Center.
Accounts for RECIST data.
Randomly assigned with local kidney disease and no metastatic sites per RECIST definition.
Fig A1.

RECORD-3 study design. (*) At random assignment, patients were stratified by Memorial Sloan-Kettering Cancer Center prognostic factors. (†) Dosing schedule: 4 weeks on and 2 weeks off. ORR, objective response rate; OS, overall survival; PFS, progression-free survival.
Fig A2.

Longitudinal analysis of mean Functional Assessment of Cancer Therapy-Kidney Symptom Index, Disease-Related Symptom (FKSI-DRS) scores over time for first-line everolimus (EVE) and first-line sunitinib (SUN). Questionnaires were collected on day 1 and day 28 of each cycle. C1D1 = cycle 1 day 1; C2D1 = cycle 2 day 1; and so forth.
Fig A3.
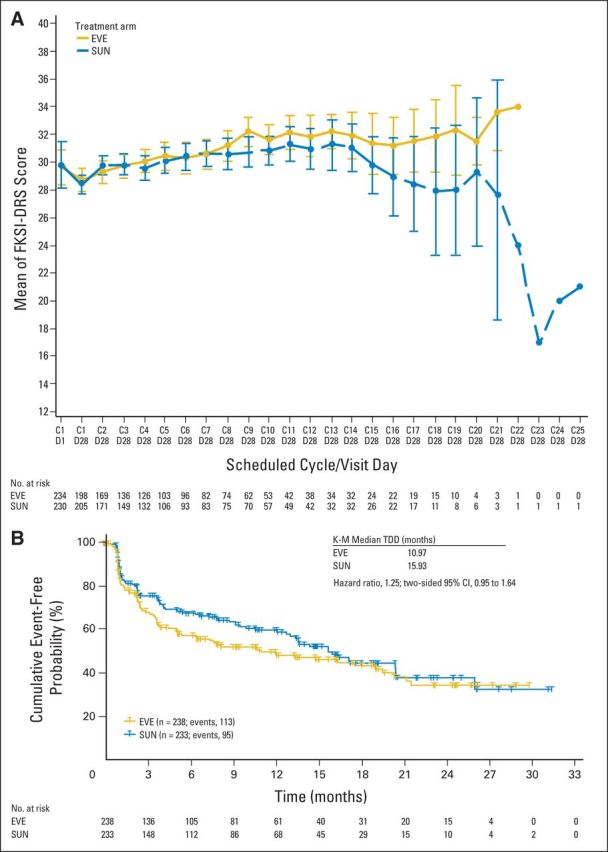
Functional Assessment of Cancer Therapy-Kidney Symptom Index, Disease-Related Symptoms (FKSI-DRS; A) longitudinal and (B) time to definitive deterioration (TDD) post hoc sensitivity analyses at day 28 for first-line everolimus (EVE) and first-line sunitinib (SUN). Questionnaires were collected on day 1 and day 28 of each cycle; data are presented for day 1 and day 28 of cycle 1 and for day 28 of each cycle thereafter. C1D1 = cycle 1 day 1; C1D28 = cycle 1 day 28; and so forth. K-M, Kaplan-Meier.
Fig A4.
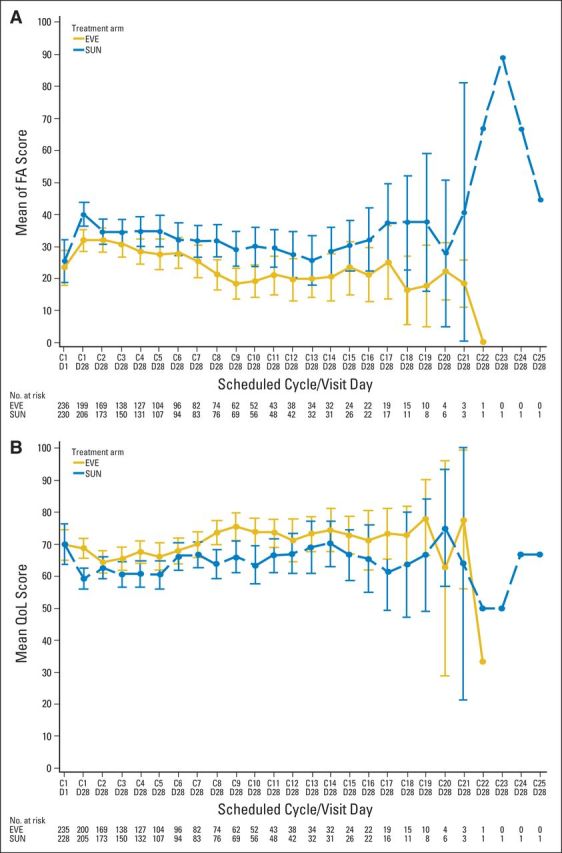
QLQ-C30 (A) fatigue longitudinal sensitivity analyses and (B) global health status at day 28. Questionnaires were collected on day 1 and day 28 of each cycle; data are presented for day 1 and day 28 of cycle 1 and for day 28 of each cycle thereafter. C1D1 = cycle 1 day 1; C1D28 = cycle 1 day 28; and so forth. EVE, everolimus; FA, fatigue; QoL, quality of life; QLQ-C30, Core Quality of Life Questionnaire; SUN, sunitinib.
Footnotes
RECORD-3 was sponsored by Novartis Pharmaceuticals.
Presented in part at the 49th Annual Meeting of the American Society of Clinical Oncology, May 31-June 4, 2013, Chicago, IL.
Clinical trial information: NCT00903175.
Terms in blue are defined in the glossary, found at the end of this article and online at www.jco.org.
Authors' disclosures of potential conflicts of interest and author contributions are found at the end of this article.
AUTHORS' DISCLOSURES OF POTENTIAL CONFLICTS OF INTEREST
Although all authors completed the disclosure declaration, the following author(s) and/or an author's immediate family member(s) indicated a financial or other interest that is relevant to the subject matter under consideration in this article. Certain relationships marked with a “U” are those for which no compensation was received; those relationships marked with a “C” were compensated. For a detailed description of the disclosure categories, or for more information about ASCO's conflict of interest policy, please refer to the Author Disclosure Declaration and the Disclosures of Potential Conflicts of Interest section in Information for Contributors.
Employment or Leadership Position: Edward Schiff, Novartis (U); Xufang Wang, Novartis (C); Julie Niolat, Novartis (C); Dalila Sellami, Novartis (C); Oezlem Anak, Novartis (C) Consultant or Advisory Role: Robert J. Motzer, Pfizer (C), Genentech (C), AVEO Pharmaceuticals (C); Carlos H. Barrios, Novartis (C); Kenneth B. Pittman, Novartis (C), Pfizer (C); Sevil Bavbek, Pfizer (U), Novartis (U), GlaxoSmithKline (U); Sunil Yadav, Novartis (C); Jennifer Knox, Pfizer (U), Novartis (U) Stock Ownership: Edward Schiff, Novartis; Xufang Wang, Novartis; Dalila Sellami, Novartis; Oezlem Anak, Novartis Honoraria: Carlos H. Barrios, Novartis; Kenneth B. Pittman, Novartis, Pfizer; Thomas W. Flaig, Amgen; Sevil Bavbek, Novartis, Pfizer, GlaxoSmithKline; Sunil Yadav, Novartis, Pfizer Research Funding: Robert J. Motzer, Novartis, Pfizer, GlaxoSmithKline; Carlos H. Barrios, Novartis; Thomas Cosgriff, Novartis; Thomas W. Flaig, Amgen, Bayer AG/Onyx Pharmaceuticals, Genentech, GlaxoSmithKline, Novartis, Pfizer, ZymoGenetics; Ray Page, Pfizer; J. Thaddeus Beck, Novartis; Jennifer Knox, Pfizer, Novartis Expert Testimony: Robert J. Motzer, Pfizer (C) Patents, Royalties, and Licenses: None Other Remuneration: None
AUTHOR CONTRIBUTIONS
Conception and design: Robert J. Motzer, Edward Schiff, Oezlem Anak, Jennifer Knox
Provision of study materials or patients: Robert J. Motzer, Tae Min Kim, Kenneth B. Pittman, Sun Young Rha, J. Thaddeus Beck, Poulam Patel, Sunil Yadav, Jennifer Knox
Collection and assembly of data: Robert J. Motzer, Carlos H. Barrios, Tae Min Kim, Silvia Falcon, Thomas Cosgriff, Vichien Srimuninnimit, Roberto Sabbatini, Sun Young Rha, Thomas W. Flaig, Ray Page, Sevil Bavbek, J. Thaddeus Beck, Foon-yiu Cheung, Sunil Yadav, Edward Schiff, Dalila Sellami, Oezlem Anak, Jennifer Knox
Data analysis and interpretation: Robert J. Motzer, Thomas Cosgriff, W. Graydon Harker, Kenneth B. Pittman, Sun Young Rha, Thomas W. Flaig, J. Thaddeus Beck, Poulam Patel, Edward Schiff, Xufang Wang, Julie Niolat, Oezlem Anak, Jennifer Knox
Manuscript writing: All authors
Final approval of manuscript: All authors
REFERENCES
- 1.National Comprehensive Cancer Network (NCCN) Clinical Practice Guidelines in Oncology: Kidney Cancer (version 1.2013) [DOI] [PubMed]
- 2.Escudier B Eisen T Porta C, etal: Renal cell carcinoma: ESMO Clinical Practice Guidelines for diagnosis, treatment and follow-up Ann Oncol 23:vii65–vii71,2012suppl 7 [DOI] [PubMed] [Google Scholar]
- 3.Motzer RJ Hutson TE Tomczak P, etal: Sunitinib versus interferon alfa in metastatic renal-cell carcinoma N Engl J Med 356:115–124,2007 [DOI] [PubMed] [Google Scholar]
- 4.Motzer RJ Hutson TE Tomczak P, etal: Overall survival and updated results for sunitinib compared with interferon alfa in patients with metastatic renal cell carcinoma J Clin Oncol 27:3584–3590,2009 [DOI] [PMC free article] [PubMed] [Google Scholar]
- 5.Motzer RJ Escudier B Oudard S, etal: Phase 3 trial of everolimus for metastatic renal cell carcinoma: Final results and analysis of prognostic factors Cancer 116:4256–4265,2010 [DOI] [PubMed] [Google Scholar]
- 6.Motzer RJ Bacik J Murphy BA, etal: Interferon-alfa as a comparative treatment for clinical trials of new therapies against advanced renal cell carcinoma J Clin Oncol 20:289–296,2002 [DOI] [PubMed] [Google Scholar]
- 7.Neuenschwander B Rouyrre N Hollaender N, etal: A proof of concept phase II non-inferiority criterion Stat Med 30:1618–1627,2011 [DOI] [PubMed] [Google Scholar]
- 8.Little R: Calibrated Bayes, for statistics in general, and missing data in particular Stat Sci 26:162–174,2011 [Google Scholar]
- 9.Little R: Calibrated Bayes: A Bayes/frequentist roadmap Am Stat 60:1–11,2006 [Google Scholar]
- 10.Piaggio G Elbourne DR Altman DG, etal: Reporting of noninferiority and equivalence randomized trials: An extension of the CONSORT statement JAMA 295:1152–1160,2006 [DOI] [PubMed] [Google Scholar]