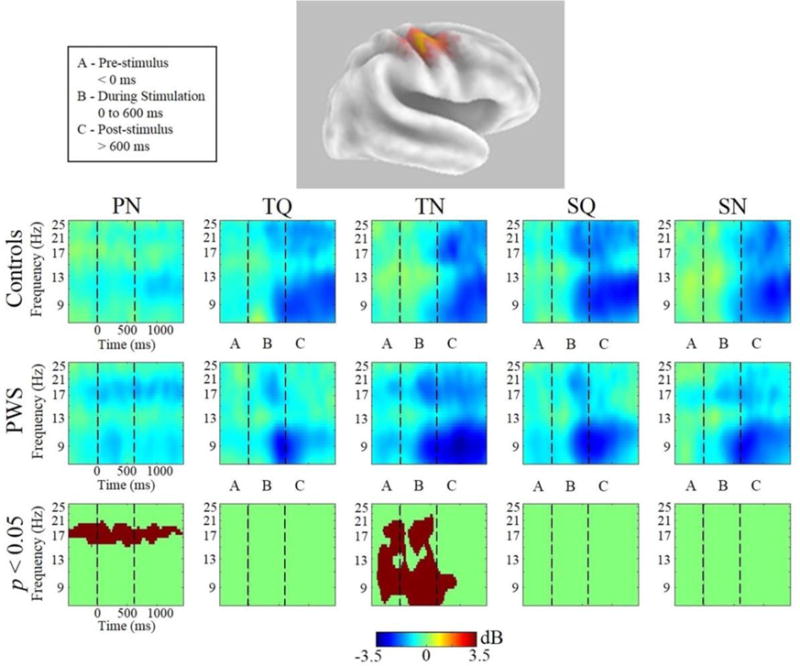
Figure 6.

Right μ Time-Frequency Analyses. sLORETA source solution for combined cluster of all right μ components followed by time-frequency analyses of right μ oscillatory activity from all conditions from PWS and control subjects. Stimulus onset is at t=0. Warmer colors indicate event-related synchronization and cooler colors indicate event-related desynchronization. The lower panels indicate the time-frequency voxels that were significantly different (p < 0.05) between the groups (after cluster-based corrections for multiple comparisons).
