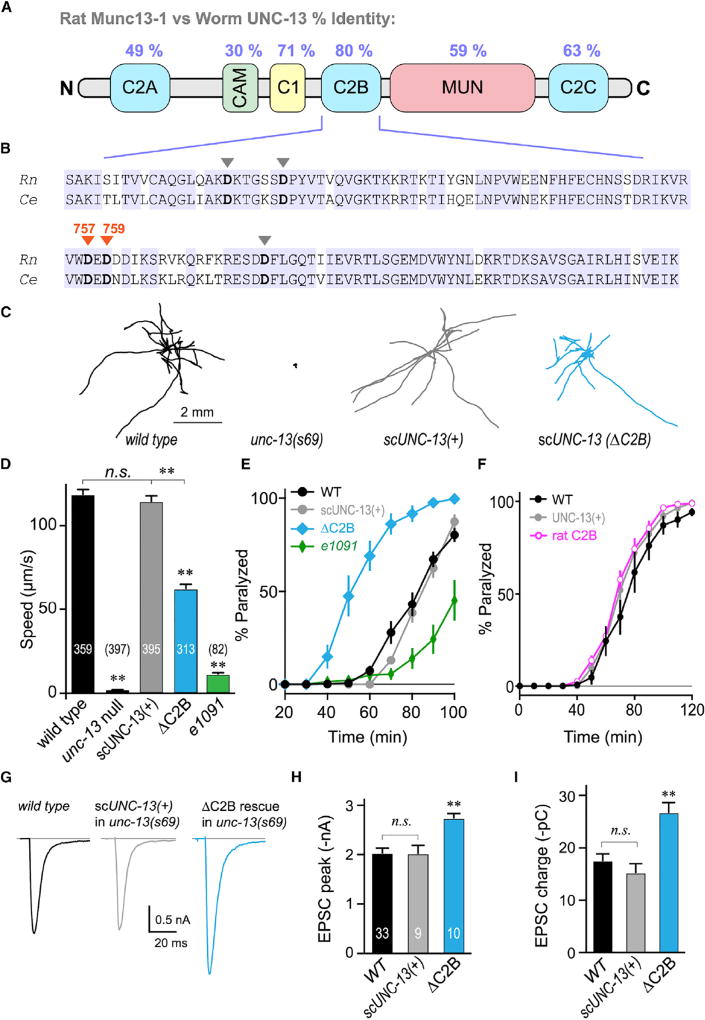
Figure 1. The UNC-13 C2B Domain Is Required for Normal Locomotion and Inhibits ACh Secretion.
(A) Cartoon depicting the six major protein domains of the canonical Munc13 protein along with protein sequence identity between rat and worm.
(B) C2B sequence alignment for rat Munc13-1 and worm UNC-13L. Identical residues are highlighted (blue) and the five calcium-binding aspartates are indicated with arrowheads. The two loop 3 aspartates mutated in this study are specified (orange).
(C) Ten representative locomotion trajectories collected over a 1 min interval are plotted for WT (black), unc-13(s69) null mutant, unc-13(s69) rescued with a single-copy integrant of full-length UNC-13 (scUNC-13(+); gray), and unc-13(s69) rescued with a single-copy UNC-13 integrant lacking its C2B domain (ΔC2B; blue).
(D) Average locomotion rates are compared for the same four strains as well as the hypomorph unc-13(e1091). Note that scUNC-13(+) and ΔC2B are expressed in the unc-13(s69) null background. The number of animals analyzed is indicated in the graph.
(E) Average paralysis time courses for wild-type (WT; black), unc-13(s69) expressing a full-length rescue (scUNC-13(+); gray), unc-13(e1091) hypomorph (green), and unc-13(s69) expressing UNC-13 lacking its C2B domain (ΔC2B; blue).
(F) Average paralysis time courses for wild-type (WT; black) and unc-13(69) rescued with an extrachromosomal array of either full-length UNC-13 (UNC-13(+); gray) or UNC-13 containing the rat Munc13-1 C2B domain (rat C2B; pink).
(G) Average traces of stimulus-evoked EPSCs for WT (black), single-copy rescue in unc-13(s69) (scUNC-13(+); gray), and ΔC2B rescue in unc-13(s69) (ΔC2B; blue).
(H and I) Average EPSC peak amplitude (H) and cumulative charge transfer (I) for the same three genotypes.
Errors bars are mean ± SEM (**p < 0.01; n.s., not significant by ANOVA and Tukey-Kramer test for multiple comparisons). Strains: N2, BC168, CB1091, JSD805, JSD925, JSD1038, and JSD1039.

