

Abstract
Inhibition of the aryl hydrocarbon receptor (AHR) prevents Western diet-induced obesity and fatty liver in C57Bl/6J (B6) male mice. The AHR is a ligand-activated nuclear receptor that regulates genes involved in xenobiotic metabolism and T cell differentiation. Here, we tested the hypothesis that AHR antagonism would also prevent obesity and fatty liver in female mice and that B6 mice (higher-affinity AHR) and congenic B6.D2 mice (lower-affinity AHR) would differentially respond to AHR inhibition. Female and male adult B6 and B6.D2 mice were fed control and Western diets with and without α-naphthoflavone, an AHR inhibitor. A nonlinear mixed model analysis was developed to project asymptote body mass. We found that obesity, adiposity, and liver steatosis were reduced to near control levels in all female and male B6 and B6.D2 experimental groups fed Western diet with α-naphthoflavone. However, differences were noted in that female B6.D2 versus B6 mice on Western diet became more obese; and in general, female mice to that of male mice had a greater fat mass to body mass ratio, were less responsive to α-naphthoflavone, and had reduced liver steatosis and hepatomegaly. We report that male mice fed Western diet containing α-naphthoflavone or CH-223191, another AHR inhibitor, caused reduced mRNA levels of several liver genes involved in metabolism, including Cyp1b1 and Scd1, offering evidence for a possible mechanism by which the AHR regulates obesity. In conclusion, although there are some sex- and Ahr allelic-dependent differences, AHR inhibition prevents obesity and liver steatosis in both males and females regardless of the ligand-binding capacity of the AHR. We also present evidence consistent with the notion that an AHR-CYP1B1-SCD1 axis is involved in obesity providing potentially convenient and effective targets for treatment.
Keywords: aryl hydrocarbon receptor, male and female obesity, hepatosteatosis, AHR inhibition and obesity therapy, AHR-CYP1B1-SCD1 axis
1. Introduction
Obesity is a growing and increasingly challenging problem with a prevalence in the United States of 16.9% for 2- to 19-year-olds and 34.9% for adults aged 20 years and older [1]. It is well established that obesity [2] and associated complications [3, 4] develop differently between males and females; and that gene expression profiles in liver and adipose tissue are dissimilar in male and female mice [5]. Given that the aryl hydrocarbon receptor (AHR) has a large role in obesity in male mice [6–8], we asked whether the AHR carries out a similar role in obesity for females.
The AHR is a ligand-activated nuclear receptor/transcription factor [9] (Fig. 1A). In the cytoplasm, the ligand-free AHR is in a complex with two HSP90 molecules, at least one p45 protein identified as an immunophilin [10, 11], and the co-chaperone p23 protein [12]. In canonical AHR signaling, ligand binding alters the complex allowing the translocation of the AHR to the nucleus and partnering with the aryl hydrocarbon nuclear translocator (ARNT). The nuclear AHR/ARNT heterodimer binds to core CACGC DNA motifs called DREs (dioxin response elements) present in the regulatory regions of several thousand genes [13] to activate transcription. Because of the AHR’s ligand-binding promiscuity, several AHR ligands, such as α-naphthoflavone (NF) (Fig. 1B), have been identified that act as antagonists to inhibit AHR signaling [14].
Fig. 1.
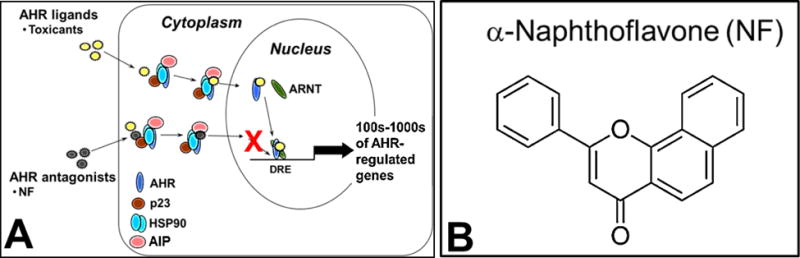
The aryl hydrocarbon receptor (AHR) signaling pathway (A) is best known for the induction of xenobiotic metabolizing genes via activation by environmental toxicants. AHR activation can be inhibited by AHR antagonists such as α-naphthoflavone (NF) (B) by decreasing AHR-directed transcription.
We first showed the involvement of the AHR in obesity using two male mouse models that differ at the Ahr gene [6]. The C57Bl/6 mouse (B6 strain) expresses an AHR possessing a generally higher-affinity ligand binding domain encoded by the Ahrb1 allele, and the congenic C57Bl/6.D2 mouse (B6.D2 strain) expresses an AHR more similar to that of the human AHR with a lower-affinity, ligand binding domain encoded by the Ahrd allele naturally found in the DBA/2 mouse strain [15]. The two AHRs differ by approximately 10-fold in 2,3,7,8-terachlorodibenzo-p-dioxin (TCDD) binding affinity [16], and in turn, AHR-based gene induction and gene expression levels of the Cyp1a1 and Cyp1a2 xenobiotic-metabolizing genes are correspondingly affected [17]. It should be noted; however, that the AHR displays a wide range of allelic-, ligand-, and species-specific binding affinities and activation [18–20]. Using male mice, we found that the B6 and B6.D2 mouse strains when fed Western diet were differentially affected in body size, body fat to body mass ratios, liver gene expression, and liver physiology [6].
We extended those studies in B6 male mice to show that NF and the more specific AHR antagonist CH-223191 [14, 21, 22] effectively reduced obesity and hepatosteatosis [7]. We also investigated how Western diet may activate the AHR. Based on in vivo and in vitro studies, we proposed a model that linked Western diet to AHR activation via Toll like receptor 2/4 and TGFβ signaling pathways stimulated by diet-derived compounds [7]. These studies and recent work with B6. Ahr−/− mice, which were shown to be resistant to obesity [7, 8, 23], indicated key roles for the AHR in fat metabolism and deposition as well as a possible target for AHR-based therapeutic and preventative approaches.
A major question is how the Western diet-activated AHR causes obesity, and in turn, how inhibition of AHR signaling then prevents obesity. An explanation may lie in recent studies showing that deletion of the canonical AHR-regulated Cyp1b1 gene prevents obesity in mice fed a high-fat diet [24–26]. Here, we initiate an investigation into AHR-based obesity by determining liver mRNA levels of the Cyp1b1 gene along with several other AHR-regulated genes involved in metabolism.
As most of the reported work on obesity has been carried out using male mice, we tested the hypothesis that the outcomes observed in male mice regarding the role of the AHR in obesity and steatosis would be similarly observed in females. Specifically, our objectives were to determine whether the AHR plays a role in diet-based obesity in females and whether the AHR antagonist NF could act as an obesity preventative in mice with different AHR ligand binding affinities. Congenic strains of female and male mice harboring different Ahr alleles encoding proteins with different ligand-binding affinities were fed control and Western diets with and without the AHR antagonist NF. The Western diet was high in animal fat and cholesterol to best reflect the typical human Western diet versus a low-fat, low-cholesterol control diet. Although several significant differences are described, we found that the AHR played parallel roles in the deposition and distribution of fat in male and female mice, and that both sexes responded fully to AHR antagonism regardless of ligand binding strength in preventing Western diet-based obesity and hepatosteatosis. These studies strengthen the contention that the AHR offers a potentially powerful approach to treat and prevent diet-induced obesity and fatty liver disease regardless of sex or AHR isoform.
2. Methods and materials
2.1 Mice
The B6 and B6.D2 male and female mice (Mus musculus strains C57BL/6J and B6.D2N-Ahrd/J, stock #s 000664 and 002921, respectively) were purchased from The Jackson Laboratory (Bar Harbor, ME). The mice were reared and bred in 12-hr light/dark cycles. Cages were bedded with chemical-free shredded paper (Pure-o-cell, The Andersons Lab Bedding, Maumee, OH) to minimize exposure to exogenous toxicants. Food consumption was determined during the 5-wk, 26-wk, and 40-wk diet regimens with four mice selected from different cages of each experimental group at week 3 for 7 days for the 5-wk diet regimen and at week 15 for 10–14 days for the 26- and 40-wk diet regimens [7]. The mice were housed individually in cages containing a chow-measuring apparatus. There were no significant differences in food consumption among the experimental groups for a given diet on a given diet regimen. NF or CH-223191 was mixed with the chow during production. Food consumption and thus NF and CH-223191 intake was ad libitum. In a dose-response experiment carried out in a previously reported study [7], we found that chow containing 2% NF was the minimal effective dose for preventing obesity in mice fed a Western diet. The calculated amount of consumed NF and CH-223191 was ~90mg/kg/day and ~10mg/kg/day, respectively. The calculations were based on a mean consumption of ~4.5 gm of chow/day (http://www.researchdiets.com/) and on an estimated adult mean body mass of 30g.
A power analysis [27] was carried out to determine the number of mice per experimental group required to reach an alpha probability of 0.01. Based on previous results showing the differential weight gains of B6 vs. B6.D2 mice [6], we could accurately estimate the mean mass and standard deviation. We set the power probability at 0.8 to arrive at a minimum 14 mice per experimental group. If obviously sick or death occurred, the mouse was eliminated from the study (4 or 5 of a total of ~256 mice were eliminated). Pups from a given litter of a given Ahr genotype and sex were placed in different experimental groups of the appropriate genotype and sex. The study was not blinded (the different chows were color coded). The variance appeared similar among the groups that were statistically compared. We did not observe any differences in lifespan or disease incidence among genotypes or sexes within the confines of our study. All animals were treated humanely following the regulations and specifications of the Dartmouth IACUC. The studies with mice were conducted using an animal protocol approved by the Dartmouth Hitchcock Medical Center Institutional Animal Care and Use Committee, IACUC PROTOCOL NUMBER toml.cr.1, ASSURANCE NUMBER A3259-01.
2.2 Diet
Mouse chow (Table 1) was purchased from Research Diets, Inc. (New Brunswick, NJ). The custom control, low-fat diet (D12450B) contained 20% kcal protein, 70% kcal carbohydrates (35% kcal from sucrose), 10% kcal fat (4.5% kcal from lard); and the custom Western diet (D12071702) contained 20% kcal protein, 35% kcal carbohydrates (17.5% kcal from sucrose), 45% kcal fat (40% kcal from lard), and 2% cholesterol. The diets contained no detectable phytoestrogens or xenobiotics. The NF (CAS Number 604-59-1, ≥98% purity) was purchased from Sigma-Aldrich (St. Louis, MO) and the CH-223191 (CAS Number 301326-22-7, ≥98% purity) from R&D Systems. (Minneapolis, MN). The NF and CH-223191 were added directly to the mouse food during production.
Table 1.
Diet Composition
| Diet Constituents | Diet
|
|
|---|---|---|
| Control | Western | |
|
| ||
| % kcal | % kcal | |
| Protein | 20 | 20 |
| Carbohydrate | 70 | 35 |
| Fat | 10 | 45 |
| Total | 100 | 100 |
|
| ||
| kcal/gm | 3.8 | 4.6 |
|
| ||
| Ingredients | gm/kg | gm/kg |
|
| ||
| Casein, 80 Mesh | 190 | 228 |
| L-Cystine | 3 | 3 |
| Corn Starch | 299 | 83 |
| Maltodextrin 10 | 33 | 114 |
| Sucrose | 332 | 197 |
| Cellulose, BW200 | 47 | 57 |
| Soybean Oil | 24 | 29 |
| Lard | 19 | 203 |
| Mineral Mix, S10026 | 9 | 11 |
| Dicalcium Phosphate | 12 | 15 |
| Calcium Carbonate | 5 | 6 |
| Potassium Citrate, 1 H2O | 16 | 19 |
| Vitamin Mix, V10001 | 9 | 11 |
| Choline Bitartrate | 2 | 2 |
| Cholesterol | 0 | 20 |
|
| ||
| Total grams | 1000 | 1000 |
2.3 Asymptote body mass data analysis
The metric for weight gain was pivotal in our study. The traditional way to compare the weight of animals across treatment groups is to pick time points near the end of the study and compare the mean weights at those points. Although weight gain measured as the difference among consecutive weeks is intuitively appealing, it is skewed left because weight gain is not symmetric with respect to age, and consequently, the asymmetry of weight distribution violates a key assumption required for the t-test. In other words, conventional weight gain analysis would be appropriate if weight grew linearly with age as a constant. However, weight does not increase in a linear fashion and a better metric is the projected asymptote weight when the animals have reached later adulthood. Here, the asymptote models are based on body mass accumulated over the 26-wk diet regimen, and thus, accounts for variables based on all prior biological inputs. We estimated asymptote weight using the exponential model a1-a2exp(-a3w), where w>0 is the time measured in weeks, a3 is the rate at which the weight approaches the asymptote weight a1, and a1-a2 is the initial weight at w=0. Nonlinear mixed model methodology was used to estimate the average asymptote weight a1 (when w is at infinity) for each treatment group. An important property of the mixed model is that it addresses the notorious animal to animal weight heterogeneity [28]. The R function nlme package was used to estimate the parameters of the model.
2.4 Magnetic resonance imaging
Small animal magnetic resonance imaging (MRI) was carried out by the Dartmouth Irradiation, Pre-clinical Imaging & Microscopy Shared Resource. At weeks 8, 14, and 24 of the 26-wk diet regimen, prior to imaging, mice were anaesthetized with 2% isoflourane via nosecone (n=4–6 per experimental group). MRI images were acquired on an Agilent 9.4T scanner equipped with triple axes gradient coils and VnmrJ software (Agilent Technologies, Santa Clara, CA, www.agilent.com). Temperature and respiration rates were monitored using the small animal physiological monitoring system (Small Animal Instruments, Inc., Stony Brook, NY, www.i4sa.com). Images were acquired using a spin echo sequence, with an additional water suppression pulse for fat imaging. The acquisition parameters were the following: TR=700 ms, TE=13 ms, field of view=4cm×4cm, acquisition matrix=128 pixels×128 pixels, slice thickness=2mm, and 2-signal averages. Only sections including the peritoneal cavity were included in the analysis. Visible fat in each image was scored as visceral or subcutaneous based on body location. The ratio of visceral fat to subcutaneous fat was calculated per section allowing calculation of the total mean ratio for a whole mouse.
2.5 Histology
Histology was carried out by the Dartmouth Pathology Shared Resource. Liver samples taken at sacrifice were fixed in 10% neutral-buffered formalin. The tissue was processed, paraffin-embedded, and sectioned at a thickness of 5μm onto glass slides. Tissue was stained using Masson’s Trichrome. Each liver had four sections stained and examined. Each section was taken at least 30μm apart and representative sections chosen. The sectioned tissue was examined at 100× magnification using an Olympus BX51 microscope (Waltham, MA). Images were generated using identical settings with a QImaging Micro Publisher 5.0 RTV camera (Surrey, British Columbia, Canada). Pathological assessment was done with the assistance of James Gorham, M.D., Ph.D., and Arief Suriawata, M.D., of the Geisel Medical School at Dartmouth.
2.6 Microarrays
Total RNA was purified from liver of mice on the 40-wk diet regimen. The liver was sliced into small pieces and homogenized in TRIzol Reagent (Invitrogen Corp., Carlsbad, CA). RNA purity, quantity, and quality were determined using a NanoDrop ND-1000 spectrophotometer (Thermo Scientific, Waltham, MA) and an Agilent 2100 Bioanalyzer (Agilent Technologies, Santa Clara, CA). The mRNA gene expression microarray experiments were carried out by the Dartmouth Genomics & Molecular Biology Shared Resource using the MouseRef-8 v2.0 Expression BeadChip array (Illumina, San Diego, CA), with approximately 25,600 annotated RefSeq transcripts covering 19,100 unique mouse genes. Four biological replicates (mice) per experimental condition at the conclusion of a diet regimen were included in the microarray studies. Approximately 0.5mg of total RNA was labeled for each bead array. The bead arrays were scanned with an Illumina 500GX scanner and processed with Illumina BeadScan software.
2.7 Quantitative polymerase chain reaction
Total RNA from gonadal adipose tissue of mice on a 5-wk diet regimen was isolated as described for the microarrays. Quantitative Polymerase Chain Reaction (qPCR) analysis was carried out using primers purchased from ThermoFisher Scientific, Inc. (Waltham, MA) and designed for mouse Ahr (Mm00478932_m1), Cyp1b1 (Mm00487229_m1), and reference Gapdh mRNA (Mm99999915_g1). Approximately 5μg of total RNA served as template for the cDNA synthesis. The cDNA was synthesized using TaqMan® assay kits with the Superscript III First-Strand Synthesis System (ThermoFisher Scientific, Inc.). The qPCR reactions were performed using the Fast Advanced Master Mix (ThermoFisher Scientific, Inc.) on a BioRad CFX96 System using version 3.1 software (BioRad, Hercules, CA) set at 40 cycles. Assays to determine levels of DNA contamination were carried out by omitting reverse transcriptase and mRNA template from the reactions. The average CT values were determined by carrying out QPCR measurements from four biological replicates for each gene in each experimental condition. Differential gene expression ratios were calculated based on the CT values of the Gapdh reference RNA for a final ΔCT average value.
2.8 Statistical analyses
Microarray analysis was carried out by the Dartmouth Bioinformatics Shared Resource. Quantile normalization [29] without background correction was carried out to preprocess the image files generated by the Illumina software. Analyses were performed using BRB-Array Tools Version 4.2.1 [30]. Genes that were differentially expressed among classes were identified using a random-variance t-test. Statistical p-values were calculated using paired Student’s t-test, and differentially expressed genes were considered statistically significant at p ≤ 0.05. Statistical significance of body mass differences was calculated using two-sided paired Student’s t-test and equal and unequal variance analysis. Any data and materials not in the public domain that were generated from these reported studies will be made available upon request.
3. Results
3.1 The AHR antagonist NF prevents obesity in adult female as well as male mice
We had shown that NF is an effective preventive to Western diet-based obesity in B6 males [7]. We wanted to investigate whether NF also worked as an obesity preventative in female mice and whether differential AHR ligand-binding affinity affected the efficiency of AHR-based obesity prevention. Dose-response experiments showed that the most effective NF dose was ~90mg/kg/day, in which NF was 2% of food mass [7]. Hence, for these studies, B6 and B6.D2 female and male mice were fed control or Western diet with and without 2% NF for 26 wks. Sample sizes of 15–21 mice per experimental group were used, which exceeded the minimum of 14 mice derived from a power analysis calculation. NF prevented obesity in both female and male mice fed Western diet in both strains in that they gained significantly less body mass to those mice fed Western diet (p-value ≤0.01–0.001) (Fig. 2A–E, Table 2). Note that the data for the B6 male mice were presented previously in a different form [7], and are presented here as a basis for comparison to the other experimental groups. The differences in body mass gain among the experimental groups were not due to differences in food consumption in that there were no significant differences in consumed kcal for a given sex on a given diet with and without NF (Fig. 2F). These data suggest that the AHR plays a major role in the metabolism giving rise to obesity in both male and female mice, and show that the inhibition of AHR signaling prevents obesity in both female and male mice.
Fig. 2.
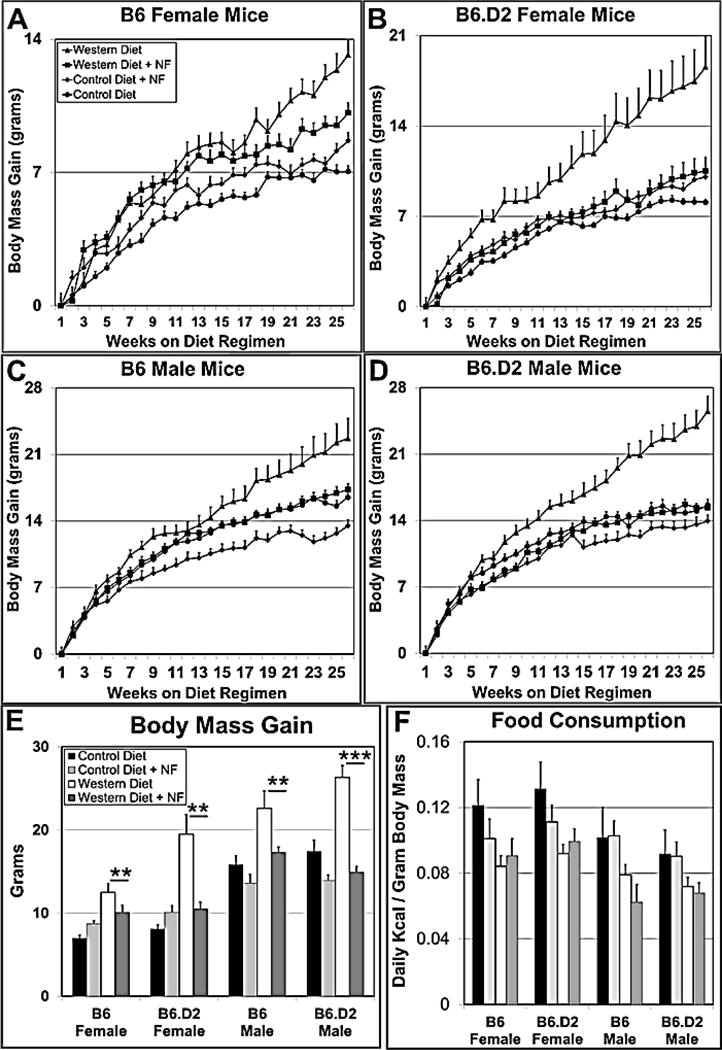
The AHR antagonist NF (~90 mg/kg mouse mass/day) reduces Western diet-based body mass gain in female (A,B) and male (C,D) B6 (A,C) and B6.D2 (B,D) mice. Each experimental group (n≥15) was fed control, control+NF, Western, or Western+NF diet ad libitum for 26 wks beginning at weaning. Plots for total body mass gain at termination of the 26-wk diet regimen for each experimental group (E) and mean kcal consumption per gram body mass (F). Food energy consumption was determined over a 10–14-day period beginning at week 15 during the 26-wk diet regimen. p-values: *, ≤0.05; **, ≤0.01; ***, ≤0.001. NF, α-naphthoflavone. Error bars represent standard error of the means (SEM).
Table 2.
Mean Body Mass Gain (grams) Per Week
| Week | Control Diet | Control Diet + α-Naphthoflavone | Western Diet | Western Diet + α-Naphthoflavone | ||||||||||||
|---|---|---|---|---|---|---|---|---|---|---|---|---|---|---|---|---|
|
| ||||||||||||||||
| B6 Female |
B6.D2 Female |
B6 Male |
B6.D2 Male |
B6 Female |
B6.D2 Female |
B6 Male |
B6.D2 Male |
B6 Female |
B6.D2 Female |
B6 Male |
B6.D2 Male |
B6 Female |
B6.D2 Female |
B6 Male |
B6.D2 Male |
|
| 1 | 0.00 | 0.00 | 0.00 | 0.00 | 0.00 | 0.00 | 0.00 | 0.00 | 0.00 | 0.00 | 0.00 | 0.00 | 0.00 | 0.00 | 0.00 | 0.00 |
| 2 | 0.55 | 0.78 | 1.95 | 1.94 | 1.47 | 1.90 | 2.25 | 2.67 | 0.44 | 2.12 | 2.94 | 2.74 | 0.27 | 0.19 | 1.93 | 2.40 |
| 3 | 1.05 | 1.61 | 3.86 | 5.24 | 2.00 | 2.30 | 4.25 | 4.53 | 1.28 | 3.47 | 4.19 | 4.79 | 2.93 | 2.19 | 4.07 | 4.25 |
| 4 | 1.55 | 2.09 | 5.64 | 6.24 | 2.73 | 3.10 | 5.19 | 5.67 | 2.94 | 4.53 | 6.63 | 6.58 | 3.33 | 2.75 | 5.60 | 5.40 |
| 5 | 2.00 | 2.61 | 6.59 | 8.06 | 2.73 | 3.95 | 5.56 | 6.20 | 3.22 | 5.53 | 7.88 | 8.00 | 3.60 | 3.63 | 6.93 | 6.75 |
| 6 | 2.77 | 3.48 | 7.55 | 8.47 | 3.13 | 4.35 | 6.75 | 7.13 | 4.50 | 6.76 | 8.63 | 9.84 | 4.60 | 4.06 | 7.80 | 6.90 |
| 7 | 3.18 | 3.52 | 8.27 | 9.24 | 4.00 | 4.80 | 7.63 | 7.73 | 5.39 | 6.76 | 10.44 | 10.11 | 5.60 | 4.25 | 8.53 | 7.80 |
| 8 | 3.41 | 3.96 | 9.36 | 9.94 | 4.60 | 5.35 | 7.94 | 8.27 | 5.33 | 8.18 | 11.25 | 11.74 | 6.07 | 4.94 | 9.67 | 8.70 |
| 9 | 4.27 | 4.57 | 9.95 | 10.47 | 5.40 | 5.20 | 8.50 | 8.93 | 5.79 | 8.18 | 12.38 | 12.74 | 6.33 | 5.63 | 10.20 | 8.95 |
| 10 | 4.64 | 4.96 | 10.82 | 11.29 | 5.27 | 6.15 | 8.94 | 9.53 | 6.44 | 8.24 | 12.69 | 13.42 | 6.53 | 5.69 | 11.07 | 10.65 |
| 11 | 4.59 | 5.65 | 11.73 | 11.65 | 6.07 | 6.75 | 9.38 | 10.00 | 7.17 | 8.59 | 12.75 | 14.26 | 6.53 | 6.25 | 11.73 | 10.75 |
| 12 | 5.18 | 6.04 | 11.86 | 12.59 | 6.33 | 6.85 | 10.00 | 11.27 | 8.00 | 9.65 | 13.00 | 15.47 | 7.20 | 6.94 | 12.67 | 11.40 |
| 13 | 5.36 | 6.57 | 12.18 | 12.71 | 5.80 | 7.05 | 10.13 | 11.40 | 8.33 | 9.88 | 13.56 | 15.79 | 7.87 | 6.56 | 12.73 | 12.05 |
| 14 | 5.27 | 6.52 | 12.77 | 13.18 | 6.33 | 6.85 | 10.56 | 12.47 | 8.50 | 10.88 | 14.38 | 16.11 | 7.60 | 7.13 | 12.93 | 12.95 |
| 15 | 5.59 | 6.22 | 13.59 | 13.88 | 6.40 | 6.95 | 10.94 | 11.20 | 8.61 | 11.82 | 15.56 | 16.79 | 7.93 | 7.31 | 13.47 | 12.90 |
| 16 | 5.77 | 6.30 | 13.64 | 13.65 | 6.87 | 7.25 | 11.13 | 11.60 | 8.06 | 11.88 | 16.06 | 17.45 | 7.60 | 7.75 | 13.87 | 13.70 |
| 17 | 5.68 | 7.00 | 13.95 | 14.41 | 6.87 | 7.35 | 11.19 | 11.87 | 8.56 | 12.88 | 16.31 | 18.21 | 7.87 | 8.13 | 13.87 | 13.55 |
| 18 | 5.82 | 6.87 | 14.55 | 14.41 | 7.40 | 7.50 | 12.19 | 12.00 | 9.78 | 14.35 | 18.25 | 19.56 | 7.93 | 8.94 | 14.67 | 13.80 |
| 19 | 6.77 | 6.83 | 14.73 | 13.41 | 7.47 | 8.20 | 12.00 | 12.47 | 9.17 | 14.06 | 18.38 | 20.84 | 8.40 | 8.25 | 14.60 | 14.40 |
| 20 | 6.73 | 7.35 | 15.18 | 14.47 | 7.33 | 8.55 | 12.81 | 12.33 | 10.06 | 14.82 | 18.88 | 20.89 | 8.47 | 7.88 | 15.20 | 14.45 |
| 21 | 6.73 | 7.83 | 15.27 | 15.24 | 6.93 | 8.75 | 12.94 | 13.20 | 10.78 | 16.18 | 19.31 | 22.05 | 8.20 | 9.00 | 15.33 | 14.75 |
| 22 | 6.86 | 8.17 | 15.68 | 15.53 | 7.40 | 9.25 | 12.50 | 13.33 | 11.22 | 16.12 | 20.00 | 22.63 | 9.27 | 9.38 | 16.07 | 14.85 |
| 23 | 6.59 | 8.26 | 16.45 | 14.82 | 7.67 | 9.30 | 11.81 | 13.20 | 11.06 | 16.71 | 20.94 | 22.58 | 9.07 | 9.88 | 16.33 | 15.10 |
| 24 | 7.18 | 8.13 | 15.91 | 14.82 | 7.47 | 9.10 | 12.19 | 13.27 | 12.00 | 17.06 | 21.25 | 23.58 | 9.47 | 10.06 | 16.60 | 15.70 |
| 25 | 7.05 | 8.13 | 15.59 | 15.00 | 8.13 | 9.85 | 12.69 | 13.60 | 12.53 | 17.47 | 22.25 | 23.95 | 9.47 | 10.38 | 17.33 | 15.35 |
| 26 | 7.05 | 8.09 | 16.50 | 15.65 | 8.67 | 10.05 | 13.50 | 13.93 | 13.17 | 18.59 | 22.69 | 25.53 | 10.13 | 10.50 | 17.30 | 15.35 |
|
| ||||||||||||||||
| Percentage body mass to matched mice on Control Diet at Week 26: |
na |
na |
na |
na |
123% |
124% |
82% |
89% |
187% |
230% |
138% |
163% |
144% |
130% |
105% |
98% |
| p-value: | 3.90E-03 | 1.65E-02 | 8.63E-03 | 4.97E-03 | 1.54E-07 | 1.64E-04 | 4.23E-03 | 4.77E-06 | 5.22E-05 | 7.37E-03 | ns | ns | ||||
|
| ||||||||||||||||
| Percentage body mass to matched mice on Western Diet at Week 26: |
54% |
44% |
73% |
61% |
66% |
54% |
59% |
55% |
na |
na |
na |
na |
77% |
56% |
76% |
60% |
| p-value : | 1.5E-07 | 1.64E-04 | 4.23E-03 | 4.77E-06 | nd | nd | nd | nd | 3.83E-04 | 4.26E-03 | 3.54E-03 | 7.81E-07 | ||||
na = not applicable
nd = not done
3.2 Female and B6.D2 mice become relatively more obese on Western diet
Although mice of both Ahr genotypes and sexes became significantly heavier on Western diet to those on control diet, and their body mass significantly reduced to near control levels when treated with NF, there were genotype- and sex-based differences. Female mice became relatively heavier than male mice on Western diet relative to the mice on control diet, i.e., 187% and 230% for female mice to 138% and 163% for male mice (Table 2). We reported in our earlier study [6] that B6 male mice on a Western diet with low cholesterol content had significantly greater body mass and were more than 16% heavier than their B6.D2 counterparts at the conclusion of a 28-wk diet regimen. In contrast, the Western diet with 2% cholesterol used here caused B6.D2 mice of both sexes to become relatively heavier than their B6 counterparts, i.e., 230% and 163% to 187% to 138% for females and males, respectively (Table 2). Thus, female mice and B6.D2 mice became proportionately heavier on Western diet with high cholesterol content than did the corresponding male and B6 mice.
3.3 Projected asymptote body mass
A time course-independent weight metric was applied to project asymptote differential body mass gain (Fig. 3A–D) and final total body mass (Fig. 3E–H) over a 52-wk time period [28]. The asymptote-based results were in close agreement with the analysis based on the 26-wk end point data shown in Fig. 2A–D and Table 2, in that B6.D2 female mice (236%) were proportionately heavier on Western diet relative to mice on control diet than were the male mice (151% and 160% for B6 and B6.D2, respectively) (Table 3). An exception was that B6 female mice on Western diet relative to mice on control diet showed the least relative body mass increase (136%), whereas, in the 26-wk study, B6 female mice had a relative body mass gain greater than did the male mice of both strains (Table 2).
Fig. 3.
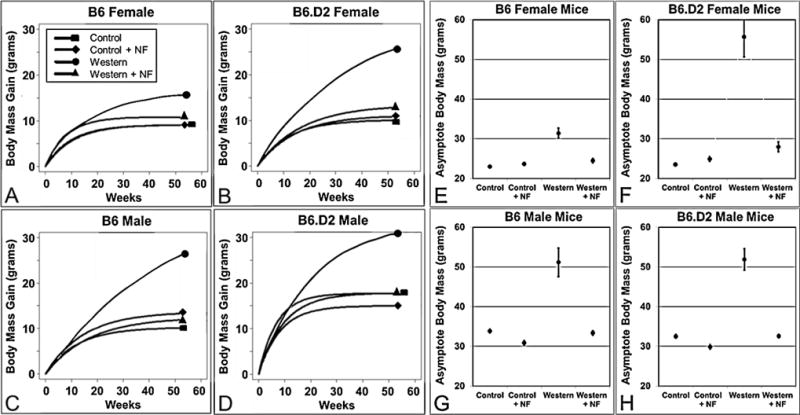
Long-term projected asymptotic body mass gains (A–D) and total final body mass (E–H) show that the AHR antagonist NF (~90 mg/kg/day) significantly reduced Western diet-based body mass gain in female and male B6 and B6.D2 mice over a longer time course. Each experimental group (n≥15) was fed control, control+NF, Western, or Western+NF diet ad libitum for 26 wks beginning at weaning. NF, α-naphthoflavone. Error bars represent SEM.
Table 3.
A Comparison of Projected Asymptote Body Masses of at Week 52 of B6 vs. B6.D2 Female and Male Mice
| Diet | Females
|
|||||||
|---|---|---|---|---|---|---|---|---|
| B6 | B6.D2 | |||||||
|
| ||||||||
| Control | Control + NF | Western | Western + NF | Control | Control + NF | Western | Western + NF | |
| Mean Body Mass (g) ± SEM | 23.04 ± 0.35 | 23.68 ± 0.38 | 31.43 ± 1.23 | 24.50 ± 0.53 | 23.56 ± 0.38 | 24.95 ± 0.60 | 55.71 ± 5.04 | 28.00 ± 1.24 |
| % of Control | NA | 103 | 136 | 106 | – | 106 | 236 | 119 |
| B6 - B6.D2 Difference | – | _ | −0.52 | −1.27 | −24.28 | −3.50 | ||
| p-value | – | – | – | – | 0.318 | 0.075 | 0.000 | 0.010 |
|
| ||||||||
| Males | ||||||||
|
| ||||||||
| Mean Body Mass (g) ± SEM | 33.84 ± 0.45 | 30.88 ± 0.58 | 51.17 ± 3.58 | 33.38 ± 0.57 | 32.51 ± 0.49 | 29.86 ± 0.60 | 51.90 ± 2.68 | 32.56 ± 0.44 |
| % of Control | NA | 91 | 151 | 99 | NA | 92 | 160 | 100 |
| B6 - B6.D2 Difference | – | – | – | – | 1.33 | 1.01 | −0.73 | 0.82 |
| p-value | – | – | – | – | 0.045 | 0.225 | 0.871 | 0.253 |
NF = α-naphthoflavone
SEM = Standard Error of the Means
3.4 Male and B6.D2 mice are more responsive to NF
The addition of NF to Western diet caused a highly significant decrease in body mass gain for all the mouse groups (Fig. 2E, Table 2). The body mass of males on Western+NF approached control levels, (105% and 98% for B6 and B6.D2, respectively), and while NF also caused a significant drop in body mass in B6 and B6.D2 females (77% and 56%, respectively), female mice in the Western+NF group remained significantly heavier than mice on control diet (144% and 130% for B6 and B6.D2 mice, respectively). The addition of NF to control diet caused males of both Ahr genotypes to be smaller than males on control diet alone (82% and 89% for B6 and B6.D2, respectively), whereas female mice became significantly heavier than the control groups (123% and 124% for B6 and B6.D2, respectively).
In regard to NF and Ahr genotype, female B6.D2 mice appeared to be more responsive to NF than female B6 mice (reduced from 230% to 130% for B6.D2 mice and 187% to 144% for B6 mice) (Table 2). Although not as dramatic, male B6.D2 mice were more responsive to NF than were B6 mice (reduced from 163% to 98% for B6.D2 mice and 138% to 105% for B6 mice). To summarize, for the mice fed Western diet, male mice were more responsive to NF than female mice, and the B6.D2 mouse strain more so than the B6 strain.
3.5 Asymptote response to NF
The above mouse studies were highly consistent with the long-term asymptote analysis (Fig. 3 and Table 3), in which the major finding was that NF in Western diet proved effective in maintaining body mass at near control levels over a longer time period for all mouse groups. Again, male mice appeared more responsive to NF (Table 3), in that body masses were 99% (B6) and 100% (B6.D2) to that of mice on control diet. In contrast, female mice remained relatively heavier at 106% and 119% for B6 and B6.D2, respectively. Also consistent were the results showing that B6.D2 mice of both sexes were more responsive to NF than were the corresponding B6 mice.
3.6 Differential body fat distribution
We asked whether the reduced body mass of mice on Western+NF to those fed Western diet alone was from a decreased accumulation of body fat or rather from an overall proportionate decrease in body size. The ratio of a gonadal fat pad mass to total body mass correlates highly to the ratio of total body fat mass to total body mass [31]. The inferred total fat mass to body mass ratio for mice on Western diet to those on Western+NF diet was significantly different for mice in all the experimental groups except for the B6 male mice (Fig. 4A). Surprisingly, female mice, especially B6 females, which were less responsive to NF than were the B6 males, had the greatest reduction in fat mass to body mass ratio, suggesting that NF affected the body mass of females in body compartments other than adipose tissue.
Fig. 4.
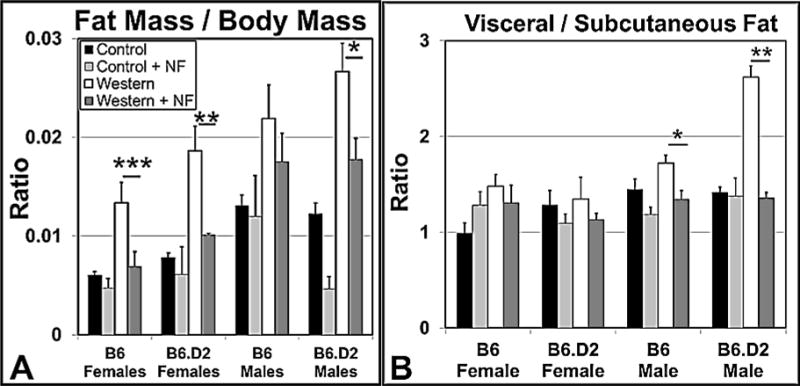
Administration of NF in the diet (~90 mg/kg/day) reduces adiposity and differentially redistributes body fat in female and male B6 and B6.D2 mice. (A) Gonadal fat pad mass to total body mass ratio (n≥15). (B) Plot of the ratio of visceral fat to subcutaneous fat using ImageJ processing software to analyze binary images of converted magnetic resonance images. Fat composition was determined by quantifying pixel density of total fat, subcutaneous fat, and visceral fat. Each experimental group was fed control, control+NF, Western, or Western+NF diet ad libitum for 26 wks beginning at weaning. (n=4). p-values: *, ≤0.05; **, ≤0.01; ***, ≤0.001. NF, α-naphthoflavone. Error bars represent SEM.
We next investigated whether the relative reduction in body fat from NF treatment was associated with a change in body fat deposition. Increased abdominal or visceral fat is associated with a higher risk of metabolic syndrome [32], heart disease, diabetes, and many other diseases [33]. Visceral and subcutaneous fat compartment volumes were determined using MRI of ~20 whole body cross-sections through the thoracic and abdominal regions (Fig. 4B). The imaging revealed that NF in Western diet caused a statistically significant change in the ratio of fat deposition in the visceral to subcutaneous depots only in male mice, with an especially large impact on B6.D2 mice. Thus, female mice on Western+NF compared to male mice lose relatively less body mass but lose relatively more fat mass, of which, the loss is relatively the same from the subcutaneous and visceral fat compartments. The results suggest that females on Western+NF are relatively leaner than their male counterparts.
3.7 AHR antagonism by NF reduces liver steatosis but increases liver size
Liver steatosis and dysfunction are strongly associated with obesity [34, 35]. We had observed in B6 male mice treated with the AHR antagonists NF and CH-223191 a significant reduction in liver steatosis [7]. We asked whether AHR inhibition with NF also alleviated hepatic steatosis in female and B6.D2 mice. Liver sections from each experimental group were stained with Masson’s trichrome (Fig. 5). Mice of both sexes and genotypes in the control and control+NF groups, as expected, showed few, if any, fat vesicles, while mice fed Western diet showed obvious fat accumulation, with B6 male mice showing the greatest degree of fat accumulation (Fig. 5K) and B6.D2 female mice the least (Fig. 5G). The mice fed Western+NF diet showed little indication of fat-storing vesicles, which was consistent with our earlier report that AHR inhibition is an effective means to reduce fat accumulation in the liver [7].
Fig. 5.
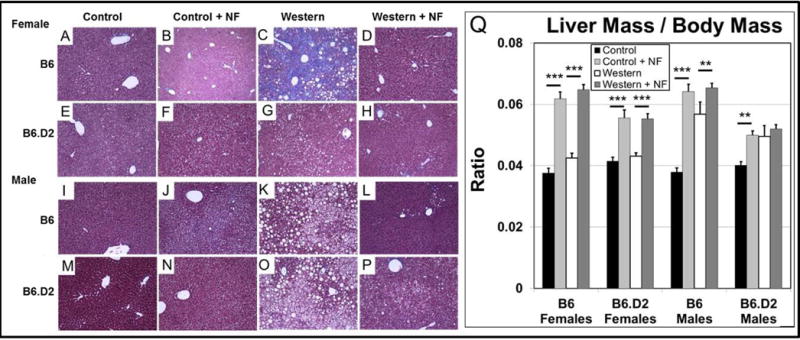
The inclusion of NF (~90 mg/kg/day) ameliorates Western diet-based liver steatosis but increases liver size in female and male B6 and B6.D2 mice. Representative sections stained with Masson’s trichrome from livers of mice fed control, control+NF, Western, or Western+NF diet ad libitum for 26 wks beginning at weaning for B6 female (A–D), B6.D2 female (E–H), B6 male (I–L), and B6.D2 male (M–P) mice. (Q) A plot of liver mass to body mass ratio (n≤15/experimental group). p-values: ** ≤0.01; ***, ≤0.001. NF, α-naphthoflavone. Error bars represent SEM.
In addition to a drop in hepatic fat levels, we observed hepatomegaly in all experimental groups on control+NF and Western+NF (Fig. 5Q), suggesting that NF causes liver enlargement independent of diet. The NF-dependent hepatomegaly was especially evident in the female mouse groups treated with NF, because in contrast to male mice, female mice did not exhibit an enlarged liver from Western diet alone. Thus, NF reduces fat accumulation and causes diet-independent enlargement of the liver for mice of both sexes and Ahr genotypes. However, sex differences were observed in that female mice showed little liver enlargement from Western diet while male mice showed significant enlargement and B6.D2 mice displayed significantly less NF-dependent hepatomegaly than did B6 mice.
3.8 Candidate AHR-regulated obesity genes
Studies have shown that adipose tissue from B6 male and female mice on high-fat diet express differential mRNA profiles, especially for genes related to inflammation [36]. Another microarray study using wild type versus Cyp1b1−/− B6 female and male mice fed control and high-fat diets revealed numerous sexual differences in liver gene expression [25]. Thus, given that (i) these same Cyp1b1−/− male and female mice fed a high-fat diet were resistant to obesity [25, 26], (ii) the Cyp1b1 gene is a canonical marker for AHR transcriptional activity [37, 38], and (iii) Western diet caused an increase in Cyp1b1 mRNA expression levels in the liver of B6 and B6.D2 male mice [6], we chose to measure the relative levels of Cyp1b1 mRNA from visceral adipose tissue and liver of B6 male mice fed control and Western diets with and without AHR inhibitors. The qPCR results from adipose tissue (Fig. 6A) and microarray results from liver (Fig. 6B) showed that Western diet caused an increase in Cyp1b1 mRNA levels, and in turn, that Western diet containing NF or CH-223191 caused a reduction of Cyp1b1 mRNA to approach control levels. Furthermore, mRNA expression levels in liver of other AHR-regulated genes involved in obesity were decreased by AHR inhibition, including the Foxo1 [39], Scd1 [40–42], and Spp1 [43] genes. The results are consistent with a hypothesis that the AHR antagonists work by inhibiting the transcriptional activity of the AHR to reduce the expression of genes required for obesity, e.g., Cyp1b1.
Fig. 6.
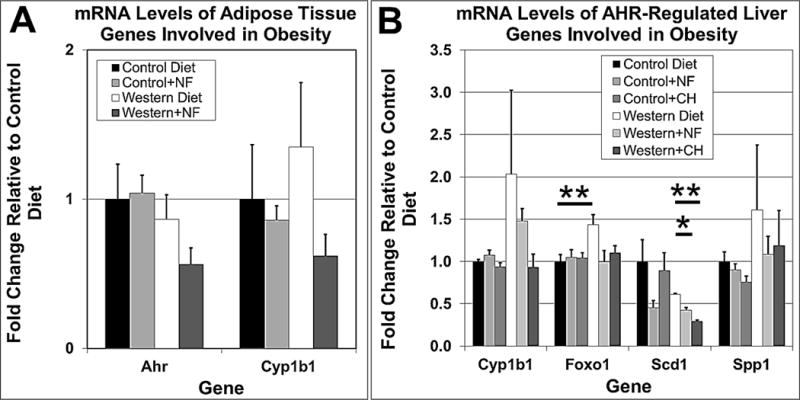
AHR antagonists NF (~90 mg/kg/day) and CH-223191 (~10 mg/kg/day) cause reduced mRNA levels for key AHR-regulated genes involved in metabolism. Total RNA from gonadal adipose tissue was used for qPCR analysis (A) and from liver for microarray studies (B). Fold change for the qPCR studies is relative to Gapdh mRNA levels. The RNA for the qPCR and microarray studies was isolated from four B6 male mice of each experimental group in the 40-wk diet regimen (A) and 5-wk diet regimen (B). ** ≤0.01; ***, ≤0.001. NF, α-naphthoflavone; CH, CH-223191. Error bars represent SEM.
4. Discussion
Our results suggest that Western diet-induced obesity is an active process that requires a Western diet-derived, ligand-activated AHR. When AHR signaling is brought to basal levels by an antagonist or is dormant due to an absence of diet-derived agonists, such as the control diet used here, then obesity is averted. However, sex- and Ahr genotype-based differences in response to Western diet and AHR antagonism were observed, and it was the intent of this study to characterize some of those differences.
4.1 Asymptote analyses
We used two approaches to analyze body mass data, which allowed a means to cross-check both data sets. The first approach is conventionally used in most obesity studies and utilizes the last time point in the experimental data set, which in the results presented here, was at the terminal 26-wk time point in the diet regimen. We obtained statistical significance where expected, e.g., in comparing body mass gain among the control, Western, and Western+NF diet groups. However, if the study had been concluded at the 16-wk time point, for instance, statistical significance of p-value ≤0.05 would not have been attained for some of the comparisons. Thus, the conventional time course/end point means of analysis is time dependent and statistical significance may or may not be reached depending on when the time course is concluded. The mixed model-based asymptote method, on the other hand, is time independent and less reliant on the need for an extended time course [28]. To use the above example, if the current diet study had been terminated at 16 wks, the asymptote approach would have produced similar results to that obtained with the 26-wk time course. Thus, the asymptote projection method can save time and funds as well as provide a cross-check method to validate results. However, it must be kept in mind that a sufficient time course is required to provide a basis for calculating a valid projection, which for the data presented here would have required at the least an 8-wk diet regimen.
4.2 Sex differences
Our finding that female mice on Western diet generally become more obese than male mice is contrary to the conclusions of similar studies, [e.g., 36]. Our conclusion was derived by comparing the relative increase of body mass of mice on Western diet to mice of like sex on control diet rather than a direct comparison of male to female body masses. A conventional direct comparison of males to females on Western diet showed that males indeed did gain more body mass than did the females, e.g., B6.D2 females gained 17.47 g whereas B6.D2 males gained 23.95 g. However, relative to the corresponding cohort on control diet, the same B6.D2 females had an increased body mass of 230%, whereas the same B6.D2 males had an increased body mass of 163%. Thus, inclusion of the body mass gain from control diet allows a relative measure of body mass, which we found more informative than absolute measures.
As to the remaining differences we observed between males and females, i.e., response to NF and the lesser degree of liver steatosis and hepatomegaly for females to that of males, we can only speculate. We know that key metabolic genes directly or indirectly related to the AHR are affected by Western diet and/or NF, and any differences may be due to the inherent sexual dimorphisms that exist in gene expression and metabolism [44]. A limitation of the study reported here was the lack of mRNA expression data from female mice, which we intend to rectify in future studies. Nevertheless, the sex differences reported here are a manifestation of the distinct genetic, epigenetic, and cytoplasmic mechanisms in place in males vs. females and are worthy of further study.
4.3 Ahr genotype and diet
In our previous work comparing male B6 and B6.D2 mice on Western diet [6], we found that by week 17 of a 28-wk diet regimen, B6 mice were significantly heavier than were B6.D2 mice. Different outcomes in AHR-dependent obesity is a reasonable prediction based on the differences in AHR ligand-binding affinities and activities [16, 45]. However, the present study revealed no significant differences between B6 and B6.D2 male mice on Western diet. The Western diet in the original study [6] was similar in composition except that no supplementary cholesterol was added (0.02% cholesterol by mass) as opposed to the Western diet in this study. The Western diet used in this report, to better reflect the human Western diet, included cholesterol at 2% by mass. Thus, there are at least three possible explanations for the different outcomes. First, the AHR represses the gene expression of key cholesterol synthesizing genes, including Hmgcr and Lss, in a DNA-binding independent manner such that the higher affinity AHRb isoform is significantly more repressive than the lower affinity AHRd isoform [46]. Thus, it is conceivable that the reduced level of cholesterol synthesis in B6 mice to that of B6.D2 mice, in which both are on a diet of high cholesterol, could cause a reversal in obesity outcomes. Second, in a related way, what may seem to be minor differences in diet content can nonetheless have a large and opposite impact on AHR signaling, similar to that observed by some AHR-activating toxicants. For example, TCDD has a greater toxicological impact on B6 mice to that of B6.D2 mice [47]; however, in contrast, benzo[a]pyrene has a greater toxicological impact on B6.D2 mice than on B6 mice [48]. A third possible reason may be due to factors associated with differences in mouse husbandry. In the previous work [6], the mice were ordered directly from Jackson Laboratory and placed immediately in the study, whereas, the mice for the work described here were produced in house from breeding pairs. It is well documented that the microbiota can differ substantially depending on origin of birth, rearing methods, and/or diet [49], and in turn, the different microbiota can differentially influence metabolism and obesity [50, 51].
4.4 AHR-CYP1B1-SCD1 axis
We examined by qPCR and microarrays the gene expression of several positively AHR-regulated genes known to play roles in obesity. We found that the outcome from the inhibition of AHR signaling by the antagonists NF and CH-223191 was consistent with the decrease of expression or loss of those same AHR-regulated genes. FOXO1 plays critical roles in the transcriptional regulation of genes involved in lipid metabolism, adipocyte differentiation, and gluconeogenesis [52], and the Foxo1 gene is regulated by the AHR [39]. SPP1 (osteopontin) is a sensitive marker for obesity in mice and humans [53–55]. Loss of the Spp1 gene causes obesity resistance in mice fed a high-fat diet [56] and is a gene regulated by the AHR [43]. The whole-body deletion of the canonical AHR-regulated Cyp1b1 gene prevents obesity in mice fed a high-fat diet [24, 25]. Mice deficient in the Scd1 gene, which encodes stearoyl-CoA desaturase 1, the rate-limiting enzyme that metabolizes saturated fatty acids to monounsaturated fatty acids, are resistant to diet-induced obesity, become more insulin sensitive, and show heightened energy expenditure from increased fatty acid β-oxidation in the liver [42, 57, 58]. A connection between the Cyp1b1 and Scd1 genes was established by studies showing the CYP1B1 substrate arachidonic acid reduced both Scd1 mRNA and SCD1 activity levels [59] and that SCD1 expression was nearly undetectable in Cyp1b1-null mice [60]. Our model goes further by connecting the AHR to the CYP1B1-SCD1 axis.
In conclusion, although there are sex- and Ahr allelic-dependent differences, we accept the hypothesis that inhibition of the AHR in mice prevents Western diet-induced obesity and adiposity and reduces liver steatosis to near control levels regardless of sex or Ahr genotype. In most of the comparisons, female mice to that of male mice had a greater fat mass to body mass ratio, were less responsive to NF, had less liver steatosis, and did not exhibit Western diet-induced hepatomegaly. Our results suggest the reduction of AHR signaling activity to near basal levels prevents obesity and demonstrates that the AHR may provide a convenient and efficacious target for the treatment of obesity and liver steatosis.
Acknowledgments
BJM, IYR, JSK-H and CRT conceived and designed the study. BJM, IYR, KVN, and BG performed the experiments and acquired the data. ED developed the statistical models, wrote the R script, and ran the computations. BJM, ED, CSR, IYR, JSK-H, KVN, BG, and CRT analyzed the data. BJM, IYR, JSK-H, ED, and CRT wrote and edited the manuscript. All authors read and approved the final manuscript. We thank the reviewers and editor for their thoughtful comments. We thank Rick Enelow, Carrie Freitag, Mark Israel, Richard Rothstein, and Yoli Sanchez for their suggestions and support. The authors acknowledge the following Shared Resources facilities: Genomics & Molecular Biology; Irradiation, Pre-clinical Imaging & Microscopy; Bioinformatics; and Pathology at the Norris Cotton Cancer Center at Dartmouth with NCI Cancer Center Support Grant 5P30CA023108-37. The 9.4 T small animal MRI scanner was purchased using the NIH grant 1S10RR025048-01. This work was supported by funding from NIH-NCRR award 5P20RR024475-02 and NIH-NIGMS award 8P20GM103534-02, NCCC Prouty Pilot Award, and Department of Medicine Career Development Award.
Abbreviations
- AHR
aryl hydrocarbon receptor
- ARNT
aryl hydrocarbon nuclear translocator
- B6
C57BL/6J mouse strain
- B6.D2
B6.D2N-Ahrd/J mouse strain
- CH
CH-223191
- DRE
dioxin response element
- NF
α-naphthoflavone
- MRI
magnetic resonance imaging
- SEM
standard error of the means
- TE
Echo Time
- TR
Repetition Time
Footnotes
Publisher's Disclaimer: This is a PDF file of an unedited manuscript that has been accepted for publication. As a service to our customers we are providing this early version of the manuscript. The manuscript will undergo copyediting, typesetting, and review of the resulting proof before it is published in its final citable form. Please note that during the production process errors may be discovered which could affect the content, and all legal disclaimers that apply to the journal pertain.
Competing interests
The authors declare no competing interests.
References
- 1.Ogden CL, Carroll MD, Kit BK, Flegal KM. PRevalence of childhood and adult obesity in the united states, 2011–2012. JAMA. 2014;311:806–14. doi: 10.1001/jama.2014.732. [DOI] [PMC free article] [PubMed] [Google Scholar]
- 2.Hong J, Stubbins R, Smith R, Harvey A, Nunez N. Differential susceptibility to obesity between male, female and ovariectomized female mice. Nutrition Journal. 2009;8:11. doi: 10.1186/1475-2891-8-11. [DOI] [PMC free article] [PubMed] [Google Scholar]
- 3.Murphy NF, MacIntyre K, Stewart S, Hart CL, Hole D, McMurray JJV. Long-term cardiovascular consequences of obesity: 20-year follow-up of more than 15000 middle-aged men and women (the Renfrew-Paisley study) European Heart Journal. 2006;27:96–106. doi: 10.1093/eurheartj/ehi506. [DOI] [PubMed] [Google Scholar]
- 4.McGill HC, Jr, McMahan CA, Malcom GT, Oalmann MC, Strong JP. Effects of serum lipoproteins and smoking on atherosclerosis in young men and women. The PDAY Research Group. Pathobiological Determinants of Atherosclerosis in Youth. Arteriosclerosis, thrombosis, and vascular biology. 1997;17:95–106. doi: 10.1161/01.atv.17.1.95. [DOI] [PubMed] [Google Scholar]
- 5.Yang X, Schadt EE, Wang S, Wang H, Arnold AP, Ingram-Drake L, et al. Tissue-specific expression and regulation of sexually dimorphic genes in mice. Genome Res. 2006;16:995–1004. doi: 10.1101/gr.5217506. [DOI] [PMC free article] [PubMed] [Google Scholar]
- 6.Kerley-Hamilton JS, Trask HW, Ridley CJ, Dufour E, Ringelberg CS, Nurinova N, et al. Obesity is mediated by differential aryl hydrocarbon receptor signaling in mice fed a Western diet. Environ Health Perspect. 2012;120:1252–9. doi: 10.1289/ehp.1205003. [DOI] [PMC free article] [PubMed] [Google Scholar]
- 7.Moyer BJ, Rojas IY, Kerley-Hamilton JS, Hazlett HF, Nemani KV, Trask HW, et al. Inhibition of the aryl hydrocarbon receptor prevents Western diet-induced obesity. Model for AHR activation by kynurenine via oxidized-LDL, TLR2/4, TGFbeta, and IDO1. Toxicol Appl Pharmacol. 2016;300:13–24. doi: 10.1016/j.taap.2016.03.011. [DOI] [PMC free article] [PubMed] [Google Scholar]
- 8.Xu CX, Wang C, Zhang ZM, Jaeger CD, Krager SL, Bottum KM, et al. Aryl hydrocarbon receptor deficiency protects mice from diet-induced adiposity and metabolic disorders through increased energy expenditure. Int J Obes. 2015;39:1300–9. doi: 10.1038/ijo.2015.63. [DOI] [PMC free article] [PubMed] [Google Scholar]
- 9.Hoffman EC, Reyes H, Chu FF, Sander F, Conley LH, Brooks BA, et al. Cloning of a factor required for activity of the Ah (dioxin) receptor. Science. 1991;252:954–8. doi: 10.1126/science.1852076. [DOI] [PubMed] [Google Scholar]
- 10.Carver LA, Bradfield CA. Ligand-dependent interaction of the aryl hydrocarbon receptor with a novel immunophilin homolog in vivo. J Biol Chem. 1997;272:11452–6. doi: 10.1074/jbc.272.17.11452. [DOI] [PubMed] [Google Scholar]
- 11.Ma Q, Whitlock JP., Jr A novel cytoplasmic protein that interacts with the Ah receptor, contains tetratricopeptide repeat motifs, and augments the transcriptional response to 2,3,7,8-tetrachlorodibenzo-p-dioxin. J Biol Chem. 1997;272:8878–84. [PubMed] [Google Scholar]
- 12.Nguyen PM, Wang D, Wang Y, Li Y, Uchizono JA, Chan WK. p23 co-chaperone protects the aryl hydrocarbon receptor from degradation in mouse and human cell lines. Biochemical pharmacology. 2012;84:838–50. doi: 10.1016/j.bcp.2012.06.018. [DOI] [PMC free article] [PubMed] [Google Scholar]
- 13.Sun YV, Boverhof DR, Burgoon LD, Fielden MR, Zacharewski TR. Comparative analysis of dioxin response elements in human, mouse and rat genomic sequences. Nucleic Acids Res. 2004;32:4512–23. doi: 10.1093/nar/gkh782. [DOI] [PMC free article] [PubMed] [Google Scholar]
- 14.Smith KJ, Murray IA, Tanos R, Tellew J, Boitano AE, Bisson WH, et al. Identification of a high-affinity ligand that exhibits complete aryl hydrocarbon receptor antagonism. The Journal of pharmacology and experimental therapeutics. 2011;338:318–27. doi: 10.1124/jpet.110.178392. [DOI] [PMC free article] [PubMed] [Google Scholar]
- 15.Hofstetter JR, Svihla-Jones DA, Mayeda AR. A QTL on mouse chromosome 12 for the genetic variance in free-running circadian period between inbred strains of mice. J Circadian Rhythms. 2007;5:7. doi: 10.1186/1740-3391-5-7. [DOI] [PMC free article] [PubMed] [Google Scholar]
- 16.Poland A, Palen D, Glover E. Analysis of the four alleles of the murine aryl hydrocarbon receptor. Molecular Pharmacology. 1994;46:915–21. [PubMed] [Google Scholar]
- 17.Moriguchi T, Motohashi H, Hosoya T, Nakajima O, Takahashi S, Ohsako S, et al. Distinct response to dioxin in an arylhydrocarbon receptor (AHR)-humanized mouse. Proc Natl Acad Sci U S A. 2003;100:5652–7. doi: 10.1073/pnas.1037886100. [DOI] [PMC free article] [PubMed] [Google Scholar]
- 18.Nguyen LP, Bradfield CA. The search for endogenous activators of the aryl hydrocarbon receptor. Chem Res Toxicol. 2008;21:102–16. doi: 10.1021/tx7001965. [DOI] [PMC free article] [PubMed] [Google Scholar]
- 19.Flaveny CA, Murray IA, Perdew GH. Differential gene regulation by the human and mouse aryl hydrocarbon receptor. Toxicol Sci. 2010;114:217–25. doi: 10.1093/toxsci/kfp308. [DOI] [PMC free article] [PubMed] [Google Scholar]
- 20.Flaveny CA, Murray IA, Chiaro CR, Perdew GH. Ligand selectivity and gene regulation by the human aryl hydrocarbon receptor in transgenic mice. Mol Pharmacol. 2009;75:1412–20. doi: 10.1124/mol.109.054825. [DOI] [PMC free article] [PubMed] [Google Scholar]
- 21.Kim SH, Henry EC, Kim DK, Kim YH, Shin KJ, Han MS, et al. Novel compound 2-methyl-2H-pyrazole-3-carboxylic acid (2-methyl-4-o-tolylazo-phenyl)-amide (CH-223191) prevents 2,3,7,8-TCDD-induced toxicity by antagonizing the aryl hydrocarbon receptor. Mol Pharmacol. 2006;69:1871–8. doi: 10.1124/mol.105.021832. [DOI] [PubMed] [Google Scholar]
- 22.Zhao B, DeGroot DE, Hayashi A, He G, Denison MS. CH223191 Is a Ligand-Selective Antagonist of the Ah (Dioxin) Receptor. Toxicological Sciences. 2010;117:393–403. doi: 10.1093/toxsci/kfq217. [DOI] [PMC free article] [PubMed] [Google Scholar]
- 23.Jaeger C, Xu C, Sun M, Krager S, Tischkau SA. Aryl hydrocarbon receptor-deficient mice are protected from high fat diet-induced changes in metabolic rhythms. Chronobiology International. 2017;34:318–36. doi: 10.1080/07420528.2016.1256298. [DOI] [PMC free article] [PubMed] [Google Scholar]
- 24.Bushkofsky JR, Maguire M, Larsen MC, Fong YH, Jefcoate CR. Cyp1b1 affects external control of mouse hepatocytes, fatty acid homeostasis and signaling involving HNF4alpha and PPARalpha. Arch Biochem Biophys. 2016;597:30–47. doi: 10.1016/j.abb.2016.03.030. [DOI] [PMC free article] [PubMed] [Google Scholar]
- 25.Larsen MC, Bushkofsky JR, Gorman T, Adhami V, Mukhtar H, Wang S, et al. Cytochrome P450 1B1: An unexpected modulator of liver fatty acid homeostasis. Arch Biochem Biophys. 2015;571:21–39. doi: 10.1016/j.abb.2015.02.010. [DOI] [PMC free article] [PubMed] [Google Scholar]
- 26.Liu X, Huang T, Li L, Tang Y, Tian Y, Wang S, et al. CYP1B1 deficiency ameliorates obesity and glucose intolerance induced by high fat diet in adult C57BL/6J mice. American Journal of Translational Research. 2015;7:761–71. [PMC free article] [PubMed] [Google Scholar]
- 27.Snedecor GW, Cochran WG. Statistical Methods. 7th. Ames, IA: Iowa State University Press; 1980. [Google Scholar]
- 28.Demidenko E. Mixed Models: Theory and Applications with R. New York: Wiley; 2013. [Google Scholar]
- 29.Smyth GK, Speed T. Normalization of cDNA microarray data. Methods. 2003;31:265–73. doi: 10.1016/s1046-2023(03)00155-5. [DOI] [PubMed] [Google Scholar]
- 30.Wright GW, Simon RM. A random variance model for detection of differential gene expression in small microarray experiments. Bioinformatics. 2003;19:2448–55. doi: 10.1093/bioinformatics/btg345. [DOI] [PubMed] [Google Scholar]
- 31.Rogers P, Webb GP. Estimation of body fat in normal and obese mice. Br J Nutr. 1980;43:83–6. doi: 10.1079/bjn19800066. [DOI] [PubMed] [Google Scholar]
- 32.Despres J-P, Lemieux I. Abdominal obesity and metabolic syndrome. Nature. 2006;444:881–7. doi: 10.1038/nature05488. [DOI] [PubMed] [Google Scholar]
- 33.Cameron AJ, Dunstan DW, Owen N, Zimmet PZ, Barr EL, Tonkin AM, et al. Health and mortality consequences of abdominal obesity: evidence from the AusDiab study. Med J Aust. 2009;191:202–8. doi: 10.5694/j.1326-5377.2009.tb02753.x. [DOI] [PubMed] [Google Scholar]
- 34.Chien KL, Hsu HC, Chao CL, Lee BC, Chen MF, Lee YT. Interaction of obesity, metabolic syndrome and Framingham risk on steatohepatitis among healthy Taiwanese: population-based nested case-control study. Cardiovasc Diabetol. 2006;5:12. doi: 10.1186/1475-2840-5-12. [DOI] [PMC free article] [PubMed] [Google Scholar]
- 35.Reddy JK, Rao MS. Lipid metabolism and liver inflammation. II. Fatty liver disease and fatty acid oxidation. Am J Physiol Gastrointest Liver Physiol. 2006;290:G852–8. doi: 10.1152/ajpgi.00521.2005. [DOI] [PubMed] [Google Scholar]
- 36.Grove KL, Fried SK, Greenberg AS, Xiao XQ, Clegg DJ. A microarray analysis of sexual dimorphism of adipose tissues in high-fat-diet-induced obese mice. Int J Obes. 2010;34:989–1000. doi: 10.1038/ijo.2010.12. [DOI] [PMC free article] [PubMed] [Google Scholar]
- 37.Piscaglia F, Knittel T, Kobold D, Barnikol-Watanabe S, Di Rocco P, Ramadori G. Cellular localization of hepatic cytochrome 1B1 expression and its regulation by aromatic hydrocarbons and inflammatory cytokines. Biochemical Pharmacology. 1999;58:157–65. doi: 10.1016/s0006-2952(99)00066-0. [DOI] [PubMed] [Google Scholar]
- 38.Ellero S, Chakhtoura G, Barreau C, Langouet S, Benelli C, Penicaud L, et al. Xenobiotic-metabolizing cytochromes p450 in human white adipose tissue: expression and induction. Drug Metab Dispos. 2010;38:679–86. doi: 10.1124/dmd.109.029249. [DOI] [PubMed] [Google Scholar]
- 39.Eckers A, Sauerbier E, Anwar-Mohamed A, Hamann I, Esser C, Schroeder P, et al. Detection of a functional xenobiotic response element in a widely employed FoxO-responsive reporter construct. Archives of Biochemistry and Biophysics. 2011;516:138–45. doi: 10.1016/j.abb.2011.10.006. [DOI] [PubMed] [Google Scholar]
- 40.Tanos R, Murray IA, Smith PB, Patterson A, Perdew GH. Role of the Ah receptor in homeostatic control of fatty acid synthesis in the liver. Toxicol Sci. 2012;129:372–9. doi: 10.1093/toxsci/kfs204. [DOI] [PMC free article] [PubMed] [Google Scholar]
- 41.Angrish MM, Jones AD, Harkema JR, Zacharewski TR. Aryl hydrocarbon receptor-mediated induction of Stearoyl-CoA desaturase 1 alters hepatic fatty acid composition in TCDD-elicited steatosis. Toxicol Sci. 2011;124:299–310. doi: 10.1093/toxsci/kfr226. [DOI] [PMC free article] [PubMed] [Google Scholar]
- 42.Liu X, Miyazaki M, Flowers MT, Sampath H, Zhao M, Chu K, et al. Loss of Stearoyl-CoA desaturase-1 attenuates adipocyte inflammation: effects of adipocyte-derived oleate. Arteriosclerosis, thrombosis, and vascular biology. 2010;30:31–8. doi: 10.1161/ATVBAHA.109.195636. [DOI] [PMC free article] [PubMed] [Google Scholar]
- 43.Chuang CY, Chang H, Lin P, Sun SJ, Chen PH, Lin YY, et al. Up-regulation of osteopontin expression by aryl hydrocarbon receptor via both ligand-dependent and ligand-independent pathways in lung cancer. Gene. 2012;492:262–9. doi: 10.1016/j.gene.2011.10.019. [DOI] [PubMed] [Google Scholar]
- 44.Kobayashi S, Isotani A, Mise N, Yamamoto M, Fujihara Y, Kaseda K, et al. Comparison of Gene Expression in Male and Female Mouse Blastocysts Revealed Imprinting of the X-Linked Gene, Rhox5/Pem, at Preimplantation Stages. Current Biology. 2006;16:166–72. doi: 10.1016/j.cub.2005.11.071. [DOI] [PubMed] [Google Scholar]
- 45.Soshilov AA, Denison MS. Ligand Promiscuity of Aryl Hydrocarbon Receptor Agonists and Antagonists Revealed by Site-Directed Mutagenesis. Molecular and Cellular Biology. 2014;34:1707–19. doi: 10.1128/MCB.01183-13. [DOI] [PMC free article] [PubMed] [Google Scholar]
- 46.Tanos R, Patel RD, Murray IA, Smith PB, Patterson AD, Perdew GH. Aryl hydrocarbon receptor regulates the cholesterol biosynthetic pathway in a dioxin response element-independent manner. Hepatology. 2012;55:1994–2004. doi: 10.1002/hep.25571. [DOI] [PMC free article] [PubMed] [Google Scholar]
- 47.Silkworth JB, Cutler DS, Okeefe PW, Lipinskas T. Potentiation and Antagonism of 2,3,7,8-Tetrachlorodibenzo-p-dioxin Effects in a Complex Environmental Mixture. Toxicology and Applied Pharmacology. 1993;119:236–47. doi: 10.1006/taap.1993.1065. [DOI] [PubMed] [Google Scholar]
- 48.Kerley-Hamilton JS, Trask HW, Ridley CJ, Dufour E, Lesseur C, Ringelberg CS, et al. Inherent and benzo[a]pyrene-induced differential aryl hydrocarbon receptor signaling greatly affects life span, atherosclerosis, cardiac gene expression, and body and heart growth in mice. Toxicol Sci. 2012;126:391–404. doi: 10.1093/toxsci/kfs002. [DOI] [PMC free article] [PubMed] [Google Scholar]
- 49.Nguyen TLA, Vieira-Silva S, Liston A, Raes J. How informative is the mouse for human gut microbiota research? Disease Models & Mechanisms. 2015;8:1–16. doi: 10.1242/dmm.017400. [DOI] [PMC free article] [PubMed] [Google Scholar]
- 50.Le Chatelier E, Nielsen T, Qin J, Prifti E, Hildebrand F, Falony G, et al. Richness of human gut microbiome correlates with metabolic markers. Nature. 2013;500:541–6. doi: 10.1038/nature12506. [DOI] [PubMed] [Google Scholar]
- 51.Ley RE, Turnbaugh PJ, Klein S, Gordon JI. Microbial ecology: Human gut microbes associated with obesity. Nature. 2006;444:1022–3. doi: 10.1038/4441022a. [DOI] [PubMed] [Google Scholar]
- 52.Gross DN, van den Heuvel APJ, Birnbaum MJ. The role of FoxO in the regulation of metabolism. Oncogene. 2008;27:2320–36. doi: 10.1038/onc.2008.25. [DOI] [PubMed] [Google Scholar]
- 53.Kahles F, Findeisen HM, Bruemmer D. Osteopontin: A novel regulator at the cross roads of inflammation, obesity and diabetes. Mol Metab. 2014;3:384–93. doi: 10.1016/j.molmet.2014.03.004. [DOI] [PMC free article] [PubMed] [Google Scholar]
- 54.Gómez-Ambrosi J, Catalán V, Ramírez B, Rodríguez A, Colina I, Silva C, et al. Plasma Osteopontin Levels and Expression in Adipose Tissue Are Increased in Obesity. The Journal of Clinical Endocrinology & Metabolism. 2007;92:3719–27. doi: 10.1210/jc.2007-0349. [DOI] [PubMed] [Google Scholar]
- 55.Grün NG, Zeyda K, Moreno-Viedma V, Strohmeier K, Staffler G, Zeyda M, et al. A humanized osteopontin mouse model and its application in immunometabolic obesity studies. Translational Research. 2016;178:63–73.e2. doi: 10.1016/j.trsl.2016.07.009. [DOI] [PubMed] [Google Scholar]
- 56.Lancha A, Rodriguez A, Catalan V, Becerril S, Sainz N, Ramirez B, et al. Osteopontin deletion prevents the development of obesity and hepatic steatosis via impaired adipose tissue matrix remodeling and reduced inflammation and fibrosis in adipose tissue and liver in mice. PLoS One. 2014;9:e98398. doi: 10.1371/journal.pone.0098398. [DOI] [PMC free article] [PubMed] [Google Scholar]
- 57.Flowers MT, Ntambi JM. Role of stearoyl-coenzyme A desaturase in regulating lipid metabolism. Curr Opin Lipidol. 2008;19:248–56. doi: 10.1097/MOL.0b013e3282f9b54d. [DOI] [PMC free article] [PubMed] [Google Scholar]
- 58.Dobrzyn P, Dobrzyn A, Miyazaki M, Cohen P, Asilmaz E, Hardie DG, et al. Stearoyl-CoA desaturase 1 deficiency increases fatty acid oxidation by activating AMP-activated protein kinase in liver. Proc Natl Acad Sci U S A. 2004;101:6409–14. doi: 10.1073/pnas.0401627101. [DOI] [PMC free article] [PubMed] [Google Scholar]
- 59.Sessler AM, Kaur N, Palta JP, Ntambi JM. Regulation of stearoyl-CoA desaturase 1 mRNA stability by polyunsaturated fatty acids in 3T3-L1 adipocytes. J Biol Chem. 1996;271:29854–8. doi: 10.1074/jbc.271.47.29854. [DOI] [PubMed] [Google Scholar]
- 60.Li F, Jiang C, Larsen MC, Bushkofsky J, Krausz KW, Wang T, et al. Lipidomics reveals a link between CYP1B1 and SCD1 in promoting obesity. J Proteome Res. 2014;13:2679–87. doi: 10.1021/pr500145n. [DOI] [PMC free article] [PubMed] [Google Scholar]