Abstract
For proton spot scanning, use of a real-time-image gating technique incorporating an implanted marker and dual fluoroscopy facilitates mitigation of the dose distribution deterioration caused by interplay effects. This study explored the advantages of using a real-time-image gating technique, with a focus on prostate cancer. Two patient-positioning methods using fiducial markers were compared: (i) patient positioning only before beam delivery, and (ii) patient positioning both before and during beam delivery using a real-time-gating technique. For each scenario, dose distributions were simulated using the CT images of nine prostate cancer patients. Treatment plans were generated using a single-field proton beam with 3-mm and 6-mm lateral margins. During beam delivery, the prostate was assumed to move by 5 mm in four directions that were perpendicular to the beam direction at one of three separate timings (i.e. after the completion of the first, second and third quartiles of the total delivery of spot irradiation). Using a 3-mm margin and second quartile motion timing, the averaged values for ΔD99, ΔD95, ΔD5 and D5–95 were 5.1%, 3.3%, 3.6% and 9.0%, respectively, for Scenario (i) and 2.1%, 1.5%, 0.5% and 4.1%, respectively, for Scenario (ii). The margin expansion from 3 mm to 6 mm reduced the size of ΔD99, ΔD95, ΔD5 and D5–95 only with Scenario (i). These results indicate that patient positioning during beam delivery is an effective way to obtain better target coverage and uniformity while reducing the target margin when the prostate moves during irradiation.
Keywords: gated radiotherapy, spot scanning, moving target, prostate cancer
INTRODUCTION
The proton spot-scanning technique has the potential to increase treatment efficiency relative to passive scattering techniques because of its high conformity to the target volume and because it does not require the use of patient-specific instruments such as a bolus and collimator. Despite these advantages, it also has a disadvantage in that the dose distribution created by the scanned beam is sensitive to organ motion [1]. For the case of prostate, the intrafractional motion can exceed 10 mm in 2 min according to the observation using the Calypso system (Calypso Medical Technologies, Seattle, WA) [2]. A similar tendency was also observed in the size of the treatment couch adjustment in real-time tumor-tracking radiation therapy (RTRT) [3]. The dosimetric impacts of these motions were investigated in previous studies [2, 4, 5], which all showed that even small motions can significantly reduce the target dose. They are partly compensated for by adding adequate internal margins [5], or averaging over the course of the treatment [2]. However, if the dose given to the surrounding normal tissues (such as rectum and bladder) is of concern, it is more desirable to deal with the motion without increasing the size of the margin, and in a single fraction.
In the simulation study performed by Ammazzalorso et al. [4], intrabeam motion compensation using the scanning beam adjustment was shown to be an effective measure to improve the target coverage. In this study, we focused on proton therapy and explored the effectiveness of the intrabeam patient repositioning method available in the recently developed Real-time-image Gated Proton-beam Therapy (RGPT) system. Using the RGPT system, the prostate position is monitored in real time before and during the beam delivery, and the patient is repositioned by adjusting the treatment couch when the drift occurs. The effectiveness of the motion compensation conducted before and during beam delivery was systematically compared using simulated dose distributions with two lateral margin sizes, target motions in four directions, and three different timings.
MATERIALS AND METHODS
Patient positioning methods using a fiducial marker
For prostate treatment, the RGPT system continuously measures the position of a gold sphere fiducial that is 1.5 mm in diameter, using two fluoroscopic images captured in 1 Hz before and during proton beam delivery. If the fiducial moves outside the pre-assigned gating window, set at ±2 mm relative to the planned positions, the proton beam irradiation is automatically stopped within 100 ms.
In the present study, we consider two scenarios involving patient positioning methods. In Scenario (i), the patient position is adjusted only before beam delivery by shifting the table so that the marker position matches the planned position. The marker position is not measured during beam delivery. In Scenario (ii), the patient position is adjusted both before and during beam delivery. During beam delivery, when the marker moves outside the gating window, the patient is repositioned immediately after the proton beam irradiation is stopped. Patient positioning during beam delivery contains only translation.
Treatment planning
Dose distributions were simulated using CT images from nine patients with prostate cancer for which the clinical target volume (CTV: 30.46–128.48 cm3) did not include the seminal vesicles. Single-field treatment plans were prepared with the proton beam on the left side of the patient, which would give the worst case scenario. Lateral margins of 3 mm and 6 mm and the distal margin of 0.035 times the depth of the distal edge of the CTV + 1 mm [6] are added in the water-equivalent space [7]. The prescription dose was D99 = 1.1 Gy, with a relative biological effectiveness (RBE) of 1.1 for each single fraction. Spot patterns were optimized without any dose constraint for organs at risk. The beam parameters used were modeled by the Proton Beam Therapy Center of Hokkaido University Hospital. We used a commercial treatment planning system (VQA, Hitachi, Ltd, Tokyo, Japan) to make these treatment plans. A summary of the treatment plan results is presented in Table 1. D5–95 represents the value for the difference between D5 and D95.
Table 1.
Treatment planning results
| Patient no. | 3 mm | 6 mm | ||||
|---|---|---|---|---|---|---|
| D95 [%] | D5 [%] | D5–95 [%] | D95 [%] | D5 [%] | D5–95 [%] | |
| 1 | 100.3 | 102.6 | 2.3 | 100.6 | 102.3 | 1.7 |
| 2 | 100.4 | 102.8 | 2.4 | 100.7 | 102.8 | 2.1 |
| 3 | 100.6 | 102.3 | 1.7 | 100.4 | 102.6 | 2.2 |
| 4 | 100.8 | 102.7 | 1.9 | 100.2 | 102.5 | 2.3 |
| 5 | 100.7 | 103.1 | 2.4 | 100.7 | 102.4 | 1.7 |
| 6 | 100.5 | 102.4 | 1.9 | 100.5 | 102.2 | 1.7 |
| 7 | 100.5 | 102.1 | 1.6 | 100.2 | 101.7 | 1.5 |
| 8 | 100.3 | 102.6 | 2.3 | 100.6 | 102.3 | 1.7 |
| 9 | 100.6 | 102.5 | 1.9 | 100.1 | 102.0 | 1.9 |
| Average | 100.5 | 102.6 | 2.1 | 100.5 | 102.3 | 1.9 |
The lateral margins were 3 mm and 6 mm. All values were regularized to the prescription dose of 1.1 Gy (relative biological effectiveness).
Target motion
We assumed four target motion directions: superior, inferior, anterior and posterior. Left and right motions were shown to be relatively small compared with the other directions [3]. Moreover, left and right motions produce no differences in the dosimetric parameters considered in this study for the two positioning methods (i) and (ii). Therefore, their effects were briefly examined in the Discussion section. The target motion distance was 5 mm in the superior and inferior directions and 4.88 mm in the anterior and posterior directions. These values all represented multiples of the CT image resolution. The timing of the target motion was defined as the ratio of the number of spots that had already been delivered to the total number of spots. We selected three ratios as target motion timings: the first, second and third quartiles.
Dose calculation with target motion
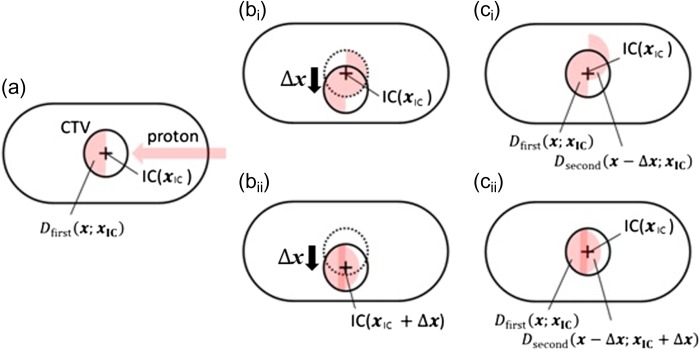
Target movements were simulated by displacing the original CTV contour in each of four directions without deforming the original CT images [5]. We assumed target rigidity and homogeneity to simplify the calculations. In addition, each target was assumed to move in a moment, and marker position adjustment was performed immediately after the target motion. First, the dose distributions before the target motion were calculated, which were the same in both scenarios. These values were denoted as , indicating the dose value at when the beam isocenter was positioned at . The coordinate origin was fixed at a certain point for each patient (Fig. 1a). Then, the dose distributions after the target motion of were calculated. Since the isocenter does not change in Scenario (i), the dose distribution was (Fig. 1bi). On the other hand, in Scenario (ii), changed with , so the dose distribution was (Fig. 1bii). We used shifted dose distributions for the evaluations, with the original CTV located in the original position. Consequently, the total dose for evaluation at becomes
for Scenario (i) (Fig. 1ci), and
for Scenario (ii) (Fig. 1cii).
Fig. 1.
(a) Calculated geometry for the dose before target movement. The circle and the cross indicate the clinical target volume and the isocenter, respectively. The proton beam was assumed to be placed on the left side of each patient. (bi) Calculation geometry for the dose after target movement in Scenario (i). (bii) Calculation geometry for the dose after target movement in Scenario (ii). The isocenter also moves within each patient's geometry to do patient positioning after target movement. (ci) Evaluation geometry for Scenario (i). (cii) Evaluation geometry for Scenario (ii).
Evaluation
We calculated the dose–volume histogram (DVH) from the simulated dose distribution using MIM Maestro (MIM Software Inc., Cleveland, OH, USA). D5–95 values, which were the differences between D5 and D95 values in the CTV, were used to evaluate uniformity. ΔD99 and ΔD95, which were the differences in D99 and D95 between dose distributions with a target motion and an original dose distribution without target motion, were used to evaluate target coverage. ΔD5 values were used to evaluate hot spots of dose distribution. We evaluated the difference using a paired sample sign test, with P-values <0.05 considered significant.
RESULTS
Figure 2 shows how the dose distribution deteriorates when the prostate moves during beam delivery (Patient #1). Compared with the plan, clear underdosing was observed if patient repositioning was not performed during beam delivery (Fig. 2b), while the dose distribution was similar to the plan if the patient was repositioned (Fig. 2c).
Fig. 2.

(a) Planned dose distribution; (b, c) dose distribution obtained when the prostate moves in the posterior direction after the completion of the second quartiles of the total delivery of the spot irradiation. (b) Patient is not repositioned (Scenario (i)), and (c) patient is repositioned (Scenario (ii)) (Patient #1).
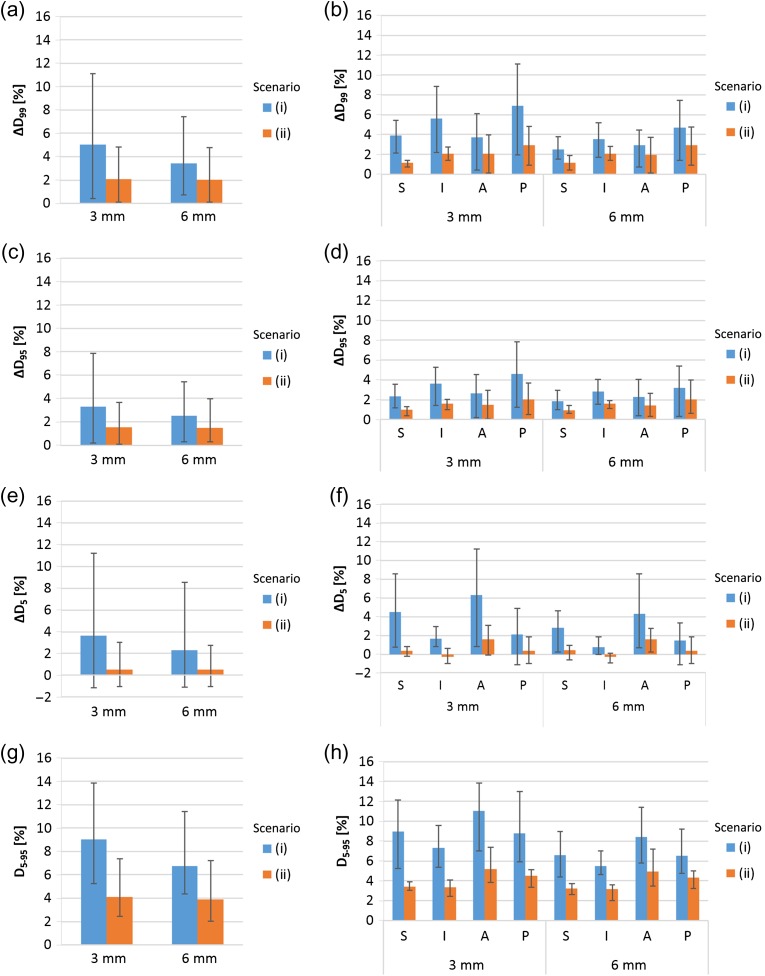
Figure 3 shows the results of second quartile target motion timing cases with 3-mm and 6-mm lateral margins. With 3-mm margin cases, the averaged values for ΔD99, ΔD95, ΔD5 and D5–95 were 5.1%, 3.3%, 3.6% and 9.0%, respectively, for Scenario (i), and 2.1%, 1.5%, 0.5% and 4.1%, respectively, for Scenario (ii). With 6 mm lateral margin cases, averaged values for ΔD99, ΔD95, ΔD5 and D5–95 were 3.4%, 2.5%, 2.3% and 6.8%, respectively, for Scenario (i), and 2.0%, 1.5%, 0.5% and 3.9%, respectively, for Scenario (ii). The ΔD99, ΔD95, ΔD5 and D5–95 values for Scenario (ii) were significantly smaller than the parallel values for Scenario (i) (P < 0.05), with the exception of two cases of ΔD95 and ΔD5 with a posterior direction (P > 0.05). These data showed that expansion of the margin from 3 mm to 6 mm markedly reduced ΔD99, ΔD95, ΔD5 and D5–95 values only with Scenario (i).
Fig. 3.
Averaged ΔD99(a), ΔD95(c), ΔD5(e) and D5–95(g) values from 36 cases (derived from nine patients and four directions) for each margin, with error bars indicating the maximum and minimum. Averaged ΔD99(b), ΔD95(d), ΔD5(f) and D5–95(h) values for nine cases, with error bars indicating the mean maximum and minimum for each margin and direction of motion. The motion timing of these data is the second quatile of the total delivery of the spot irradiation. The lateral axes show the margin size.
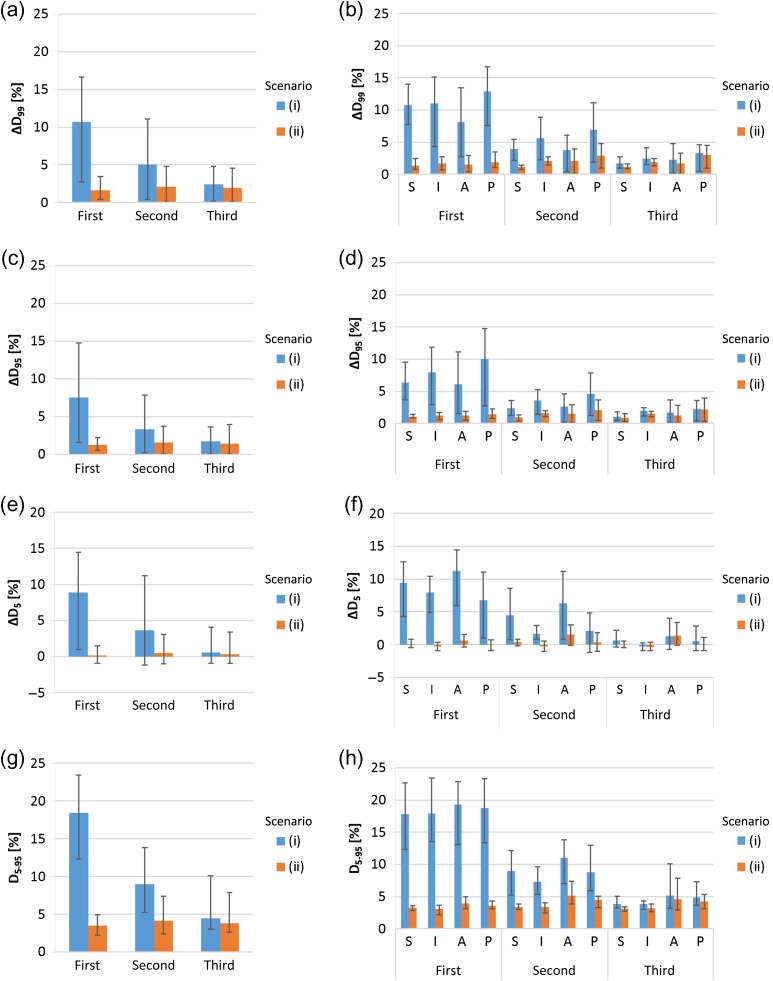
Figure 4 shows the results of three target motion timing cases using a 3-mm lateral margin. The data for the second quartile target motion timing was the same as in Fig.1. With the first quartile motion timing cases, the averaged values for ΔD99, ΔD95, ΔD5 and D5–95 were 10.7%, 7.6%, 8.8% and 18.5%, respectively, for Scenario (i), and 1.6%, 1.3%, 0.2% and 3.5%, respectively, for Scenario (ii). With third quartile motion timing cases, the averaged values for ΔD99, ΔD95, ΔD5 and D5–95 were 2.4%, 1.8%, 0.6% and 4.4%, respectively, for Scenario (i), and 1.9%, 1.4%, 0.3% and 3.8%, respectively, for Scenario (ii). The ΔD99 and ΔD95 values for Scenario (ii) were significantly smaller than those for Scenario (i) (P < 0.05), except for cases with motion in the posterior direction during the third quartile (P > 0.05). The ΔD5 values for Scenario (ii) were significantly smaller than those for Scenario (i) (P < 0.05), except for cases with motion in the inferior and anterior directions during the third quartile (P > 0.05). The D5–95 values for Scenario (ii) were significantly smaller than those for Scenario (i) (P < 0.05), except for cases with motion in the anterior or posterior direction during the third quartile (P > 0.05). These data showed that the differences between scenarios (i) and (ii) were larger with motions that occurred earlier in treatment.
Fig. 4.
Averaged ΔD99(a), ΔD95(c), ΔD5(e) and D5–95(g) values from 36 cases (derived from nine patients and four directions) for each motion timing, with error bars indicating the maximum and minimum. Averaged ΔD99(b), ΔD95(d), ΔD5(f) and D5–95(h) values for nine cases, with error bars indicating the mean maximum and minimum for each target motion timing and direction of motion. The lateral margin size of these data is 3 mm. The lateral axes show the target motion timing.
DISCUSSION
This study simulated proton dose distributions with motion in a moment and compared ΔD99, ΔD95, ΔD5 and D5–95 values between Scenarios (i) and (ii). The values for Scenario (ii) were significantly smaller than for Scenario (i) in most cases. This finding indicated that patient positioning during beam delivery was useful with prostate irradiation using proton spot scanning. These results were in agreement with those reported by Ammasallo, who analyzed carbon dose distributions in the prostate using real patient geometry and prostate track data that were measured using an electric transmitter, and showed data indicating that intrabeam motion compensation, such as adjustments to the patient position or beam position during irradiation, improve the resulting target coverage [4]. In addition, we found that the differences in ΔD99, ΔD95, ΔD5 and D5–95 values between Scenarios (i) and (ii) depend on both motion timing and target margin. The differences were large with cases showing a small margin and early target motion—patient positioning during beam delivery effectively reduced the target motion effect especially well in these cases.
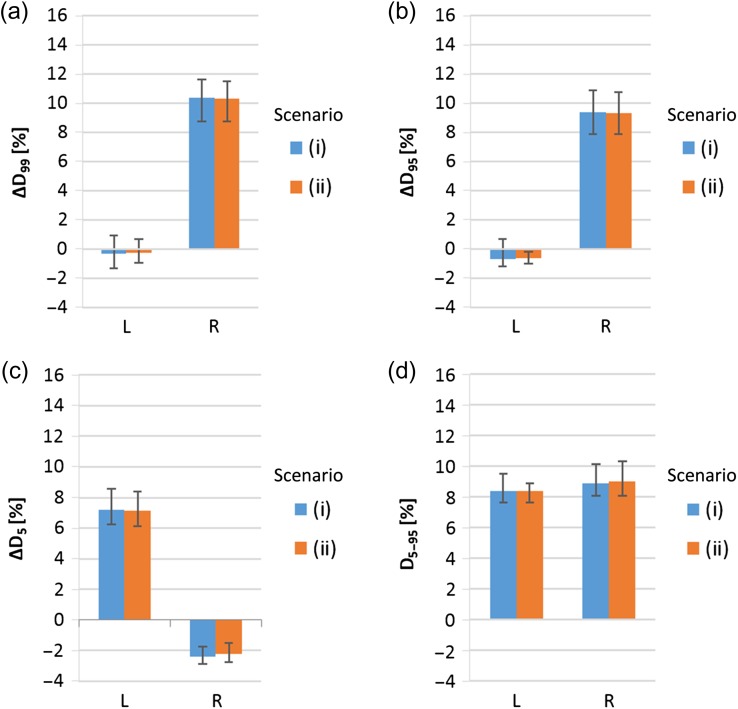
As the previous studies observed that the most relevant motion directions are the superior, inferior, anterior and posterior directions, the study focused on those directions vertical to the proton beam. If the prostate moves in the left or right directions parallel to the beam, the hot and cold spots emerge in the middle of the target, which cannot be compensated for by the margins and by patient repositioning during beam delivery. As shown in Fig. 5, for the nine patients studied, if the prostate moves in right (left) directions at the completion of half of the total delivery of spot irradiation, the parameters of ΔD99 and ΔD95 (ΔD5) exceed 9% (7%), and in both directions, the D5–95 value exceeds 8%. In reality, the left and right motion of the fiducial marker does not immediately suggest a change of Bragg-peak positions in the beam direction. To recognize a change in positions of the Bragg peak, one needs real-time range verification techniques, such as prompt gamma imaging [8], in addition to monitoring of the marker position using fluoroscopy imaging. If the above dose deteriorations occur, they may be mitigated by using multiple irradiation fields, as was proposed by Knopf et al. [9], or real-time range compensation, as was proposed by Smeets et al. [8].
Fig. 5.
Averaged ΔD99(a), ΔD95(b), ΔD5(c) and D5–95(d) values over nine patients for left and right motions. The error bars indicate the maximum and minimum. The lateral margin size of these data is 6 mm. The motion timing of these data is at half of the total delivery of spot irradiaton.
In comparison with data measured with 3 mm of movement over 5 min (43%) [10], our assumption of 5-mm motion in 2 min—the typical amount of time for prostate irradiation per field, is a large value relative to a clinical situation. With the instantaneous motion case assumed in this study, we can assume that cold or hot spots that appear in a local area represent a bigger difference. In the slow-motion cases that usually occur, cold or hot spots may appear over a widespread area as a smaller difference. Therefore, the values reported from this study are considered to represent a worst case scenario. These values were obtained from one field and one fraction irradiation. In a real clinical case, more than one field is used and the target motion is not the same for each fraction; therefore, the ΔD99, ΔD95 and D5–95 values for the accumulated total dose distribution are drastically smaller than the values in the present study. We currently accumulate data to record the prostate motion over the whole beam delivery time and whole fractions in order to obtain a semi-automatic cumulative dose calculation system.
With Scenario (ii), the length of the margin made little difference relative to uniformity and coverage. This finding indicates that a margin of <3 mm may be able to form uniform dose distribution as well as a 3-mm margin. With Scenario (i), the margin expansion was effective at mitigating the interplay effect. Consequently, Scenario (ii) allows for a smaller margin length than Scenario (i). The size of the gating window is recommended as ±2 mm [11], so that the position of the marker can be viewed with 2 mm of error. Also, we have not considered the anatomical geometry changes for each fraction. The length of the margin should be decided with consideration of gating window size, patient positioning error, and anatomical changes on a day-by-day basis.
In this study, we did not consider the dose delivered to the bladder or the rectum, which are regarded as organs at risk during prostate irradiation. The anatomical changes in the whole body during target motion must be known in order to optimally deal with the side effects of these organs, and this should be the next step in optimization analysis.
CONFLICT OF INTEREST
The authors declare that they have no competing interests.
FUNDING
This research is supported by the Global Institution for Collaborative Research and Education(GI-CoRE), Hokkaido University, founded by the Ministry of Education, Culture, Sports, Science and Technology MEXT, Japan, and JSPS KAKENHI Grant No. 15K09984.
REFERENCES
- 1. Phillips M-H, Pedroni E, Blattmann H, et al. Effects of respiratory motion on dose uniformity with a charged particle scanning method. Phys Med Biol 1992;37:223–34. [DOI] [PubMed] [Google Scholar]
- 2. Tang S, Deville C, McDonough J, et al. Effect of intrafraction prostate motion on proton pencil beam scanning delivery: a quantitative assessment. Int J Radiat Oncol Biol Phys 2013;87:375–82. [DOI] [PubMed] [Google Scholar]
- 3. Shimizu S, Osaka Y, Shinohara N, et al. Use of implanted markers and interportal adjustment with real-time tracking radiotherapy system to reduce intrafraction prostate motion. Int J Radiat Oncol Biol Phys 2011;81:393–9. [DOI] [PubMed] [Google Scholar]
- 4. Ammazzalorso F, Graef S, Weber U, et al. Dosimetric consequences of intrafraction prostate motion in scanned ion beam radiotherapy. Radiother Oncol 2014;112:100–5. [DOI] [PubMed] [Google Scholar]
- 5. Yoon M, Kim D, Shin D-H, et al. Inter-and intrafractional movement–induced dose reduction of prostate target volume in proton beam treatment. Int J Radiat Oncol Biol Phys 2008;71:1091–102. [DOI] [PubMed] [Google Scholar]
- 6. Zhu X-R, Sahoo N, Zhang X, et al. Intensity modulated proton therapy treatment planning using single-field optimization: the impact of monitor unit constraints on plan quality. Med Phys 2010;37:1210–9. [DOI] [PMC free article] [PubMed] [Google Scholar]
- 7. Park P-C, Zhu X-R, Lee A-K, et al. A beam-specific planning target volume (PTV) design for proton therapy to account for setup and range uncertainties. Int J Radiat Oncol Biol Phys 2012;82:e329–36. [DOI] [PMC free article] [PubMed] [Google Scholar]
- 8. Smeets J, Roellinghoff F, Prieels D, et al. Prompt gamma imaging with a slit camera for real-time range control in proton therapy. Phys Med Biol 2012;57:3371. [DOI] [PubMed] [Google Scholar]
- 9. Knopf A, Hong T, Lomax A. Scanned proton radiotherapy for mobile targets—the effectiveness of re-scanning in the context of different treatment planning approaches and for different motion characteristics. Phys Med Biol 2011;56:7257. [DOI] [PubMed] [Google Scholar]
- 10. Langen K-M, Willoughby T-R, Meeks S-L, et al. Observations on real-time prostate gland motion using electromagnetic tracking. Int J Radiat Oncol Biol Phys 2008;71:1084–90. [DOI] [PubMed] [Google Scholar]
- 11. Matsuura T, Miyamoto N, Shimizu S, et al. Integration of a real-time tumor monitoring system into gated proton spot-scanning beam therapy: an initial phantom study using patient tumor trajectory data. Med Phys 2013;40:071729. [DOI] [PubMed] [Google Scholar]


