Abstract
Nucleobase methylations are ubiquitous posttranscriptional modifications of ribonucleic acids (RNA) that can substantially increase the structural diversity of RNA in a highly dynamic fashion with implications for gene expression and human disease. However, high throughput, deep sequencing does not generally provide information on posttranscriptional modifications (PTMs). A promising alternative approach for the characterization of PTMs, i.e. their identification, localization, and relative quantitation, is top-down mass spectrometry (MS). In this study, we have investigated how specific nucleobase methylations affect RNA ionization in electrospray ionization (ESI), and backbone cleavage in collisionally activated dissociation (CAD) and electron detachment dissociation (EDD). For this purpose, we have developed two new approaches for the characterization of RNA methylations in mixtures of either isomers of RNA or nonisomeric RNA forms. Fragment ions from dissociation experiments were analyzed to identify the modification type, to localize the modification sites, and to reveal the site-specific, relative extent of modification for each site.
INTRODUCTION
Decades of research have identified more than 140 chemically distinct types of posttranscriptional RNA modifications, of which roughly two thirds involve methylation (1–4). Methylated RNA nucleotides can be found in all kingdoms of life, and a large variety of biological processes relies on dynamic and reversible methylation of both coding and noncoding (nc) RNA (5,6). For example, recent studies have revealed vital roles of N6-methyladenosine (m6A) (7,8), 5-methylcytidine (m5C) (9,10) and N1-methyladenosine (m1A) (11,12) in posttranscriptional regulation of gene expression. RNA methylation is implicated in human disease (13–16) and can frequently be found in ncRNAs whose functions are still unknown (17–19). Research into ncRNAs progresses at a high rate, but is still critically hindered by lack of adequate methodology for the characterization of posttranscriptional modifications of RNA. In two recent review articles, Limbach (20) and Helm and Motorin (21) discuss the broad range of experimental methods available for the detection of RNA modifications, and point out mass spectrometry (MS) as ‘the only technology capable of directly identifying nearly all possible chemical modifications in RNA’ and ‘the apparently most straightforward approach’ to sequence-specific analysis of transcriptomes, respectively.
Although the development of MS methodology for the characterization of modified RNA has been slower than that of proteins (22–27), an increasing number of studies illustrates the high potential of both the ‘bottom-up’ (28) and ‘top-down’ (29) approaches that were originally developed for MS of proteins. For example, bottom-up MS, which relies on chemically or enzymatically catalyzed protein or RNA hydrolysis and separation of the products by liquid chromatography (LC) prior to MS analysis, has been used to identify and localize a novel form of N6-threonylcarbamoyladenosine (t6A), i.e. 2-methylthio cyclic N6-threonylcarbamoyladenosine (ms2ct6A), in transfer RNA (tRNA) (30), and, in combination with stable isotope labeling, for quantitative analysis of ribosomal RNA (rRNA) (31) and tRNA (32,33) modifications. LC–MS based methods for the identification and quantitation of modified nucleosides have been designed to probe tissue-specific tRNA modification levels (34), to simultaneously identify and quantify modified nucleosides from <200 nt RNA (35), to characterize ribosomal RNAs (36), and to explore the epitranscriptome of human neural stem cells with attomole sensitivity (37). Recently, sophisticated, label-free MS methods were used without LC to profile RNA modifications at the full-transcriptome level (38), and label-free LC–MS analysis of messenger RNA capping efficiency has been reported (39). Bottom-up MS can also be used to detect and localize the mass-silent modification pseudouridine (40–42). Because top-down MS does not involve hydrolysis, it can be used to detect and characterize different forms of a protein or RNA whereby it can provide a complete description of the primary structure and reveal all mass-altering modifications, as well as any correlations that exist between these modifications (43). Top-down MS (43–45) has been used for the direct identification of human cellular microRNA (miRNA) (46), small interfering RNA (siRNA) (47), for the characterization of synthetic 21–23 nt RNA (48), tRNA (49) and RNA stem–loop motifs modified by structural probes (50), for de novo sequencing of tRNA (51), and for probing tat peptide binding to TAR RNA (52).
Here we explore the potential of top-down MS for the simultaneous identification, localization and relative quantitation of methylated RNA residues using electrospray ionization (ESI), low-energy collisionally activated dissociation (CAD), and electron detachment dissociation (EDD) (51,53,54). Our label-free, direct approach for this purpose builds on previous studies of modified bovine ribonuclease A (55), human histone H3 (56,57) and H4 (58), tropomyosin (59), and cardiac troponin I (60) proteins, and requires that RNA methylation does not affect RNA desorption, ionization and dissociation. Moreover, the approach relies on high sequence coverage, so RNA backbone cleavage should be largely nonselective with respect to nucleobase identity. Although EDD is somewhat affected by nucleobase ionization energy (53), it provided 80% sequence coverage for highly modified 76 nt tRNA in a single spectrum, and low-energy CAD of the same tRNA provided 89% sequence coverage (51).
The chemical structures of the nucleobase methylations investigated, m6A, m5C, m3U and m5U, are shown in Scheme 1. Because all previously proposed mechanisms for RNA backbone cleavage into c and y fragments (Scheme 2) by low-energy CAD involve the ribose 2΄-OH group but not the nucleobase (61–64), nucleobase modifications should generally not affect the yield of c and y fragments. However, we have recently found increased backbone cleavage into c and y fragments on the 5΄ side of adenosine and guanosine in CAD of RNA (M+nH)n+ and (M−nH)n− ions, respectively, which we attributed to hydrogen bonding between nucleobases and phosphates (65); nucleobase methylation may affect hydrogen bonding and thus backbone cleavage. Likewise, nucleobase methylation can affect nucleobase ionization energy and thus backbone cleavage into d and w fragments by EDD (53).
Scheme 1.
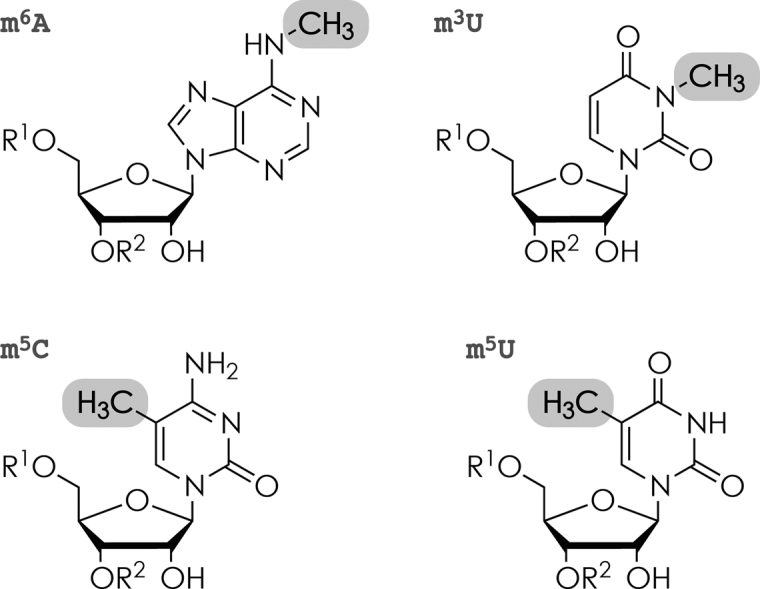
Chemical structure of methylated nucleoside residues studied: N6-methyladenosine (m6A), 5-methylcytidine (m5C), 3-methyluridine (m3U), and 5-methyluridine (m5U).
Scheme 2.
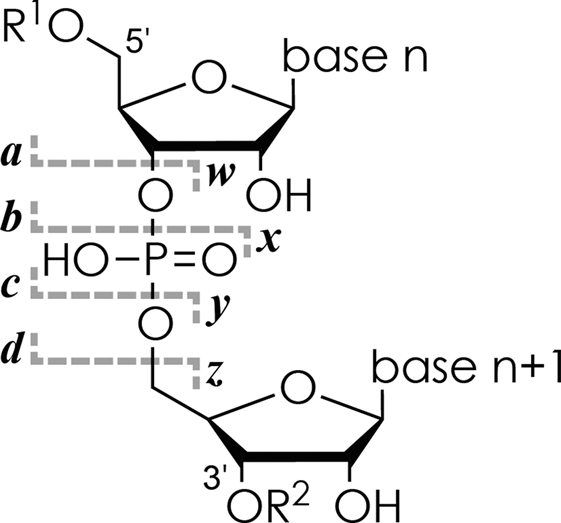
Nomenclature of fragment ions from RNA backbone cleavage according to reference (66).
In the following, we refer to RNA isomers and forms as RNAs with the same basic sequence but different methylation patterns. As exemplified for a 10 nt sequence in Scheme 3A, RNA isomers (left) comprise the same number of methylated residues but at different positions, whereas RNA forms (right) differ by the number of methylated residues. RNA isomers, by definition, have the same elemental composition and therefore the exact same mass, are frequently inseparable by chromatographic means, and cannot be resolved by single-stage mass spectrometry. RNA forms differ in elemental composition and can be distinguished from each other by single-stage mass spectrometry as each methylation results in a 14.0157 Da mass increase, but isolation of individual forms in the mass spectrometer is only possible for RNAs of up to ∼20 nt due to overlap of isotopic profiles (Scheme 3B).
Scheme 3.
(A) Schematic illustration of RNA isomers and forms, m indicates methylation sites, and (B) calculated isotopic profiles for 20 nt (A5C5G5U5), 40 nt (A10C10G10U10), and 80 nt (A20C20G20U20) RNA with (open circles) and without (filled circles) a single methylation (+CH2, 14.0157 Da).
MATERIALS AND METHODS
Experiments were performed on a 7 T Fourier transform ion cyclotron resonance (FT-ICR) mass spectrometer (Bruker, Austria) equipped with an ESI source for (M−nH)n− ion generation, a collision cell through which a flow of Ar gas was maintained for CAD, and a hollow dispenser cathode for EDD. The mass resolving power of this instrument is routinely (broadband detection, 2M data points for a ∼2 s transient) ∼220 000, ∼120 000 and ∼80 000 at m/z 500, 1000 and 1500, respectively, and the mass accuracy is ∼1 ppm with internal calibration (∼20 ppm with external calibration). RNA was electrosprayed (flow rate 1.5 μl/min) from 0.375 to 3 μM solutions in 1:1 H2O/CH3OH with ammonium acetate or organic bases as additives, and polyethylene glycol 1000 (Sigma-Aldrich, Austria) was used as internal calibrant for accurate mass measurements (Table 1). Methanol was HPLC grade (Acros, Austria), H2O was purified to 18 MΩ·cm at room temperature using a Milli-Q system (Millipore, Austria), ammonium acetate (≥99.0%, Na ≤ 5 mg/kg, K ≤ 5 mg/kg), ammonium citrate (2.5 M in H2O, Na ≤ 20 mg/kg, K ≤ 20 mg/kg), piperidine (≥99.5%), imidazole (≥99.5%, Na ≤ 50 mg/kg, K ≤ 50 mg/kg), and quinuclidine (97.0%, used as additive solely for accurate mass measurement of RNAs 14 and 15) were from Sigma-Aldrich (Austria). The (M−nH)n− ions under study were isolated in a linear quadrupole prior to dissociation by CAD or EDD; for a more detailed description of the experimental setup for CAD and EDD, see (67) and (53), respectively. For statistical reasons, between 25 and 500 scans were added for each spectrum (50–100 for ESI, 25–50 for (M−nH)n− ion isolation, 200–500 for CAD and EDD), and data reduction utilized the SNAP2 algorithm (Bruker, Austria). RNAs 1, 7, 11 and 13–15 (Table 1) were prepared by solid-phase synthesis (68,69) and purified by HPLC. All other RNAs (Table 1) were custom synthesized by commercial suppliers: 2 by BioSpring GmbH (Frankfurt am Main, Germany), 3, 8–10 and 12 by Microsynth AG (Balgach, Switzerland), 4–6 and 16–20 by Dharmacon GE Healthcare (Lafayette, CO, USA), and purified by HPLC. For desalting, 400 μl of an ammonium salt solution (100 mM ammonium acetate in H2O for RNAs 1–7, 11–13 and 16–20, 100 mM ammonium citrate in 1:1 H2O/CH3OH for RNAs 8–10 and 14–15) was added to 100 μl RNA solution (2.5–10 nmol in H2O) and concentrated to 50 μl using Vivaspin 500 centrifugal concentrators (Sartorius, Germany, PES membrane, MWCO 3000 for RNAs 1–7, 11–13 and 16–20, and MWCO 5000 for RNAs 8–10 and 14–15). The process was repeated five to seven times, followed by six to seven cycles of concentration and dilution with H2O (RNAs 4–7, 11–13 and 16–20) or 1:1 H2O/CH3OH (RNAs 1–3, 8–10 and 14–15). To minimize possible effects of RNA higher order structure on electrospray ionization and UV absorption, the samples in H2O were diluted with CH3OH to 1:1 H2O/CH3OH (70–72). RNA concentration was subsequently determined by UV absorption at 260 nm using a NanoPhotometer (Implen, Germany). In first experiments in which we studied mixtures of isomers and forms comprising m6A (23 nt RNAs 4–6, 16 and 17) and m3U (52 nt RNAs 14 and 15), nucleotide absorption coefficients from reference (73) were used because comparable values for unmethylated and methylated bases were not available. However, nucleoside absorption coefficients of A and m6A published later differed by only 3.2% (37), which amounts to negligible differences of <0.5% for RNAs 4–6; the stoichiometry of RNA isomers 4, 16 and 17 should not be affected. Values for m3U are still not available, but a single methylation (U: 8912.32 l·mol−1·cm−1, m5U: 7743.31 l·mol−1·cm−1, m6U: 9651.15 l·mol−1·cm−1 (37)) should not significantly affect the absorption coefficient of the 52 nt RNAs 14 and 15. For all other experiments, absorption coefficients for m5U (13% smaller than that of U) and m5C (43% smaller than that of C) were used (37). Mixtures of RNA forms or isomers in H2O/CH3OH were prepared immediately before each measurement. The amount of RNA sample consumed in the top-down MS experiments here varied between 0.0375 and 0.3 nM, but sensitivity on more modern instruments (nano-ESI source, rf ion transfer, stronger magnets, etc.) can be estimated to be higher by a factor of at least 200, corresponding to 0.1875–1.5 pM.
Table 1. RNA studied.
| RNA | Sequencea | nt | M measured b | M calculated b |
|---|---|---|---|---|
| 1 | GAAGG UUUUC CUUCG | 15 | 4729.619 | 4729.621 |
| 2 | GAAGG m5Um5UUUC CUUCG | 15 | 4757.651 | 4757.652 |
| 3 | GAAGG m5Um5Um5Um5UC CUUCG | 15 | 4785.679 | 4785.684 |
| 4 | pAUUAU AAm6ACC AAACA AAAAA UAA | 23 | 7439.107 | 7439.101 |
| 5 | pAUUAU m6AAACC Am6AACA AAAAA UAA | 23 | 7453.125 | 7453.117 |
| 6 | pAUUAU m6Am6Am6ACC AAACA AAAAA UAA | 23 | 7467.122 | 7467.133 |
| 7 | AUCUG CUUGC CCAUC GGGGC CGCGG AU | 27 | 8615.163 | 8615.162 |
| 8 | AUCUG CUUGm5C CCAUC GGGGC CGCGG AU | 27 | 8629.177 | 8629.177 |
| 9 | AUCUG CUUGC CCAUC GGGGm5C CGCGG AU | 27 | 8629.175 | 8629.177 |
| 10 | AUCUG CUUGC CCAUC GGGGC m5CGCGG AU | 27 | 8629.176 | 8629.177 |
| 11 | AUCUG CUUGm5C Cm5CAUC GGGGC CGCGG AU | 27 | 8643.192 | 8643.193 |
| 12 | AUCUG CUUGm5C CCAUC GGGGm5C m5CGCGG AU | 27 | 8657.201 | 8657.209 |
| 13 | AUCUG CUUGm5C m5Cm5CAUC GGGGm5C CGCGG AU | 27 | 8671.238 | 8671.224 |
| 14 | UCGCG CUGAU UUAAC CGUAU UGCAA GCGCG UGAUA AAUGU AGCUA AAAAG GG | 52 | 16764.267 | 16764.267 |
| 15 | UCGCG CUGAU UUAAC CGUAU UGCAA GCGCG m3UGAUA AAUGU AGCUA AAAAG GG | 52 | 16778.285 | 16778.283 |
| 16 | pAUUAU m6AAACC AAACA AAAAA UAA | 23 | 7439.105 | 7439.101 |
| 17 | pAUUAU Am6AACC AAACA AAAAA UAA | 23 | 7439.104 | 7439.101 |
| 18 | pAUUAU m5CCCCC AAACA AAAAA UAA | 23 | 7367.066 | 7367.068 |
| 19 | pAUUAU Cm5CCCC AAACA AAAAA UAA | 23 | 7367.075 | 7367.068 |
| 20 | pAUUAU CCm5CCC AAACA AAAAA UAA | 23 | 7367.066 | 7367.068 |
aFrom 5΄ to 3΄ terminus, OH-terminated unless indicated (p: phosphate)
bIn Da; M refers to the mass of the most abundant isotope.
RESULTS AND DISCUSSION
ESI MS of methylated RNA
The first question that we have addressed is whether or not nucleobase methylation affects the yield and net charge of (M−nH)n− ions from ESI. For this purpose, mixtures of different forms of methylated RNA with the same basic sequence were electrosprayed from denaturing solutions (1:1 H2O/CH3OH) (70–72) using different ESI additives that affect the average net charge of the (M−nH)n− ions (74). Although all RNAs studied here were purified by HPLC, we first recorded separate ESI MS spectra of each RNA sample to verify their purity. For RNAs 4, 5 and 6, which were simultaneously purchased from the same supplier, the ESI MS spectra indicated similar purities of 85, 80 and 81%, respectively; the various ions of generally low abundance that did not correspond to RNAs 4, 5 and 6 presumably originated from coelution of by-products formed during RNA synthesis or partial hydrolysis. As illustrated in Figure 1 for a 1:1:1 mixture of the samples of RNAs 4, 5 and 6 with one, two, and three m6A residues, respectively, the yield of (M−nH)n− ions of the three forms (normalized to the total abundance of all (M−nH)n− ions of RNAs 4, 5 and 6) was the same within ±2% for each net charge n. Moreover, no significant correlation between total ion yield or average net charge and the extent of methylation was found, regardless of the ESI additive used (Table 2), suggesting that the small deviations from nonstoichiometric (M−nH)n− ion yields are unsystematic errors and not caused by nucleobase methylation. Yields corrected for the above purity values were similarly unsystematic and agreed with uncorrected values to within ≤1.2% (Table 2).
Figure 1.
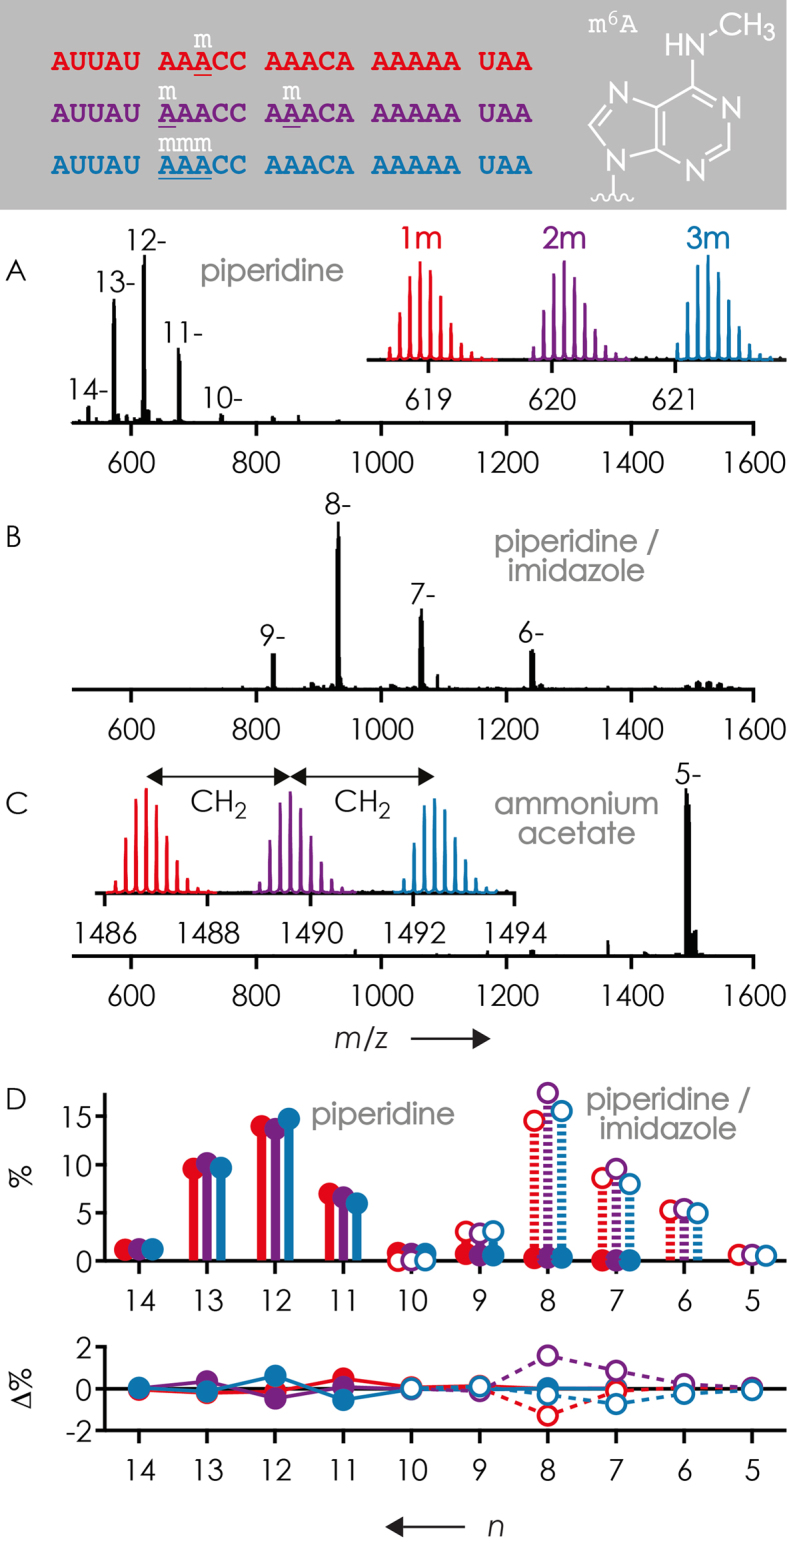
Mass spectra from ESI of 1:1:1 mixtures of 23 nt RNAs 4, 5 and 6 (0.5 or 1 μM each) in 1:1 H2O/CH3OH using (A) 25 mM piperidine, (B) 25 mM piperidine and 25 mM imidazole and (C) 20 mM CH3COONH4 as additives, insets show expanded regions with isotopic profiles of the most abundant (M−nH)n− ions and (D) corresponding yield of (M−nH)n− ions (top) and deviation from average yield (bottom) for piperidine (filled circles) and piperidine/imidazole (open circles) versus net charge. Color coding refers to the number of m6A residues: red for 1 (RNA 4), violet for 2 (RNA 5) and blue for 3 (RNA 6).
Table 2. Average charge and yield of (M−nH)n− ions from ESI of RNAs 4, 5 and 6.
| ESI additive | RNA | # of m6A residues | Average charge | Yield [%] | Corrected yield [%] |
|---|---|---|---|---|---|
| Piperidine | 4 | 1 | 11.99 | 33.5 | 32.4 |
| (25 mM, pH ∼10) | 5 | 2 | 12.04 | 33.2 | 34.1 |
| 6 | 3 | 12.04 | 33.2 | 33.5 | |
| Piperidine/imidazole | 4 | 1 | 7.44 | 32.0 | 30.9 |
| (25 mM each, pH ∼10) | 5 | 2 | 7.46 | 35.9 | 36.8 |
| 6 | 3 | 7.50 | 32.1 | 32.3 | |
| Ammonium acetate | 4 | 1 | 4.98 | 34.5 | 33.3 |
| (20 mM, pH ∼6) | 5 | 2 | 4.99 | 33.2 | 34.1 |
| 6 | 3 | 4.99 | 32.3 | 32.6 |
Equations for calculation of average charge and yield can be found in the supporting information.
However, for other RNA forms, our MS data revealed substantial differences in purity of up to ∼20%. For example, ESI of a supposedly equimolar mixture of 27 nt RNAs 7, 8, 11, 12 and 13 with up to four methylated m5C residues showed differences in (M−nH)n− ion yield (normalized to the total abundance of all (M−nH)n− ions of RNAs 7, 8, 11, 12 and 13) of up to 5% (Figure 2), but again, no significant correlation between ion yield or average net charge (6.47, 6.47, 6.47, 6.48, 6.49, respectively) and the extent of methylation was found. Instead, separate ESI MS spectra of each RNA indicated purities between ∼63% and ∼81% that correlated linearly (R2 = 0.9985) with (M−nH)n− ion yields from ESI of the supposedly equimolar mixture. Corrected for purity, the (M−nH)n− ion yields were 20.3, 19.0, 20.4, 20.5 and 19.8% for RNAs 7, 8, 11, 12 and 13 (before correction: 21.8, 19.5, 21.7, 17.3 and 19.7%), respectively, which agrees to within <1% with a 1:1:1:1:1 stoichiometry in solution. Correspondingly larger differences in (M−nH)n− ion yield were observed for 1:1 mixtures (RNAs 7 and 11), ∼4% with 30 mM piperidine and 30 mM imidazole or 20 mM ammonium acetate as additive, but only <1.5% with 30 mM piperidine as additive (Supplementary Table S1).
Figure 2.
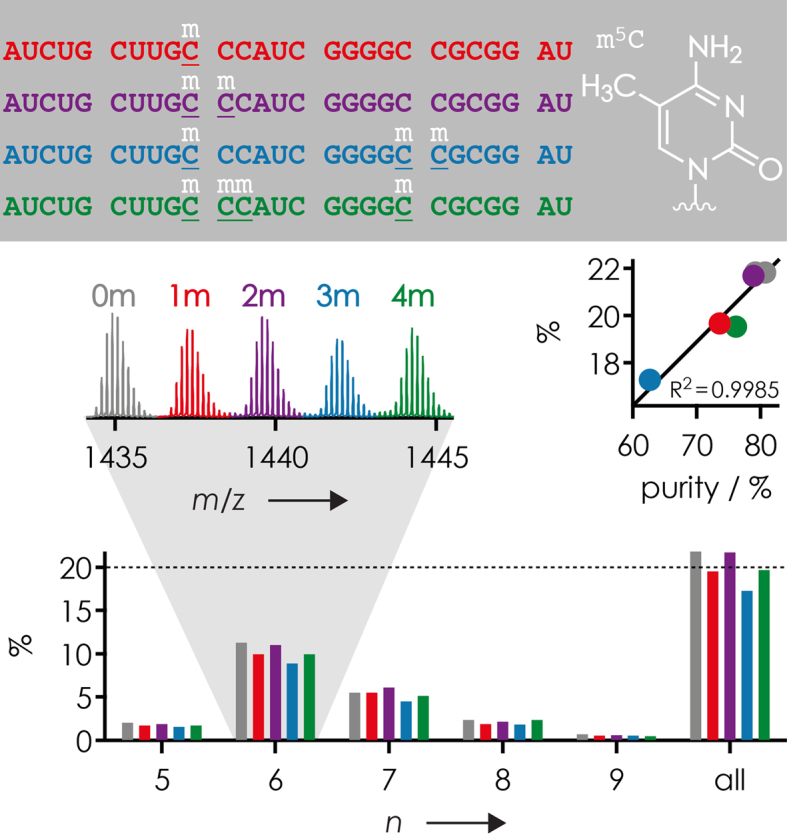
Yield of (M−nH)n− ions from ESI of a 1:1:1:1:1 mixture of 27 nt RNAs 7, 8, 11, 12 and 13 (0.5 μM each in 1:1 H2O/CH3OH with 30 mM piperidine and 30 mM imidazole as additives) versus charge, left inset illustrates region of the corresponding mass spectrum with isotopic profiles of (M−6H)6− ions, right inset shows a linear correlation of yield with sample purity. Color coding refers to the number of m5C residues: gray for 0 (RNA 7), red for 1 (RNA 8), violet for 2 (RNA 11), blue for 3 (RNA 12), and green for 4 (RNA 13).
To investigate any possible effects of ESI additive on the yield of (M−nH)n− ions of RNA forms with differing extent of methylation more systematically, we studied 1:1:1 mixtures of the 15 nt RNAs 1, 2 and 3 with 0, 2 and 4 m5U residues, respectively. A statistical analysis of ∼50 spectra from ESI of separately prepared solutions of 1:1:1 mixtures of RNAs 1, 2 and 3 revealed that RNA concentration rather than the additive used can cause differences in (M−nH)n− ion yield of different RNA forms. More specifically, the deviation of (M−nH)n− ion yields of RNAs 1, 2 and 3 from those expected for the 1:1:1 stoichiometry in solution and in the absence of any effects of methylation on ESI (i.e. 33.3%:33.3%:33.3%) consistently increased with increasing RNA concentration, but without any correlation between (M−nH)n− ion yields and the extent of methylation (Figure 3). Moreover, no correlation was found between average charge (piperidine: 4.03, 4.03 and 4.04 for 0, 2 and 4 m5U residues, respectively; piperidine/imidazole: 4.73, 4.73 and 4.73 for 0, 2 and 4 m5U residues, respectively; ammonium acetate: 6.85, 6.81 and 6.78 for 0, 2 and 4 m5U residues, respectively) and the extent of methylation. This suggests that RNA forms 1, 2 and 3 have different propensity for dimer (or multimer) formation in solution, and/or for any concentration-dependent behavior in the ESI droplets, that in turn affect ion formation by ESI, but again without any correlation between (M−nH)n− ion yields and the extent of methylation. In further support of this hypothesis, the stoichiometry of RNA forms in solution was generally more accurately reflected (e.g. at a total RNA concentration of 0.75 μM, 32.1, 34.2 and 33.7% for RNAs 1, 2 and 3, respectively) in spectra from ESI of RNA solutions with a ∼10-fold molar excess of polyethylene glycol 1000 that was found to destabilize RNA structure (75). The first major conclusion from the ESI studies is that m6A (Figure 1), m5C (Figure 2) and m5U (Figure 3) have no systematic effect on RNA (M−nH)n− ion yields, but nonsystematic, RNA concentration-dependent effects of methylation on (M−nH)n− ion yields were observed for forms 1, 2 and 3. Further studies are needed to clarify whether these originate from RNA aggregation in solution and/or from RNA (M−nH)n− ion formation by ESI, the mechanism of which is only poorly understood (74). Even so, any effects of methylation were relatively small, on the order of ±3% for 1:1:1 mixtures.
Figure 3.
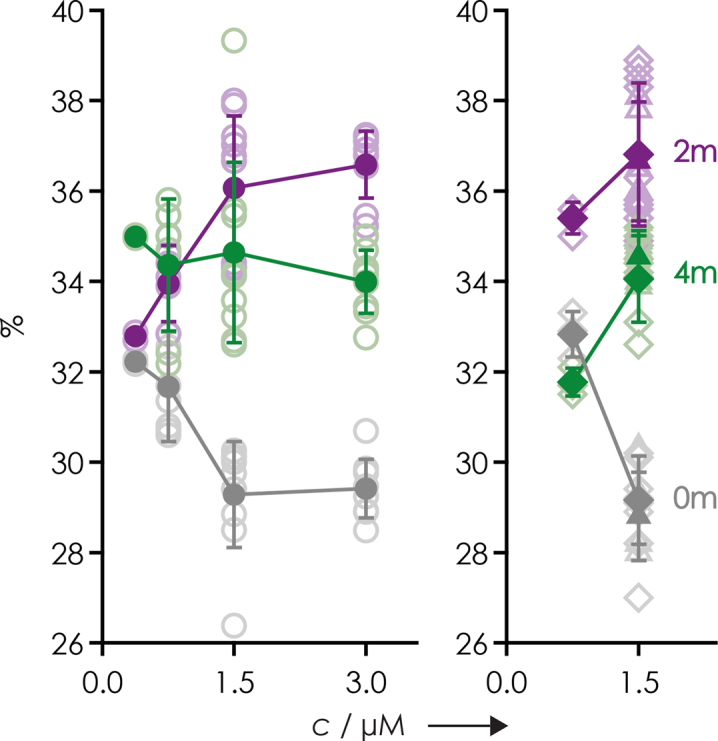
Yield of (M−nH)n− ions from ESI of 1:1:1 mixtures of 15 nt RNAs 1, 2 and 3 in 1:1 H2O/CH3OH versus total RNA concentration with 20 mM piperidine (circles), 20 mM piperidine and 20 mM imidazole (diamonds), or 20 mM ammonium acetate (triangles) as additive. Open symbols represent data from individual spectra and filled symbols show average values with standard deviations as error bars. Color coding refers to the number of m5U residues: gray for 0 (RNA 1), violet for 2 (RNA 2) and green for 4 (RNA 3).
Nevertheless, single-stage mass spectrometry as shown in Figures 1 and 2 does not provide any information about the sites or the site-specific extent of methylation. For this, a second stage of mass spectrometry is required in which the ions of interest are isolated and dissociated. As illustrated here in Figure 1 and shown in previous studies (51,74), different ESI additives can be used to produce (M−nH)n− ions with either low, intermediate or high net charge. CAD of RNA produces primarily c and y ions from phosphodiester backbone bond cleavage (Scheme 2) when (M−nH)n− ion net charge is low, ∼0.2 charges/nt, whereas EDD into d and w ions is most efficient when the net negative charge is high, ∼0.5 charges/nt (51,53,67). The fragment ions from CAD and EDD were previously shown to provide complementary information for de novo sequencing of highly modified RNA (51,76). In the following, we will first discuss the use of CAD for the localization and relative quantitation of RNA methylations.
CAD of (M−nH)n− ions of methylated RNA
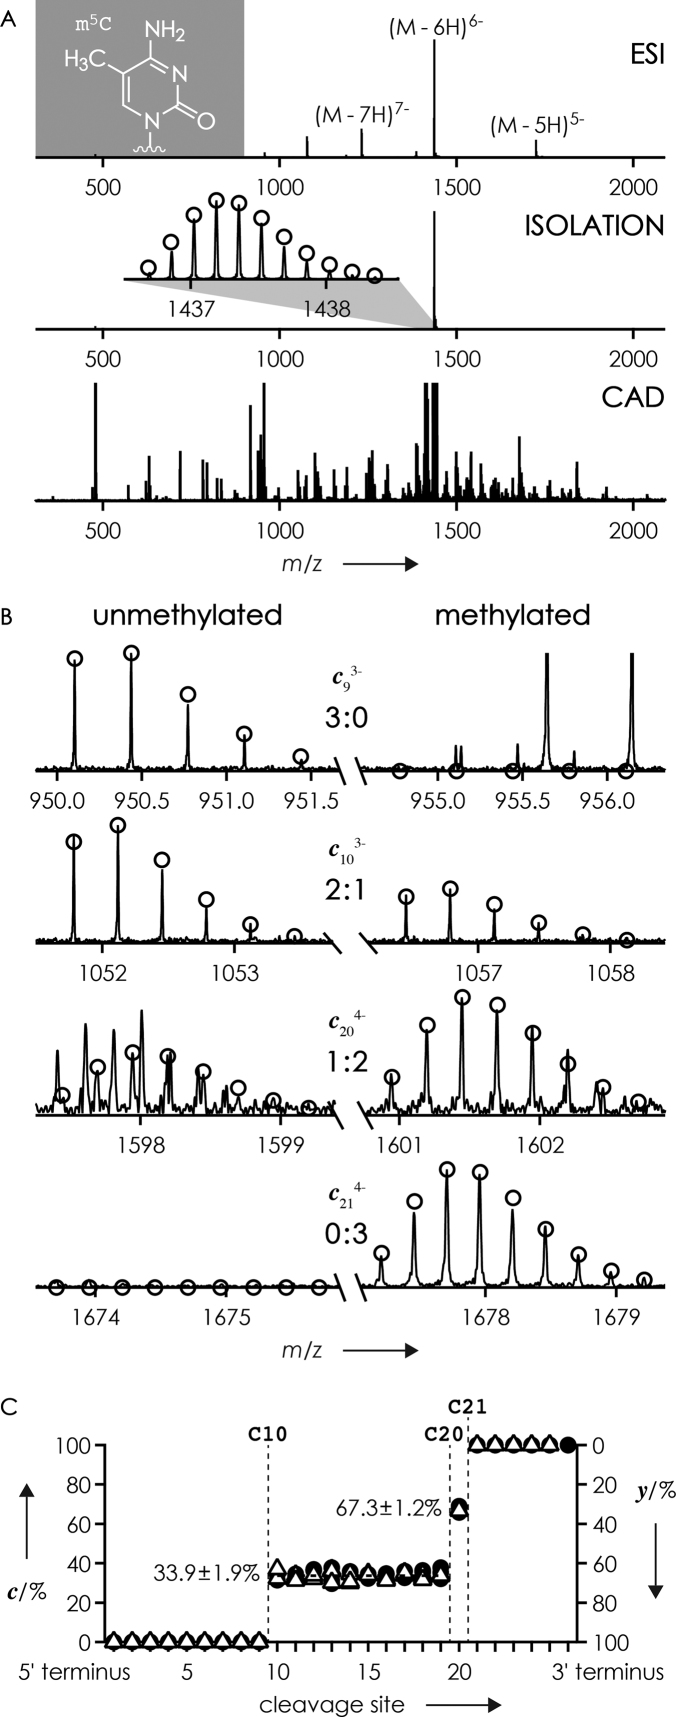
For the characterization of RNA isomers, we studied equimolar mixtures of RNAs 8–10, 18–20 and 4, 16 and 17. Figure 4A shows mass spectra from ESI, isolation, and CAD of the (M−6H)6− ions of the isomeric 27 nt RNAs 8–10 (m5C) whose sequence corresponds to the spanning repeat 8 of XIST RNA that was recently identified as an in vivo target for site-specific 5-methylation of cytosines 10, 20 and 21 (19). Consistent with previous studies (51,53,67,77), CAD of the (M−6H)6− ions (0.22 charges/nt) produced predominantly c and y fragments from phosphodiester backbone cleavage (>92% out of all fragments from backbone cleavage in the CAD spectrum in Figure 4A, see Supplementary Table S2) that were analyzed to reveal the sites and site-specific extent of methylation. For each cleavage site, the fraction of methylated fragments was calculated from relative abundances of c and y fragments with and without methylation, respectively (Figure 4B and C). Because dissociation into a and w fragments (Scheme 2) was only a minor channel (<8%), the corresponding signals were generally too small or even missing, and could therefore not be used for this purpose (Supplementary Table S2). Only unmethylated c and methylated y fragments were detected for sites 1–9, indicating that residues 1–9 are unmethylated. The stepwise increase in the fraction of methylated fragments at cleavage sites 10, 20 and 21 by 33.9, 33.4 and 32.7%, respectively, is consistent with methylation of residues 10, 20 and 21, and quantitatively agrees to within <1% with the 1:1:1 stoichiometry of RNAs 8–10 in the mixture. Apparently, 5-methylation of cytosine does not appreciably affect phosphodiester backbone cleavage into c and y fragments, regardless of the energy used for CAD (Figure 4C) and the position of m5C within the sequence; similar data were obtained for isomeric mixtures of RNAs 18–20 (m5C, Supplementary Table S3) and 4, 16 and 17 (m6A, Supplementary Table S4).
Figure 4.
(A) top-down MS (ESI, ion isolation, and CAD) of a 1:1:1 mixture of isomeric 27 nt RNAs 8, 9 and 10 with m5C at sites 10, 20 and 21, respectively (0.5 μM each in 1:1 H2O/CH3OH with 30 mM piperidine and 30 mM imidazole), (B) MS signals of unmethylated (left) and singly methylated (right) c9, c10, c20 and c21 fragments from CAD of (M−6H)6− ions at 96 eV laboratory frame energy, (C) fraction of methylated c (circles, left axis) and methylated y (triangles, right axis) fragments from CAD at 96, 102 and 108 eV versus cleavage site.
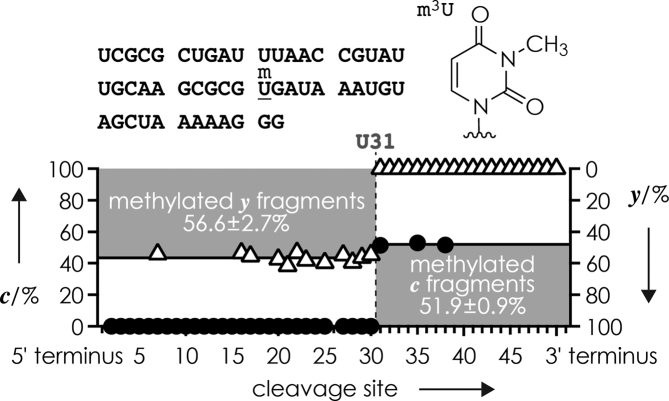
The characterization of mixtures of different forms of methylated RNA by top-down MS is conceptually different from that of mixtures of different isomers. First, ESI MS immediately reveals the presence of different forms (Figures 1 and 2) but not isomers (Figure 4A) of methylated RNA. Second, because the total number of methylations is the same for isomers (Scheme 3A), the fraction of methylated c and methylated y fragments from dissociation of mixtures of RNA isomers add up to 100% at each cleavage site such that data points fall on top of each other when fractions of methylated c and methylated y fragments are plotted with reversed ordinate axes (Figure 4C; in an alternative but equal representation, data points fall on top of each other when fractions of methylated c and unmethylated y fragments are plotted on the same ordinate axis), but this is not the case for mixtures of RNA forms. As illustrated in Figure 5 for CAD of a simple 1:1 mixture of the two 52 nt RNA forms 14 and 15 that differ only by methylation at site 31 (m3U), the fraction of methylated y fragments increases from 0% at cleavage sites 31–50 (y1 was not detected) to an average value of 56.6 ± 2.7% at sites 7, 16, 17, 20–23, 25 and 27–30; the 6.6% deviation from the theoretical value, 50%, can be attributed to differences in sample purity. The corresponding fractions of methylated c fragments were 0% at cleavage sites up to 30, and 51.3, 52.9 and 51.6% at sites 31, 35 and 38, respectively, and do not fall on top of the fractions of methylated y fragments when plotted with reversed ordinate axes (Figure 5). Values for most of the fragments larger than ∼35 nt could not be determined because larger fragments have a higher probability to undergo secondary dissociation (53,67), nevertheless, the data from a single CAD spectrum revealed both the site of methylation and the stoichiometry of the two 52 nt RNA forms in the mixture.
Figure 5.
Fraction of methylated c (circles, left axis) and y (triangles, right axis) fragments from CAD (175.5 eV laboratory frame energy) of (M−13H)13− ions from ESI of a ∼1:1 mixture of 52 nt RNA forms 14 and 15 (1 μM each in 1:1 H2O/CH3OH with 100 mM piperidine and 100 mM imidazole) versus cleavage site; dashed line indicates m3U at site 31 of RNA 15.
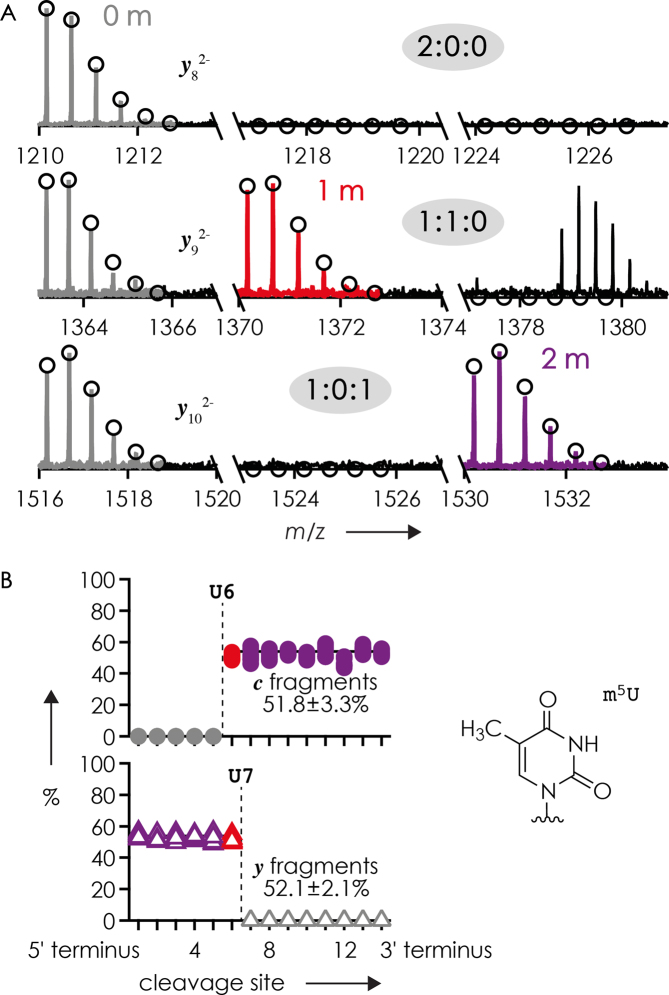
Visualization of methylation sites and site-specific fractions of methylated c and y fragments such as in Figures 4C and 5 is less straightforward for mixtures of RNA isomers with more than one methylation and RNA forms that differ by more than one methylation because the fraction of methylated fragments is no longer directly correlated with the number of methylations of a fragment. For example, CAD of a 1:1 mixture of RNAs 1 (unmethylated) and 2 (m5U at both sites 6 and 7) produced only unmethylated y2–y8 fragments (y1 was not detected), ∼50% each of unmethylated and singly methylated y9, and ∼50% each of unmethylated and doubly methylated y10–y14 fragments (Figure 6A, see the above discussion on ESI for deviations from the theoretical values of 50%). A plot of the fraction of methylated c fragments shows a transition at cleavage site 6, whereas that of methylated y fragments shows a transition at site 7 (Figure 6B), consistent with m5U at sites 6 and 7.
Figure 6.
(A) Unmethylated (left), singly methylated (middle), and doubly methylated (right) y8, y9 and y10 fragments (color coding as in Figure 2) and (B) fraction of methylated c (top) and y (bottom) fragments from CAD (48, 50, 52 or 54 eV laboratory frame energy) of (M−4H)4− ions from ESI of a 1:1 mixture of 15 nt RNA forms 1 and 2 (from 10 measurements, 0.25, 0.5 or 1 μM of each RNA form in 1:1 H2O/CH3OH with 20 mM piperidine and 20 mM imidazole or 20 mM ammonium acetate) versus cleavage site; dashed lines indicate m5U at sites 6 and 7 of RNA 2.
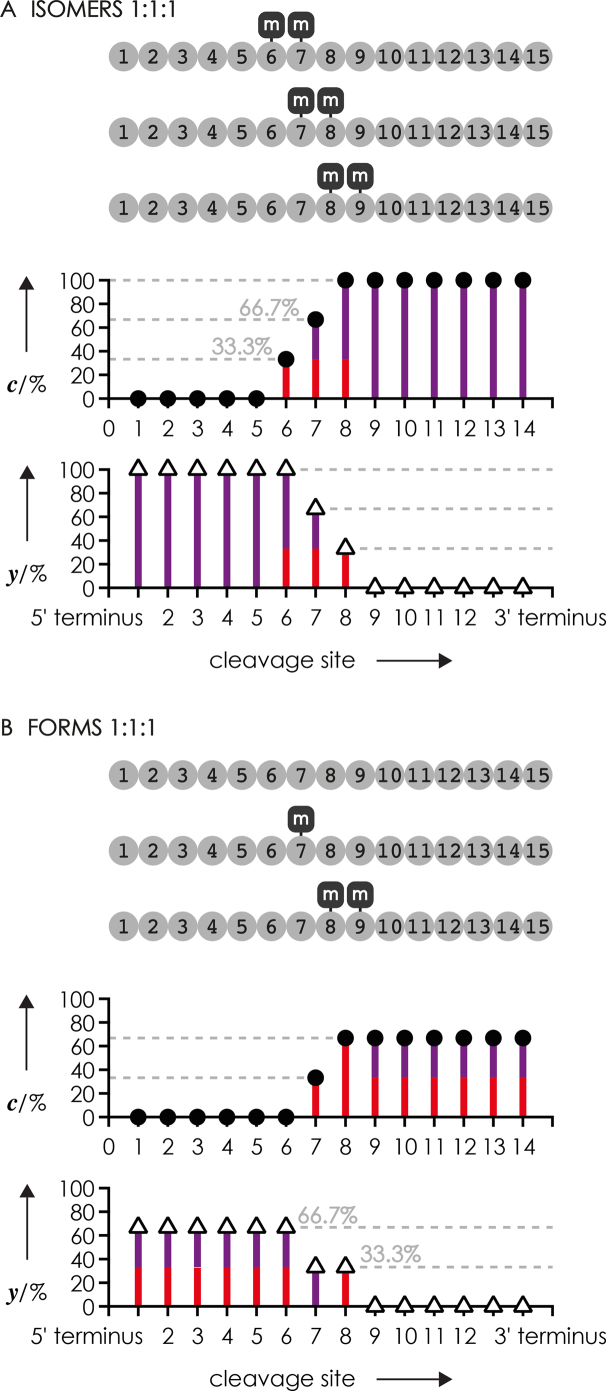
More generally, Scheme 4 illustrates theoretical fractions of methylated c and y fragments from CAD of hypothetical 1:1:1 mixtures of RNA isomers with more than one methylation and RNA forms that differ by more than one methylation. The fraction of methylated fragments from CAD of the hypothetical mixture of isomers in Scheme 4A shows two increases by 33.3%, similar to that in Figure 4C, even though the number of methylations in the hypothetical mixture is twice as high as that in Figure 4C. The difference between these two isomer mixtures is the number of methylations of each fragment that is the same for c or y fragments from a given cleavage site in Figure 4C but varies for the hypothetical 1:1:1 mixtures of RNA isomers with more than one methylation at sites 6, 7 and 8 (Scheme 4A). For RNA forms that differ by more than one methylation, the methylation pattern of fragment ions is even more complex as illustrated in Scheme 4B; for example, the 33.3% y fragments from cleavage at site 7 all carry two methylations whereas half of the 66.7% from cleavage at site 6 carry two methylations and the other half carries only one methylation.
Scheme 4.
Theoretical fractions of methylated c (circles) and y (triangles) fragments from CAD of hypothetical 1:1:1 mixtures of RNA (A) isomers with two methylations and (B) forms with 0, 1 and 2 methylations; the number of methylations of fragments in each fraction is illustrated as color coded bars (red for 1 and violet for 2 methylations).
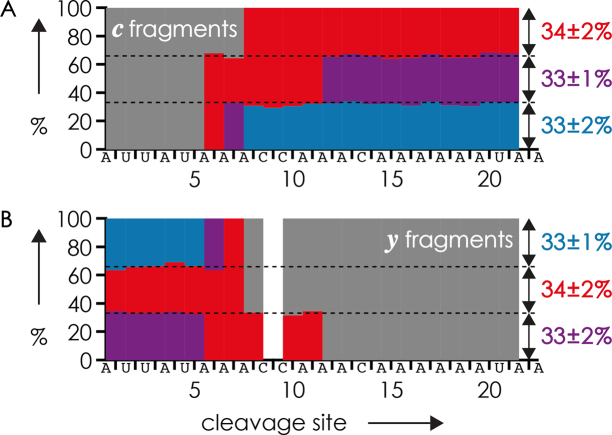
Apparently, for more complex mixtures of RNA isomers and forms, simply plotting the fraction of methylated fragments (Figures 4C, 5 and 6B) does not adequately illustrate the complexity of methylation patterns. Although Scheme 4 accounts for the fraction of methylated fragments, and its color coding for the number of methylations of the fragments, the methylation patterns of individual isomers or forms are still not obvious. A more comprehensive way of representing the MS data from dissociation of different isomers or forms of methylated RNA that immediately reveals individual methylation patterns are plots with colored blocks that represent fractions of unmethylated and methylated fragments, as illustrated in Figure 7 for a 1:1:1 mixture of the 23 nt RNA forms 4–6.
Figure 7.
Fractions of (A) c and B) y fragments from CAD (average from three measurements at 75, 77.5 and 80 eV laboratory frame energy, which showed no significant effect on relative fragment abundances) of (M−5H)5− ions from ESI of a 1:1:1 mixture of the 23 nt RNA forms 4, 5 and 6 (1 μM each in 1:1 H2O/CH3OH with 20 mM CH3COONH4 as additive, Figure 1C) with 1, 2 and 3 m6A residues, respectively, versus cleavage site; color coding indicates the number of methylations of a fragment: gray = 0, red = 1, violet = 2, blue = 3.
In Figure 7, the colored blocks were arranged such that the following criteria were fulfilled: (i) in each horizontal series, the number of methylations can only increase but not decrease with increasing size of the fragments (i.e. from left to right for c fragments, and from right to left for y fragments); (ii) the number of color transitions in each horizontal series must correspond to the total number of methylations of a form (for multiply methylated residues, this criterion is not applicable); (iii) patterns for c and y fragments must be consistent with each other regarding the sites and numbers of methylation; (iv) the total number of methylations of each form, indicated by the color on the 3΄ terminus (right) for c ions and the 5΄ terminus (left) for y ions in each horizontal series, must account for the total number of methylations in the ESI spectrum (Figure 1). The same criteria can be used for mixtures of isomers with adaption of (iv) to a fixed total number of methylations.
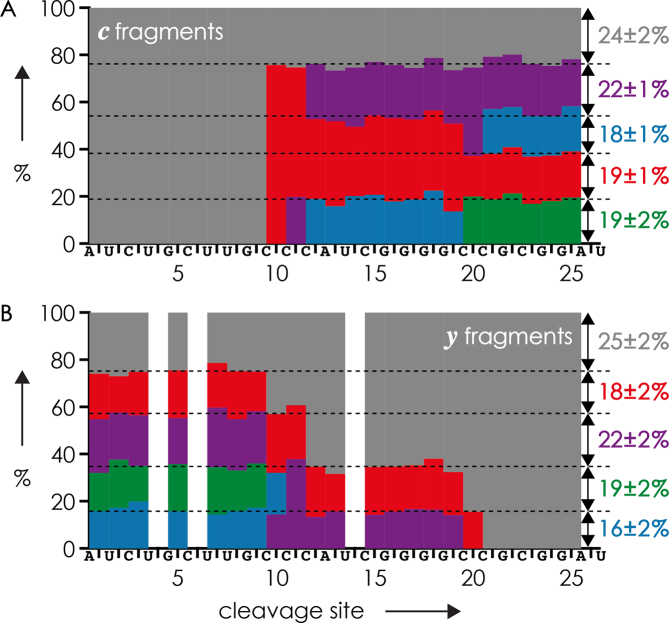
To test our approach for an even more complex mixture, we studied the 27 nt RNAs 7, 8, 11, 12 and 13 forms with 0 to 4 m5C residues by CAD (Figure 2). In treating the methylation pattern as unknown, site-specific fractions of c and y fragments were color coded according to the number of methylations and arranged by taking into account the above criteria. For the unmethylated form, gray blocks corresponding to unmethylated c and y fragments were horizontally arranged in the top rows of Figures 8 A and B, respectively. Because this left no gray blocks representing c fragments from cleavage at sites >10 and y fragments from cleavage at sites <10, the form with one methylation could be identified. Further, only one arrangement was possible for the colored blocks representing c fragments of the form with four methylations (color transitions from gray to red to violet to blue to green); blocks for y fragments were arranged accordingly. This left two possibilities for arranging the blocks representing c fragments of the forms with two and three methylations, but only one of them was consistent with arranging the blocks for y fragments according to the above criteria (Figure 8). Within error limits, fractions of the five different forms of RNAs 7, 8, 11, 12 and 13 calculated from the CAD data in Figure 8 showed good agreement with uncorrected (M−nH)n− ion yields from ESI (Figure 2) and (M−6H)6− ion yields after isolation (Table 3). Notably, our top-down MS approach revealed the correct methylation patterns of all five RNA forms in a mixture, which would not have been possible by bottom-up MS as correlations between modifications are generally lost after digestion (43).
Figure 8.
Fractions of (A) c and (B) y fragments from CAD of (M−6H)6− ions of a 1:1:1:1:1 mixture of five 27 nt RNAs 7, 8, 11, 12 and 13 with 0, 1, 2, 3 and 4 m5C residues, respectively, electrosprayed from 2.5 μM (total RNA concentration) solutions in 1:1 H2O/CH3OH with 30 mM piperidine and 30 mM imidazole as additives; color coding indicates the number of methylations of a fragment: gray = 0, red = 1, violet = 2, blue = 3, green = 4.
Table 3. Yield of 27 nt RNA forms from ESI, isolation and CAD of (M−6H)6− ions.
| RNA | # of m5C residues | (M−nH)n−/ESI [%] | (M−6H)6−/isolation [%] | [%] c | [%] y | [%] c and y |
|---|---|---|---|---|---|---|
| 7 | 0 | 21.8 | 22.6 | 23.9 ± 2.0 | 24.8 ± 1.7 | 24.2 ± 2.0 |
| 8 | 1 | 19.5 | 19.5 | 19.1 ± 1.0 | 18.5 ± 1.8 | 18.8 ± 1.5 |
| 11 | 2 | 21.7 | 21.8 | 22.3 ± 1.2 | 22.3 ± 1.9 | 22.3 ± 1.5 |
| 12 | 3 | 17.3 | 17.2 | 17.8 ± 1.2 | 15.8 ± 1.5 | 16.2 ± 1.7 |
| 13 | 4 | 19.7 | 18.9 | 18.9 ± 2.2 | 18.7 ± 2.0 | 18.8 ± 2.1 |
To minimize nucleobase losses and the formation of internal fragments from secondary dissociation (53,67), both of which are detrimental to the identification, localization and relative quantitation of RNA modifications by top-down MS, and to suppress undesired RNA backbone cleavage into a and w fragments (a fragments frequently show extensive nucleobase loss) (67,77), low-energy CAD of (M−nH)n− ions with low (0.22–0.27) net charge per nucleotide was used in the experiments reported so far. For 1:1:1 mixtures of the 15 nt RNA forms 1, 2 and 3, we evaluated the range of (M−nH)n− ion charge density (for n = 4–7, corresponding to 0.27–0.47 charges per nt) suitable for relative quantitation by c and y fragments from CAD. As illustrated in Supplementary Figure S1, the most accurate quantitation data and the highest sequence coverage from c and y fragments were obtained for n = 4 and 5, corresponding to 0.27 and 0.33 charges/nt. Higher charge densities led to significantly decreased signals of c and y fragments as a result of competitive backbone cleavage into a and w fragments, and correspondingly larger errors in the fractions of RNAs 1, 2 and 3 that were calculated from c and y fragment yields (Supplementary Figure S1).
Importantly, all CAD data from this study show that RNA phosphodiester backbone cleavage of (M−nH)n− ions into c and y fragments is not significantly affected by the presence of m6A, m5C, m3U and m5U residues unless (M−nH)n− ion charge is high (≥0.4 charges/nt). By contrast, preliminary data that will be published in a separate article suggest that methylation of the exocyclic amino group of guanosine substantially affects the yield of fragments from phosphodiester backbone cleavage. Low-energy CAD produces highly reproducible spectra provided that the energy available for dissociation is kept the same. However, as we have discussed in reference (67), the total energy available for dissociation is often unknown. We have suggested to instead consider the extent of molecular ion dissociation as a possible way of standardizing spectra obtained on different instruments (67). As shown here and in previous studies (51–53,65,67), undesired base loss, secondary fragmentation, and dissociation into a and w instead of c and y fragments can be minimized by use of energies that produce <40% dissociation of RNA (M−nH)n− ions with low net charge. Thus any mass spectrometer equipped for low-energy CAD experiments can in principle be used for label-free, direct localization and relative quantitation of the RNA nucleobase methylations m6A, m5C, m3U and m5U by top-down MS.
EDD of (M−nH)n− ions of methylated RNA
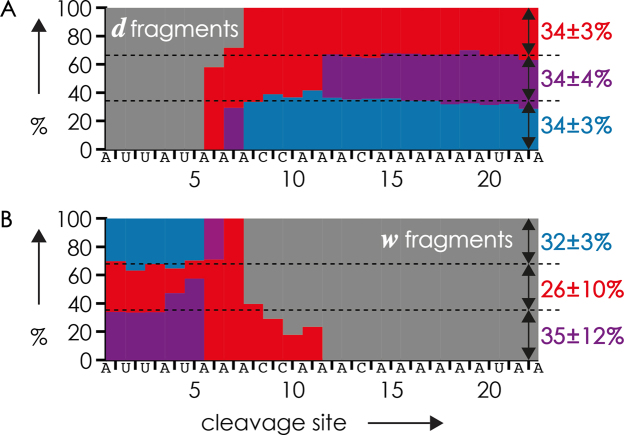
Finally, we have explored the potential of EDD for the relative quantitation of RNA methylations. A comparison of Figure 9, which shows fractions of d and w fragments (Scheme 2) from EDD of (M−12H)12− ions from a 1:1:1 mixture of the 23 nt RNA forms 4, 5 and 6 with 1, 2 and 3 m6A residues, respectively, with the CAD data of the same RNA mixture in Figure 7 immediately reveals that EDD provides less accurate data for the relative quantitation of RNA methylations than CAD. Apparently, methylation of the exocyclic amino group of adenosine strongly affects RNA dissociation into d and w fragments as their yields differ substantially, by up to 24% (Supplementary Figure S2), from theoretical values (33.3 or 66.7%) at cleavage sites next to the m6A residues at positions 6, 7, 8 and 12. Similar effects were observed with EDD of (M−7H)7− and (M−8H)8− ions from a 1:1:1 mixture of the 15 nt RNA forms 1, 2 and 3 with 0, 2 and 4 m5U residues, respectively (Supplementary Figure S3). Based on our recently proposed mechanism of RNA backbone cleavage into d and w fragments (53), we suggest two possible reasons for the nonstoichiometric yields of fragments from cleavage next to methylated residues. First, methylation can alter the nucleobase ionization energy, which is critical to the first step of the EDD process, i.e. electron detachment from the nucleobase. Second, nucleobase methylation can affect the stability of the intermediates involved in the dissociation reaction, which in turn determines the yield of d and w fragments. Nucleobase methylation can also affect glycosidic bond stability, but our data show that any resulting differences in nucleobase losses or backbone cleavage do not significantly affect relative quantitation by CAD, and equally small effects can be anticipated for EDD. Although EDD is less useful for relative quantitation than CAD, it can be used for the identification and localization of methylations and, in combination with CAD, for de novo sequencing of methylated RNA (51).
Figure 9.
Fractions of (A) d and (B) w fragments from EDD (26 eV electron energy) of (M−12H)12− ions from ESI (0.5 μM each in 1:1 H2O/CH3OH with 25 mM piperidine as additive, Figure 1A) of a 1:1:1 mixture of the 23 nt RNA forms 4, 5 and 6 with 1, 2 and 3 m6A residues, respectively, versus cleavage site; color coding indicates the number of methylations of a fragment: gray = 0, red = 1, purple = 2, blue = 3.
In summary, our comprehensive study demonstrates the unique potential of top-down mass spectrometry for the identification, localization, and relative quantitation of nucleobase methylations of ribonucleic acids without the need for chemical derivatization. We show that m6A, m5C, m3U and m5U nucleobase methylations have little effect on the yield of (M−nH)n− ions from ESI of denaturing solutions at low RNA concentrations, and no appreciable effect on phosphodiester backbone cleavage into c and y fragments by CAD, provided that (M−nH)n− ion net charge is low, up to ∼0.33 charges/nt. However, these nucleobase methylations substantially affect backbone cleavage into d and w fragments by EDD. Thus, for the relative quantitation of RNA isomers and forms, CAD is the method of choice, but both CAD and EDD provide extensive sequence information and can be used for the identification and localization of methylated residues, and can be combined for de novo sequencing of methylated RNA.
Supplementary Material
ACKNOWLEDGEMENTS
The authors thank Eva-Maria Schneeberger, Jovana Vusurovic and Matthias Halper for discussion, BioSpring GmbH (Frankfurt am Main, Germany) for providing RNA 2, Matthias Erlacher for providing RNAs 4–6 and 16–20 (from Dharmacon GE Healthcare, USA) and Veronika Schwarz for synthesis of RNAs 14 and 15.
SUPPLEMENTARY DATA
Supplementary Data are available at NAR Online.
FUNDING
Austrian Science Fund (FWF) [P27347 to K.B., P27947 to R.M.]; FFG [8005714]; University of Innsbruck [‘Doktoratsstipendium NEU aus der Nachwuchsförderung der LFU’ to H.G.]. Funding for open access charge: FWF.
Conflict of interest statement. None declared.
REFERENCES
- 1. Machnicka M.A., Milanowska K., Osman Oglou O., Purta E., Kurkowska M., Olchowik A., Januszewski W., Kalinowski S., Dunin-Horkawicz S., Rother K.M. et al. MODOMICS: a database of RNA modification pathways-2013 update. Nucleic Acids Res. 2013; 41:D262–D267. [DOI] [PMC free article] [PubMed] [Google Scholar]
- 2. Cantara W.A., Crain P.F., Rozenski J., McCloskey J.A., Harris K.A., Zhang X.N., Vendeix F.A.P., Fabris D., Agris P.F.. The RNA modification database, RNAMDB: 2011 update. Nucleic Acids Res. 2011; 39:D195–D201. [DOI] [PMC free article] [PubMed] [Google Scholar]
- 3. Kellner S., Seidu-Larry S., Burhenne J., Motorin Y., Helm M.. A multifunctional bioconjugate module for versatile photoaffinity labeling and click chemistry of RNA. Nucleic Acids Res. 2011; 39:7348–7360. [DOI] [PMC free article] [PubMed] [Google Scholar]
- 4. Carell T., Brandmayr C., Hienzsch A., Müller M., Pearson D., Reiter V., Thoma I., Thumbs P., Wagner M.. Structure and function of noncanonical nucleobases. Angew. Chem. Int. Ed. 2012; 51:7110–7131. [DOI] [PubMed] [Google Scholar]
- 5. Wang X., He C.. Dynamic RNA modifications in posttranscriptional regulation. Mol. Cell. 2014; 56:5–12. [DOI] [PMC free article] [PubMed] [Google Scholar]
- 6. Gilbert W.V., Bell T.A., Schaening C.. Messenger RNA modifications: form, distribution, and function. Science. 2016; 352:1408–1412. [DOI] [PMC free article] [PubMed] [Google Scholar]
- 7. Meyer K.D., Saletore Y., Zumbo P., Elemento O., Mason C.E., Jaffrey S.R.. Comprehensive analysis of mRNA methylation reveals enrichment in 3΄ UTRs and near stop codons. Cell. 2012; 149:1635–1646. [DOI] [PMC free article] [PubMed] [Google Scholar]
- 8. Dominissini D., Moshitch-Moshkovitz S., Schwartz S., Salmon-Divon M., Ungar L., Osenberg S., Cesarkas K., Jacob-Hirsch J., Amariglio N., Kupiec M. et al. Topology of the human and mouse m6A RNA methylomes revealed by m6A-seq. Nature. 2012; 485:201–206. [DOI] [PubMed] [Google Scholar]
- 9. Squires J.E., Patel H.R., Nousch M., Sibbritt T., Humphreys D.T., Parker B.J., Suter C.M., Preiss T.. Widespread occurrence of 5-methylcytosine in human coding and non-coding RNA. Nucleic Acids Res. 2012; 40:5023–5033. [DOI] [PMC free article] [PubMed] [Google Scholar]
- 10. Khoddami V., Cairns B.R.. Identification of direct targets and modified bases of RNA cytosine methyltransferases. Nat. Biotechnol. 2013; 31:458–464. [DOI] [PMC free article] [PubMed] [Google Scholar]
- 11. Dominissini D., Nachtergaele S., Moshitch-Moshkovitz S., Peer E., Kol N., Ben-Haim M.S., Dai Q., Di Segni A., Salmon-Divon M., Clark W.C. et al. The dynamic N (1)-methyladenosine methylome in eukaryotic messenger RNA. Nature. 2016; 530:441–446. [DOI] [PMC free article] [PubMed] [Google Scholar]
- 12. Li X., Xiong X., Wang K., Wang L., Shu X., Ma S., Yi C.. Transcriptome-wide mapping reveals reversible and dynamic N (1)-methyladenosine methylome. Nat. Chem. Biol. 2016; 12:311–316. [DOI] [PubMed] [Google Scholar]
- 13. Li S., Mason C.E.. The pivotal regulatory landscape of RNA modifications. Annu. Rev. Genomics Hum. Genet. 2014; 15:127–150. [DOI] [PubMed] [Google Scholar]
- 14. Sarin L.P., Leidel S.A.. Modify or die? RNA modification defects in metazoans. RNA Biol. 2014; 11:1555–1567. [DOI] [PMC free article] [PubMed] [Google Scholar]
- 15. Klungland A., Dahl J.A.. Dynamic RNA modifications in disease. Curr. Opin. Genet. Dev. 2014; 26:47–52. [DOI] [PubMed] [Google Scholar]
- 16. Lichinchi G., Gao S., Saletore Y., Gonzalez G.M., Bansal V., Wang Y., Mason C.E., Rana T.M.. Dynamics of the human and viral m (6)A RNA methylomes during HIV-1 infection of T cells. Nat. Microbiol. 2016; 1:16011. [DOI] [PMC free article] [PubMed] [Google Scholar]
- 17. Eddy S.R. Non-coding RNA genes and the modern RNA world. Nat. Rev. Genet. 2001; 2:919–929. [DOI] [PubMed] [Google Scholar]
- 18. Helm M., Alfonzo J.D.. Posttranscriptional RNA modifications: playing metabolic games in a cell's chemical Legoland. Chem. Biol. 2014; 21:174–185. [DOI] [PMC free article] [PubMed] [Google Scholar]
- 19. Amort T., Souliere M.F., Wille A., Jia X.Y., Fiegl H., Worle H., Micura R., Lusser A.. Long non-coding RNAs as targets for cytosine methylation. RNA Biol. 2013; 10:1003–1009. [DOI] [PMC free article] [PubMed] [Google Scholar]
- 20. Limbach P.A., Paulines M.J.. Going global: the new era of mapping modifications in RNA. Wiley Interdiscip. Rev. RNA. 2017; 8. [DOI] [PMC free article] [PubMed] [Google Scholar]
- 21. Helm M., Motorin Y.. Detecting RNA modifications in the epitranscriptome: predict and validate. Nat. Rev. Genet. 2017; 18:275–291. [DOI] [PubMed] [Google Scholar]
- 22. Domon B., Aebersold R.. Mass spectrometry and protein analysis. Science. 2006; 312:212–217. [DOI] [PubMed] [Google Scholar]
- 23. Yates J.R., Ruse C.I., Nakorchevsky A.. Proteomics by mass spectrometry: approaches, advances, and applications. Annu. Rev. Biomed. Eng. 2009; 11:49–79. [DOI] [PubMed] [Google Scholar]
- 24. Bantscheff M., Lemeer S., Savitski M.M., Kuster B.. Quantitative mass spectrometry in proteomics: critical review update from 2007 to the present. Anal. Bioanal. Chem. 2012; 404:939–965. [DOI] [PubMed] [Google Scholar]
- 25. Cox J., Mann M.. Quantitative, high-resolution proteomics for data-driven systems biology. Annu. Rev. Biochem. 2011; 80:273–299. [DOI] [PubMed] [Google Scholar]
- 26. Altelaar A.F., Munoz J., Heck A.J.. Next-generation proteomics: towards an integrative view of proteome dynamics. Nat. Rev. Genet. 2013; 14:35–48. [DOI] [PubMed] [Google Scholar]
- 27. Chapman J.D., Goodlett D.R., Masselon C.D.. Multiplexed and data-independent tandem mass spectrometry for global proteome profiling. Mass Spectrom. Rev. 2014; 33:452–470. [DOI] [PubMed] [Google Scholar]
- 28. Aebersold R., Mann M.. Mass spectrometry-based proteomics. Nature. 2003; 422:198–207. [DOI] [PubMed] [Google Scholar]
- 29. Kelleher N.L., Lin H.Y., Valaskovic G.A., Aaserud D.J., Fridriksson E.K., McLafferty F.W.. Top down versus bottom up protein characterization by tandem high-resolution mass spectrometry. J. Am. Chem. Soc. 1999; 121:806–812. [Google Scholar]
- 30. Kang B.I., Miyauchi K., Matuszewski M., D’Almeida G.S., Rubio M.A., Alfonzo J.D., Inoue K., Sakaguchi Y., Suzuki T., Sochacka E. et al. Identification of 2-methylthio cyclic N6-threonylcarbamoyladenosine (ms2ct6A) as a novel RNA modification at position 37 of tRNAs. Nucleic Acids Res. 2016; 45:2124–2136. [DOI] [PMC free article] [PubMed] [Google Scholar]
- 31. Popova A.M., Williamson J.R.. Quantitative analysis of rRNA modifications using stable isotope labeling and mass spectrometry. J. Am. Chem. Soc. 2014; 136:2058–2069. [DOI] [PMC free article] [PubMed] [Google Scholar]
- 32. Wetzel C., Li S., Limbach P.A.. Metabolic de-isotoping for improved LC-MS characterization of modified RNAs. J. Am. Soc. Mass Spectrom. 2014; 25:1114–1123. [DOI] [PubMed] [Google Scholar]
- 33. Castleberry C.M., Limbach P.A.. Relative quantitation of transfer RNAs using liquid chromatography mass spectrometry and signature digestion products. Nucleic Acids Res. 2010; 38:e162. [DOI] [PMC free article] [PubMed] [Google Scholar]
- 34. Brandmayr C., Wagner M., Bruckl T., Globisch D., Pearson D., Kneuttinger A.C., Reiter V., Hienzsch A., Koch S., Thoma I. et al. Isotope-based analysis of modified tRNA nucleosides correlates modification density with translational efficiency. Angew. Chem. Int. Ed. 2012; 51:11162–11165. [DOI] [PMC free article] [PubMed] [Google Scholar]
- 35. Yan M., Wang Y., Hu Y., Feng Y., Dai C., Wu J., Wu D., Zhang F., Zhai Q.. A high-throughput quantitative approach reveals more small RNA modifications in mouse liver and their correlation with diabetes. Anal. Chem. 2013; 85:12173–12181. [DOI] [PubMed] [Google Scholar]
- 36. Taoka M., Nobe Y., Hori M., Takeuchi A., Masaki S., Yamauchi Y., Nakayama H., Takahashi N., Isobe T.. A mass spectrometry-based method for comprehensive quantitative determination of post-transcriptional RNA modifications: the complete chemical structure of Schizosaccharomyces pombe ribosomal RNAs. Nucleic Acids Res. 2015; 43:e115. [DOI] [PMC free article] [PubMed] [Google Scholar]
- 37. Basanta-Sanchez M., Temple S., Ansari S.A., D’Amico A., Agris P.F.. Attomole quantification and global profile of RNA modifications: Epitranscriptome of human neural stem cells. Nucleic Acids Res. 2016; 44:e26. [DOI] [PMC free article] [PubMed] [Google Scholar]
- 38. Rose R.E., Quinn R., Sayre J.L., Fabris D.. Profiling ribonucleotide modifications at full-transcriptome level: a step toward MS-based epitranscriptomics. RNA. 2015; 21:1361–1374. [DOI] [PMC free article] [PubMed] [Google Scholar]
- 39. Beverly M., Dell A., Parmar P., Houghton L.. Label-free analysis of mRNA capping efficiency using RNase H probes and LC-MS. Anal. Bioanal. Chem. 2016; 408:5021–5030. [DOI] [PubMed] [Google Scholar]
- 40. Addepalli B., Limbach P.A.. Pseudouridine in the anticodon of Escherichia coli tRNATyr(QPsiA) is catalyzed by the dual specificity enzyme RluF. J. Biol. Chem. 2016; 291:22327–22337. [DOI] [PMC free article] [PubMed] [Google Scholar]
- 41. Taoka M., Nobe Y., Yamaki Y., Yamauchi Y., Ishikawa H., Takahashi N., Nakayama H., Isobe T.. The complete chemical structure of Saccharomyces cerevisiae rRNA: partial pseudouridylation of U2345 in 25S rRNA by snoRNA snR9. Nucleic Acids Res. 2016; 44:8951–8961. [DOI] [PMC free article] [PubMed] [Google Scholar]
- 42. Taucher M., Ganisl B., Breuker K.. Identification, localization, and relative quantitation of pseudouridine in RNA by tandem mass spectrometry of hydrolysis products. Int. J. Mass Spectrom. 2011; 304:91–97. [DOI] [PMC free article] [PubMed] [Google Scholar]
- 43. Chait B.T. Mass spectrometry: bottom-up or top-down. Science. 2006; 314:65–66. [DOI] [PubMed] [Google Scholar]
- 44. Cui W.D., Rohrs H.W., Gross M.L.. Top-down mass spectrometry: recent developments, applications and perspectives. Analyst. 2011; 136:3854–3864. [DOI] [PMC free article] [PubMed] [Google Scholar]
- 45. Wu C., Tran J.C., Zamdborg L., Durbin K.R., Li M.X., Ahlf D.R., Early B.P., Thomas P.M., Sweedler J.V., Kelleher N.L.. A protease for ‘middle-down’ proteomics. Nat. Methods. 2012; 9:822–824. [DOI] [PMC free article] [PubMed] [Google Scholar]
- 46. Nakayama H., Yamauchi Y., Taoka M., Isobe T.. Direct identification of human cellular microRNAs by nanoflow liquid chromatography-high-resolution tandem mass spectrometry and database searching. Anal. Chem. 2015; 87:2884–2891. [DOI] [PubMed] [Google Scholar]
- 47. Huang T.Y., Liu J., Liang X.R., Hodges B.D.M., McLuckey S.A.. Collision-induced dissociation of intact duplex and single-stranded siRNA anions. Anal. Chem. 2008; 80:8501–8508. [DOI] [PubMed] [Google Scholar]
- 48. Gao Y., Yang J., Cancilla M.T., Meng F.Y., McLuckey S.A.. Top-down interrogation of chemically modified oligonucleotides by negative electron transfer and collision induced dissociation. Anal. Chem. 2013; 85:4713–4720. [DOI] [PubMed] [Google Scholar]
- 49. Huang T.Y., Liu J.A., McLuckey S.A.. Top-down tandem mass spectrometry of tRNA via ion trap collision-induced dissociation. J. Am. Soc. Mass Spectrom. 2010; 21:890–898. [DOI] [PubMed] [Google Scholar]
- 50. Kellersberger K.A., Yu E., Kruppa G.H., Young M.M., Fabris D.. Top-down characterization of nucleic acids modified by structural probes using high-resolution tandem mass spectrometry and automated data interpretation. Anal. Chem. 2004; 76:2438–2445. [DOI] [PubMed] [Google Scholar]
- 51. Taucher M., Breuker K.. Characterization of modified RNA by top-down mass spectrometry. Angew. Chem. Int. Ed. 2012; 51:11289–11292. [DOI] [PMC free article] [PubMed] [Google Scholar]
- 52. Schneeberger E.M., Breuker K.. Native top-town mass spectrometry of TAR RNA in complexes with a wild-type tat peptide for binding site mapping. Angew. Chem. Int. Ed. 2017; 56:1254–1258. [DOI] [PMC free article] [PubMed] [Google Scholar]
- 53. Taucher M., Breuker K.. Top-down mass spectrometry for sequencing of larger (up to 61 nt) RNA by CAD and EDD. J. Am. Soc. Mass Spectrom. 2010; 21:918–929. [DOI] [PubMed] [Google Scholar]
- 54. Yang J., Hakansson K.. Fragmentation of oligoribonucleotides from gas-phase ion-electron reactions. J. Am. Soc. Mass Spectrom. 2006; 17:1369–1375. [DOI] [PubMed] [Google Scholar]
- 55. Zabrouskov V., Han X.M., Welker E., Zhai H.L., Lin C., van Wijk K.J., Scheraga H.A., McLafferty F.W.. Stepwise deamidation of ribonuclease A at five sites determined by top down mass spectrometry. Biochemistry. 2006; 45:987–992. [DOI] [PMC free article] [PubMed] [Google Scholar]
- 56. Thomas C.E., Kelleher N.L., Mizzen C.A.. Mass spectrometric characterization of human histone H3: A bird's eye view. J. Proteome Res. 2006; 5:240–247. [DOI] [PubMed] [Google Scholar]
- 57. Zheng Y., Fornelli L., Compton P.D., Sharma S., Canterbury J., Mullen C., Zabrouskov V., Fellers R.T., Thomas P.M., Licht J.D. et al. Unabridged analysis of human histone H3 by differential top-down mass spectrometry reveals hypermethylated proteoforms from MMSET/NSD2 overexpression. Mol. Cell. Proteomics. 2016; 15:776–790. [DOI] [PMC free article] [PubMed] [Google Scholar]
- 58. Pesavento J.J., Bullock C.R., Leduc R.D., Mizzen C.A., Kelleher N.L.. Combinatorial modification of human histone H4 quantitated by two-dimensional liquid chromatography coupled with top down mass spectrometry. J. Biol. Chem. 2008; 283:14927–14937. [DOI] [PMC free article] [PubMed] [Google Scholar]
- 59. Peng Y., Chen X., Zhang H., Xu Q., Hacker T.A., Ge Y.. Top-down targeted proteomics for deep sequencing of tropomyosin isoforms. J. Proteome Res. 2013; 12:187–198. [DOI] [PMC free article] [PubMed] [Google Scholar]
- 60. Zabrouskov V., Ge Y., Schwartz J., Walker J.W.. Unraveling molecular complexity of phosphorylated human cardiac Troponin I by top down electron capture dissociation/electron transfer dissociation mass spectrometry. Mol. Cell. Proteomics. 2008; 7:1838–1849. [DOI] [PubMed] [Google Scholar]
- 61. Tromp J.M., Schürch S.. Gas-phase dissociation of oligoribonucleotides and their analogs studied by electrospray ionization tandem mass spectrometry. J. Am. Soc. Mass Spectrom. 2005; 16:1262–1268. [DOI] [PubMed] [Google Scholar]
- 62. Tromp J.M., Schürch S.. Electrospray ionization tandem mass spectrometry of biphenyl-modified oligo(deoxy)ribonucleotides. Rapid Commun. Mass Spectrom. 2006; 20:2348–2354. [DOI] [PubMed] [Google Scholar]
- 63. Schürch S., Bernal-Mendez E., Leumann C.J.. Electrospray tandem mass spectrometry of mixed-sequence RNA/DNA oligonucleotides. J. Am. Soc. Mass Spectrom. 2002; 13:936–945. [DOI] [PubMed] [Google Scholar]
- 64. Andersen T.E., Kirpekar F., Haselmann K.F.. RNA fragmentation in MALDI mass spectrometry studied by H/D-exchange: Mechanisms of general applicability to nucleic acids. J. Am. Soc. Mass Spectrom. 2006; 17:1353–1368. [DOI] [PubMed] [Google Scholar]
- 65. Riml C., Glasner H., Rodgers M.T., Micura R., Breuker K.. On the mechanism of RNA phosphodiester backbone cleavage in the absence of solvent. Nucleic Acids Res. 2015; 43:5171–5181. [DOI] [PMC free article] [PubMed] [Google Scholar]
- 66. McLuckey S.A., Van Berkel G.J., Glish G.L.. Tandem mass-spectrometry of small, multiply charged oligonucleotides. J. Am. Soc. Mass Spectrom. 1992; 3:60–70. [DOI] [PubMed] [Google Scholar]
- 67. Taucher M., Rieder U., Breuker K.. Minimizing base loss and internal fragmentation in collisionally activated dissociation of multiply deprotonated RNA. J. Am. Soc. Mass Spectrom. 2010; 21:278–285. [DOI] [PubMed] [Google Scholar]
- 68. Micura R. Small interfering RNAs and their chemical synthesis. Angew. Chem. Int. Ed. 2002; 41:2265–2269. [DOI] [PubMed] [Google Scholar]
- 69. Pitsch S., Weiss P.A., Jenny L., Stutz A., Wu X.L.. Reliable chemical synthesis of oligoribonucleotides (RNA) with 2΄-O-[(triisopropylsilyl)oxy]methyl (2΄-O-tom)-protected phosphoramidites. Helv. Chim. Acta. 2001; 84:3773–3795. [Google Scholar]
- 70. Smith B.D., Liu J.W.. Assembly of DNA-Functionalized nanoparticles in alcoholic solvents reveals opposite thermodynamic and kinetic trends for DNA hybridization. J. Am. Chem. Soc. 2010; 132:6300–6301. [DOI] [PubMed] [Google Scholar]
- 71. Dave N., Liu J.W.. Fast molecular beacon hybridization in organic solvents with improved target specificity. J. Phys. Chem. B. 2010; 114:15694–15699. [DOI] [PubMed] [Google Scholar]
- 72. Schindler T., Nordmeier E.. Denaturation experiments on calf-thymus DNA/polycation complexes in aqueous/organic solvent mixtures. Polymer. 1999; 40:7019–7027. [Google Scholar]
- 73. Cavaluzzi M.J., Borer P.N.. Revised UV extinction coefficients for nucleoside-5΄-monophosphates and unpaired DNA and RNA. Nucleic Acids Res. 2004; 32:e13. [DOI] [PMC free article] [PubMed] [Google Scholar]
- 74. Ganisl B., Taucher M., Riml C., Breuker K.. Charge as you like! Efficient manipulation of negative ion net charge in electrospray ionization of proteins and nucleic acids. Eur. J. Mass Spectrom. 2011; 17:333–343. [DOI] [PubMed] [Google Scholar]
- 75. Gao M., Gnutt D., Orban A., Appel B., Righetti F., Winter R., Narberhaus F., Müller S., Ebbinghaus S.. RNA hairpin folding in the crowded cell. Angew. Chem. Int. Ed. 2016; 55:3224–3228. [DOI] [PMC free article] [PubMed] [Google Scholar]
- 76. Micura R., Kreutz C., Breuker K.. A personal perspective on chemistry-driven RNA research. Biopolymers. 2013; 99:1114–1123. [DOI] [PMC free article] [PubMed] [Google Scholar]
- 77. Huang T.Y., Kharlamova A., Liu J., McLuckey S.A.. Ion trap collision-induced dissociation of multiply deprotonated RNA: c/y-ions versus (a-B)/w-ions. J. Am. Soc. Mass Spectrom. 2008; 19:1832–1840. [DOI] [PubMed] [Google Scholar]
Associated Data
This section collects any data citations, data availability statements, or supplementary materials included in this article.


