Abstract
Objectives
To examine whether post-chemoradiotherapy (CRT) DCE-MRI can identify rectal cancer patients with pathologic complete response (pCR).
Methods
From a rectal cancer surgery database encompassing 2007–2014, 61 consecutive patients that met the following inclusion criteria were selected for analysis: (1) Stage II/III primary rectal adenocarcinoma; (2) Received CRT (3) Underwent total mesorectal excision surgery (4) Had a diagnostic rectal DCE-MRI on a 1.5 Tesla MRI scanner. Two experienced radiologists, in consensus, drew regions of interest (ROI) on the sagittal DCE MRI image in the tumor bed. These were exported from ImageJ to in-house Matlab code, for kinetic modeling using the Tofts model. Ktrans, Kep, and ve values were compared to pathological response.
Results
Of the 61 initial patients, 37 had data considered adequate for fitting to obtain perfusion parameters. Among thirty-seven patients, 13 males and 24 females, median age 53 yrs., there were 8 pCR (22%). Ktrans could not distinguish patients with pCR. For distinguishing patients with 90% or greater response the mean Ktrans and Kep values were statistically significant (p=0.032 and 0.027 respectively). Using a cutoff value of Ktrans = 0.25 min−1, the sensitivity, specificity, PPV and NPV were: 0.71, 0.78, 0.67, and 0.82 respectively. The AUC was 0.71.
Conclusion
Although perfusion parameters derived from kinetic modeling of DCE-MRI data were unable to identify patients with pCR, Ktrans could be used to identify those with 90% or more response to chemoradiotherapy for rectal cancer with an AUC of 0.7.
Keywords: Rectal cancer, DCE-MRI, Complete response, Chemoradiotherapy, Ktrans
Introduction
DCE-MRI in the investigation of rectal cancer tumor response to neoadjuvant treatment has been reported to have variable usefulness (1–21). Ongoing investigations using 18-F FDG-PET, diffusion-weighted magnetic resonance imaging (DWI-MRI) and magnetization transfer MRI have also been found to be useful (22–25). We have previously reported our results using post-treatment DCE-MRI in a group of patients that underwent a prospective, investigational chemotherapy-only regimen (1) and we wished to expand our investigation to a group of patients undergoing more standard treatment with combined radiotherapy and chemotherapy.
Several groups have investigated the performance of DCE-MRI among rectal cancer patients after neoadjuvant treatment grouping patients into broad-responder/non-responder categories. Others have focused on the pre-treatment prognostic value of DCE-MRI parameters to try to tailor treatment (1, 6, 7, 9, 10, 16, 18), and yet others have looked for a predictive biomarker such as the change in values due to a particular treatment (7, 8, 16). Few investigators have focused on the ability of DCE-MRI to identify pathologic complete response (pCR) after all treatment has been completed (1, 13, 18, 20). This important and growing subset of fortunate patients might potentially safely avoid surgery and undergo non-operative management as validated by several recent studies, albeit, not yet the standard approach (24, 26, 27). One of the main challenges is the successful identification of clinical complete response that would then be considered the prognostic equivalent of pathologic complete response. Combined imaging and endoscopy evaluations, currently, are felt likely to be necessary (24).
Since chemoradiotherapy for the moment remains the mainstay of treatment for locally advanced rectal cancer, our prior study of DCE-MRI in patients only receiving chemotherapy does not suffice to conclude that DCE-MRI would be useful when radiation is used, particularly since radiation has significant local effects on tissues and vessels (1). Furthermore, there is a paucity of studies looking at post treatment DCE-MRI, and the three of which we are aware have conflicting results (13, 18, 19). For this reason, the purpose of our study was to determine, retrospectively, if perfusion parameters derived from post-chemoradiotherapy DCE-MRI could accurately identify patients who, after surgical resection, had achieved pCR, in order to assist in the difficult and important task of identifying patients that could benefit from organ-sparing treatment and avoid unnecessary surgery.
Patients and Methods
Patients
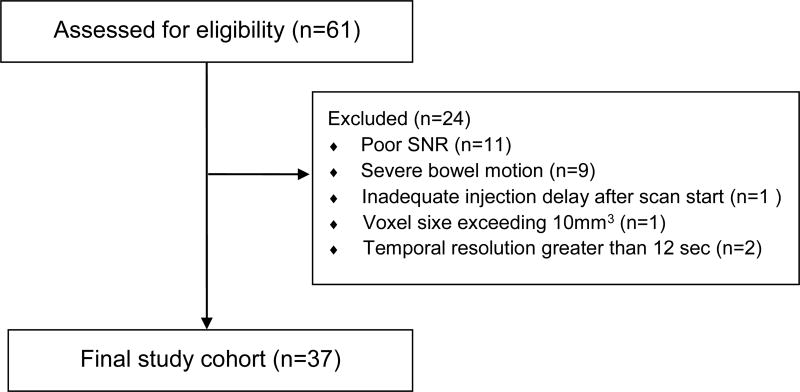
This was a retrospective study approved by our institutional review board with a waiver for the need for patient consent. HIPAA compliance was maintained. From a database of patients who underwent surgery for rectal cancer at our center between 2007–2014, 61 consecutive patients who met the following inclusion criteria were selected for review: (1) American Joint Commission on Cancer (AJCC) 7th edition stage II/III primary rectal adenocarcinoma; (2) Received chemoradiotherapy (5040 cGy + 5FU/LV) which could also include “induction” 5-Fluorouracil/Leucovorin and Oxaliplatin (FOLFOX) (n=8) and which terminated within 8 weeks of performance of the index MRI; (3) Underwent curative intent total mesorectal excision (TME) surgery within 14 weeks of CRT; (4) Had a diagnostic rectal MRI on a 1.5T scanner (Excite, G.E. Medical Systems, Waukesha, WI) at our hospital. The final patient cohort, after exclusions consisted of 37 patients (Figure 1). Pathological response of 100% was defined as “complete response” (pCR) and compared with those who achieved < 100% response. We also explored 95% and 90% response categories.
Fig. 1. Patient Flow Diagram.
Neoadjuvant Therapy
All patients underwent CT simulation in the prone position. Patients underwent either 3-dimensional conformal (3DCRT) or intensity-modulated radiotherapy (IMRT) treatment planning with the in-house planning software. 3DCRT plans consisted of 3 or 4 orthogonal beams for the pelvic fields, and 2 lateral beams and 1 posterior-anterior beam for the boost fields. The planning target volume (PTV) was treated to 45 Gy in 1.8-Gy fractions followed by a 5.4-Gy boost to the PTV boost to a total dose of 5040 cGy. IMRT plans consisted of 5 to 7 equally spaced coplanar fields. The patients treated with IMRT received 45 Gy in 1.8-Gy fractions to PTV and 50 Gy in 2-Gy fractions to the PTV boost as an integrated boost.
Reader Assessment
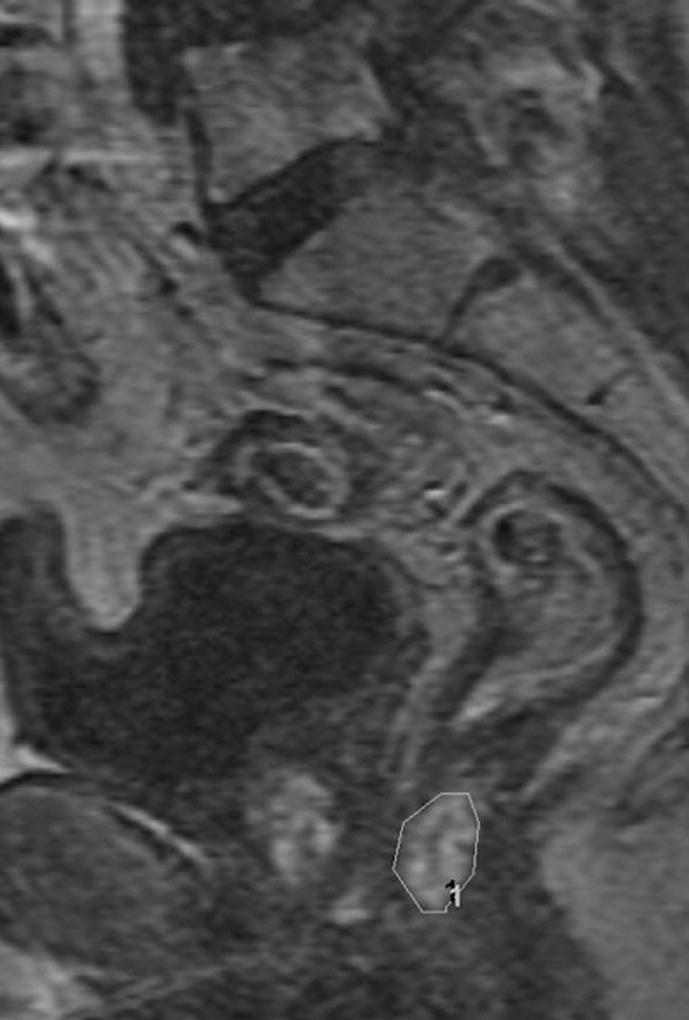
Two experienced radiologists, in consensus, drew regions of interest (ROI) on the sagittal DCE image containing the most obvious tumor/treated tumor bed by comparing the images to other series on the same exam and, where available, pre-treatment MRI or CT for tumor location at baseline. The ROI on the most representative section encompassed the entire region with perceptible early enhancement if present or an area in the location of the original tumor bed with a length approximating the most recent imaging extent of the tumor excluding the lumen (Figures 2, 3).
Fig. 2. 66-year-old man with clinical T3N0, low rectal cancer.
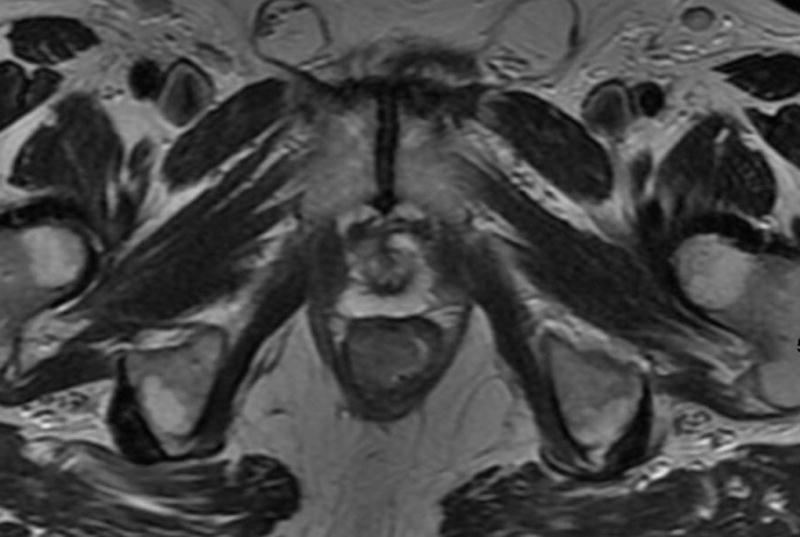
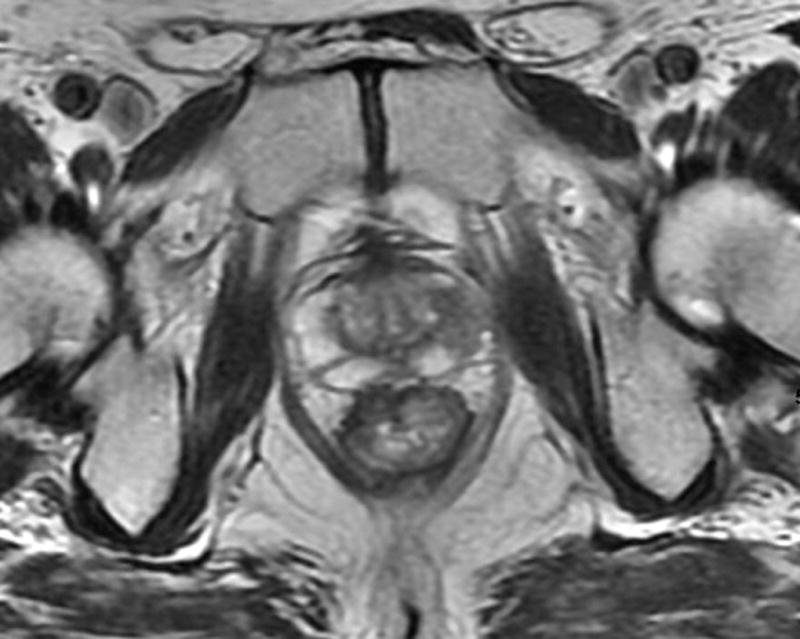
a. T2-weighted axial baseline MRI through lower rectum showing mass filling rectal lumen posterior to prostate
b. T2-weighted axial post-chemoradiotherapy MRI through lower rectum showing scar and questionable residual tumor at right anterior wall in former position of tumor
c. Sagittal DCE-MRI post chemoradiotherapy with region of interest on early enhancing tissue in tumor bed with Ktrans90 = 0.35 and 55% tumor response on subsequent histopathology
Fig. 3. 45-year-old male with T2N, upper rectal tumor.
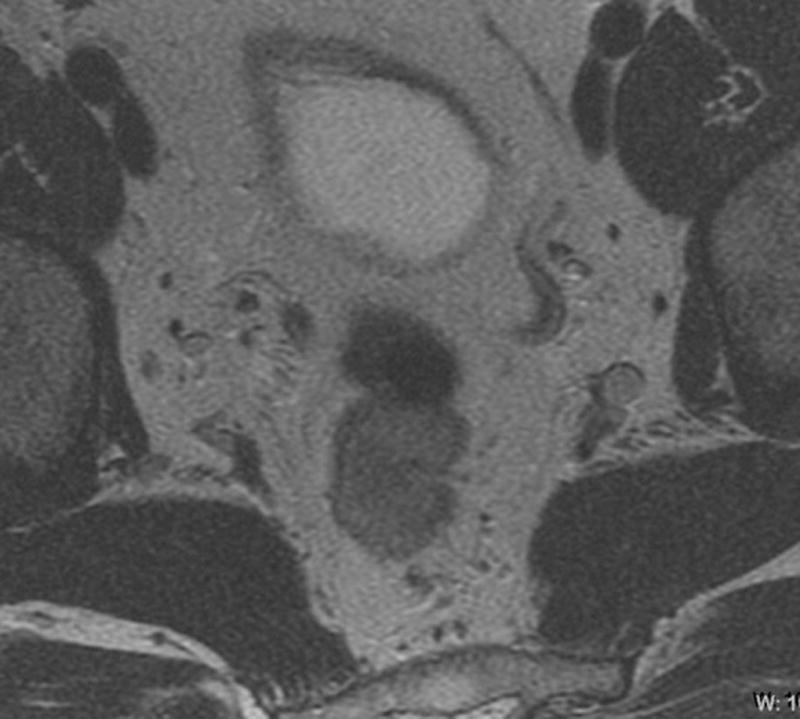
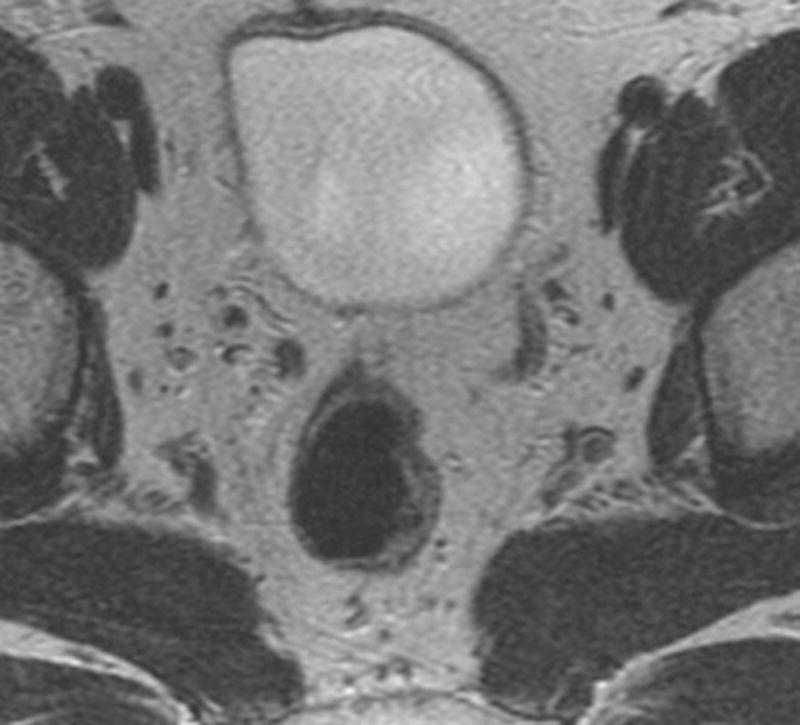
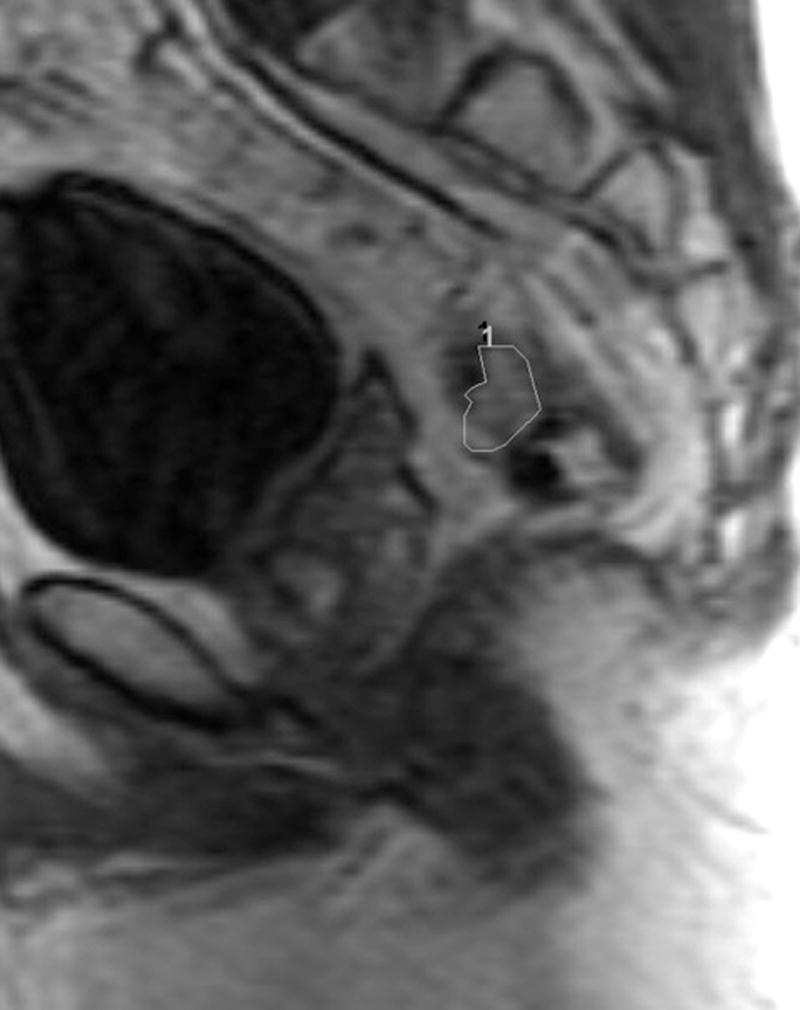
a. Axial baseline T2-weighted MRI through upper rectum shows tumor filling the lumen
b. Axial post chemoradiotherapy T2-weighted MRI through upper rectum shows residual abnormal thickening on left rectal wall possibly representing tumor
c. Sagittal DCE-MRI post chemoradiotherapy with region of interest on early enhancing tissue in tumor bed with Ktrans90 = 0.11 and 100% tumor response (pCR) on subsequent histopathology
Data Acquisition
DCE-MRI images were acquired using a slice-selective 2D or 3D-spoiled gradient echo pulse sequence with slices prescribed in the sagittal plane. Data sets from consecutive patients were examined retrospectively. Acquisition parameter ranges were as follows: TR 3.2–7.8, TE 0.9–4.2, slice thickness 4–10 mm, in-plane voxel resolution 0.83–1.3 mm, temporal resolution 5.99–11.78 s. Acquisition parameter variation was due to the evolution of parameters over the time course of this retrospective study. Patients were scanned on a 1.5T GE scanner (EXCITE platform. General Electric Medical Systems, Waukesha, WI).
Data Processing and Analysis
Tumor regions of interest were drawn in ImageJ (28) by two radiologists in consensus with expertise in interpreting MR images of the rectum. The ROI from the single most representative tumor slice was transferred to in-house Matlab software and kinetic modeling was performed on all voxels in the ROI.
Prior to kinetic modeling, images were spatially smoothed in-plane with a Gaussian filter (voxel width = 3, sigma = 1). Voxel-wise time course data were fit to a 2-compartment Tofts model (29) and Ktrans, ve, and Kep values were derived. To convert signal intensity to contrast concentration, average pre-contrast tissue T1 values were obtained from pretreated patients not included in the study who had undergone multiple flip angle gradient echo imaging for calculation of T1 on the same1.5T MR scanners. An average arterial input function (AIF) was derived from the internal iliac arterial signal time course data in 6 of the study patients where the artery was included in the excitation volume. Coefficients corresponding to the Parker functional AIF form were derived for this average function (30) and used to generate the AIF at the appropriate time points for each patient in the current study. For each derived parameter, mean, median, mode, and 10th, 75th and 90th percentile values were calculated.
Surgery and histopathology
Our colorectal surgeons, each with specialty training and certified in the performance of total mesorectal excision (TME), removed a patient’s rectal cancer using low anterior resection (LAR) or abdominoperineal resection (APR). The specimen was examined with histopathology according to institutional standards. All cases were assessed for surgical margins and other histological features including the percent tumor response, tumor type and differentiation, involvement of the perineural or lymphovascular space by tumor, T stage, and N stage AJCC7th edition. The percent tumor response was estimated based on the amount of fibrosis and inflammatory tissue versus the amount of residual viable carcinoma in the lesion (31, 32).
Statistical Methods
Using the Wilcoxon rank-sum test, DCE parameters (summary statistics of Ktrans, ve, and Kep) were compared between patients with histopathologic tumor response of 90%, 95% or 100% and patients without. A p value < 0.05 is considered statistically significant. We then performed receiver operating characteristic (ROC) analysis to differentiate patients with 90% response from patients with less response using each parameter. The non-parametric ROC curves and the area under the curves (AUC) were estimated. When the lower limit of 95% confidence interval (CI) of AUC is greater than 0.5, using the parameter to identify pCR is significantly better than chance. A cutoff point maximizing Youden’s index on the ROC curve (24) was also identified along with the observed sensitivity, specificity, positive predictive value (PPV) and negative predictive value (NPV). All analyses were performed in software packages SAS 9.4 (SAS Institute Inc., Cary, NC, USA) and R version 3.1 (The R Foundation for Statistical Computing).
Results
Patients, Scanning and Treatment
Sixty-one patients with locally advanced rectal cancer satisfied our initial inclusion criteria. Of these, 37 had data considered adequate for fitting to obtain tumor perfusion parameters. The remaining 24 patients were excluded due to poor SNR (11), severe bowel motion (N = 9), inadequate injection delay after scan start (N = 1), voxel size exceeding 10 mm3 (N = 1) or temporal resolution greater than 12 s (N = 2). Among the 37 patients, 7 had stage II rectal cancer and 30 had stage III. There were 13 males and 24 females and the median age was 53 years (range 30–85). All patients underwent standard chemoradiotherapy consisting of 50.4 Gy pelvic radiation and 5.5 weeks of 5FU/Leucovorin concurrent chemotherapy. Eight patients also underwent induction 5FU/Leukovorin combined with Oxaliplatin (FOLFOX) induction chemotherapy (8 cycles; 16 weeks). MRI post treatment was performed a median of 5.0 weeks after the end of CRT (range 2.0–7.7 weeks). A median of 17 days after MRI (range 3–35 days), and a median of 7.7 weeks after the end of CRT (range 5.3 – 10.3 wks.) patients underwent TME with curative intent. Tumor response ranged from 25–100% (median 80%). There were 8 patients with response of 100%, 29 patients with response less than 100%, 26 patients with response less than 95%, and 23 patients with response less than 90%.
DCE-MRI
There were no significant differences in values of Ktrans, Kep, or ve for patients with greater or less than 100% and greater or less than 95% tumor response (Table 1). Our data suggest that lower post-treatment perfusion parameter values distinguish between patients with good pathologic response (90% or greater) and those with less than 90% response. The mean Ktrans and mean Kep values (p=0.032 and 0.027 respectively), as well as the standard deviations of Ktrans and Kep (p= 0.030 and 0.040, respectively) and Kep 75% from histogram analysis (p=0.035) were statistically significant (Table 2). Optimizing overall accuracy to detect 90% or greater tumor response, expressed as the point on the ROC curve closest to the upper left corner, we found a cutoff value of mean Ktrans= 0.25, with resultant sensitivity, specificity, positive predictive value and negative predictive values with their 95% confidence intervals of: 0.71 [0.42–0.92], 0.78 [0.56–0.93], 0.67 [0.38–0.88], and 0.82 [0.60–0.95] respectively. The area under the receiver operating characteristic curve (AUC) was 0.71 [95%CI: 0.51–0.92] (Table 3, Figure 4).
Table 1. Summary of DCE parameters.
Summary of DCE-MRI parameters for patients with less than 95% response and 95% or greater as well as for patients with less than 100% response and 100% or greater
| DCE parameters | Response < 95% (n=26) |
Response ≥ 95% (n=11) |
Response < 100% (n=29) |
Complete Response (n=8) |
|||
|---|---|---|---|---|---|---|---|
| Median (Range) | Median (Range) | p value | Median (Range) | Median (Range) | p value | ||
| Ktrans (min−1) | Mean | 0.29 (0.09, 2.17) | 0.24 (0.06, 5.10) | 0.295 | 0.29 (0.06, 2.17) | 0.25 (0.08, 5.10) | 0.897 |
| SD | 0.21 (0.01, 1.41) | 0.11 (0.01, 1.38) | 0.238 | 0.19 (0.01, 1.41) | 0.13 (0.01, 1.38) | 0.782 | |
| Median | 0.26 (0.09, 1.86) | 0.23 (0.05, 5.04) | 0.496 | 0.26 (0.05, 1.86) | 0.24 (0.07, 5.04) | 0.897 | |
|
| |||||||
| Ve | Mean | 0.45 (0.29, 0.89) | 0.46 (0.33, 0.76) | 0.907 | 0.46 (0.29, 0.89) | 0.43 (0.33, 0.76) | 0.956 |
| SD | 0.12 (0.03, 0.21) | 0.12 (0.06, 0.19) | 0.881 | 0.12 (0.03, 0.21) | 0.12 (0.06, 0.19) | 0.810 | |
| Median | 0.45 (0.27, 0.91) | 0.41 (0.30, 0.76) | 0.803 | 0.46 (0.27, 0.91) | 0.40 (0.30, 0.76) | 0.897 | |
|
| |||||||
| Kep(min−1) | Mean | 0.71 (0.24, 3.54) | 0.63 (0.14, 13.48) | 0.280 | 0.70 (0.14, 3.54) | 0.65 (0.14, 13.48) | 0.810 |
| SD | 0.50 (0.03, 2.90) | 0.28 (0.04, 2.10) | 0.252 | 0.47 (0.03, 2.90) | 0.34 (0.04, 2.10) | 0.839 | |
| Median | 0.62 (0.25, 3.24) | 0.51 (0.13, 13.98) | 0.496 | 0.61 (0.14, 3.24) | 0.6 (0.13, 13.98) | 0.897 | |
Table 2. Summary of post CRT MRI parameters for 90% response threshold.
Summary od DCE-MRI parameters for patients with less than 90% response and 90% or greater
| DCE parameters | Response < 90% (n=23) | Response ≥ 90% (n=14) | ||
|---|---|---|---|---|
| Median (Range) | Median (Range) | p value | ||
| Ktrans (min−1) | Mean | 0.3 (0.17, 2.17) | 0.23 (0.06, 5.1) | 0.032 |
| SD | 0.22 (0.02, 1.41) | 0.09 (0.01, 1.38) | 0.030 | |
| Median | 0.28 (0.12, 1.86) | 0.22 (0.05, 5.04) | 0.129 | |
| 75% | 0.45 (0.18, 3.51) | 0.28 (0.08, 5.73) | 0.062 | |
|
| ||||
| Ve | Mean | 0.45 (0.29, 0.89) | 0.46 (0.33, 0.76) | 0.913 |
| SD | 0.12 (0.05, 0.2) | 0.12 (0.03, 0.21) | 0.814 | |
| Median | 0.46 (0.27, 0.91) | 0.41 (0.3, 0.76) | 0.913 | |
| 75% | 0.54 (0.34, 0.96) | 0.53 (0.39, 0.86) | 0.913 | |
|
| ||||
| Kep(min−1) | Mean | 0.73 (0.33, 3.54) | 0.5 (0.14, 13.48) | 0.027 |
| SD | 0.54 (0.13, 2.9) | 0.23 (0.03, 2.1) | 0.040 | |
| Median | 0.64 (0.32, 3.24) | 0.42 (0.13, 13.98) | 0.082 | |
| 75% | 0.95 (0.42, 6.07) | 0.67 (0.18, 14.74) | 0.035 | |
Table 3. AUC and cutoff value for response ≥90%, along with measures of accuracy using each DCE parameter to differentiate response.
Performance characteristics for those parameters able to identify 90% tumor response with statistical significance
| AUC (95%CI) | Cutoff Value |
Sensitivity (95%CI) | Specificity (95%CI) | PPV (95%CI) | NPV (95%CI) | ||
|---|---|---|---|---|---|---|---|
| Ktrans (min−1) | Mean | 0.714 (0.511, 0.918) | 0.254 | 0.714 (0.419, 0.916) | 0.783 (0.563, 0.925) | 0.667 (0.384, 0.882) | 0.818 (0.597, 0.948) |
| SD | 0.717 (0.528, 0.907) | 0.115 | 0.643 (0.351, 0.872) | 0.783 (0.563, 0.925) | 0.643 (0.351, 0.872) | 0.783 (0.563, 0.925) | |
|
| |||||||
| Kep(min−1) | Mean | 0.720 (0.521, 0.920) | 0.672 | 0.714 (0.419, 0.916) | 0.783 (0.563, 0.925) | 0.667 (0.384, 0.882) | 0.818 (0.597, 0.948) |
| SD | 0.705 (0.521, 0.889) | 0.514 | 0.786 (0.492, 0.953) | 0.565 (0.345, 0.768) | 0.524 (0.298, 0.743) | 0.812 (0.544, 0.960) | |
| 75% | 0.711 (0.517, 0.906) | 0.795 | 0.643 (0.351, 0.872) | 0.783 (0.563, 0.925) | 0.643 (0.351, 0.872) | 0.783 (0.563, 0.925) | |
Figure 4. Receiver operating characteristics curves (ROC) for 3 parameters with statistical significance for identifying complete response.
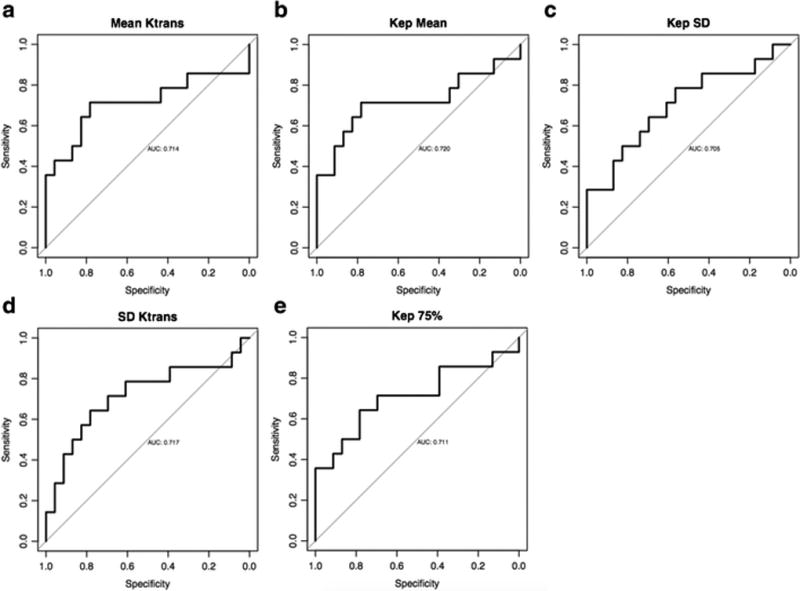
a. Mean Ktrans
b. SD Ktrans
c. Mean Kep
d. SD Kep
e. 75% Kep
Discussion
In this study of 37 patients with locally advanced rectal cancer who underwent preoperative chemoradiotherapy, we found that the DCE-MRI based parameter Ktrans, the volume transfer coefficient, showed some utility in the identification of patients with 90% tumor regression or more, but was unable to identify complete pathological responders. The post treatment Ktrans mean for the 14 patients with 90% or greater response was statistically significantly lower (0.23 min−1) than in the 23 patients with response less than 90% (0.30 min−1, p=0.03). Additionally, the standard deviation of Ktrans values in the tumor bed was narrower in patients with pCR than those without suggesting more homogeneous post-treatment non-tumor tissue (p=0.03). A threshold of 0.25 min−1 emerged as the best mean Ktrans value to make this distinction with the best combination of sensitivity and specificity and an AUC of 0.71.
Although our understanding of cellular level dynamics is still evolving, we interpret our findings, as in our prior work (1), to reflect that the successful obliteration of abnormally leaky neovasculature in tumor by chemoradiotherapy, leads to residual tissue in the tumor bed with more normal flow and permeability. Furthermore, the truly sterilized tumor bed environment may have more homogeneous perfusion characteristics than that of other patients as indicated by a narrower Ktrans SD.
Several investigators have studied DCE-MRI in the treatment of rectal cancer reporting on its use pretreatment (14, 15, 16, 18), during the course of treatment (deltaKtrans) (4, 8, 13, 15, 19), and after treatment (13, 18, 19). Intven et al. found that post CRT Ktrans was less accurate than the changes in Ktrans during treatment (deltaKtrans) in distinguishing pCR, and that good responders were more accurately predicted than complete responders (pCR) (19). This analysis is similar to ours, since we had better accuracy with the 90% or better response category than with the pCR category. The decrease in Ktrans values, as was noted in prior studies (13), was more predictive of 90% or greater response, but still with a PPV of only 67%. We did not analyze baseline Ktrans or deltaKtrans since, as a tertiary care center with many referrals, we do not always have the opportunity to perform the baseline DCE-MRI or have access to outside baseline DCE-MRI kinetic analysis results. Thus, we wanted to test if a single post-treatment DCE-MRI performed at our institution had stand-alone value. The AUC of 0.89 in the Intven study supersedes our AUC of 0.71 for mean Ktrans. However, the comparability of the studies is somewhat limited, as is often the case, due to differing techniques and response definitions. They defined “good response” as pCR or near pCR, which includes Mandard TRG 1 (no viable tumor cells) and Mandard TRG 2 (only solitary vital tumor cells in the resection specimen) (33). This is probably similar to our 90% or greater tumor response criterion as shown in a comparison of response systems from our institution, where TRG 2 corresponds with 86–99% tumor response in terms of patient outcomes (32). Nonetheless, given the retrospective nature of our study and the lower temporal resolution, we still identified predictive value of Ktrans. This is encouraging for further study of DCE-MRI, perhaps with a more optimized technique where the trade-offs between temporal resolution and adequate signal are optimally balanced.
Similar to our study and the Intven study, the studies of Tong et al. (18) and of Kim et al. (13) did not find post treatment Ktrans of value to distinguish pCR from non-pCR patients. The Tong group findings were in keeping with other researchers (15, 16) that found pre- treatment Ktrans predictive of eventual pCR. The Kim group, found only deltaKtrans useful to identify overall good responders, as others have found (15, 16), but this was not true for the pCR group.
The clinical implications of our results must be viewed with an eye to DWI-MRI, the other major functional MRI method, which has shown superior results in both qualitative detection of pCR (24) and quantitative evaluation (20). In fact, using a novel combined functional and volumetric approach, Intven et al found (20) that the apparent diffusion coefficient (ADC) was superior, with or without added volumetry, in detecting good and compete responses and that DCE-MRI did not add value. ADC for treatment response assessment has been found by most other investigators to be useful (34–37), although there is not uniform agreement in the literature (38).
Although the DCE-MRI techniques available may still be further optimized, deriving model-based Ktrans values remains burdensome compared with the straightforward visual assessment of signal intensity in DWI-MRI. Recognizing the need to improve workflow if DCE-MRI is to be incorporated into daily MRI interpretation, Martens et al. evaluated a simple semi-quantitative assessment of DCE based on the shape of the enhancement curve in the rectal tumor and found some helpful differences in tumor washout dynamics between good and poor responders (21). Similarly, Petrillo, et. al. have developed a contrast curve-shaped based parameter for predicting recurrent tumor (39).
Our study has some limitations, including the sample size and retrospective design. We had multiple exclusions based on image acquisition problems, and this could limit the implementation of this study into clinical practice. As with other studies, actual DCE-MRI parameter values like Ktrans cannot be easily compared across institutions due to the lack of standards for performance (e.g. field strength, pharmacokinetic model, temporal resolution) of DCE-MRI. Our particular cohort included studies with variable temporal resolution and voxel sizes, which should be made more uniform in future studies. Finally, a fraction of our patients received induction chemotherapy prior to CRT. Although this is not yet a widely adapted treatment paradigm, we still felt that at the end of all treatment, an ability to detect pCR to guide decision making must be robust since many patients with an intended treatment schema can have alterations during their treatment course.
In conclusion, in a cohort of patients with locally advanced rectal cancer who underwent preoperative chemoradiotherapy, although pathologic complete responders could not be confidently identified as a separate group, we found that the mean value of the DCE-MRI based parameter Ktrans showed some utility in identifying patients with a pathologic response of 90% or more and in distinguishing them from patients that had less than 90% tumor response at surgery. At a threshold of Ktrans = 0.25, this showed an AUC of 0.71Further studies comparing DCE-MRI to DWI-MRI are indicated to determine any incremental value in tumor detection.
Key Points.
Chemoradiotherapy for rectal cancer causes decrease blood flow and permeability in the tumor bed
Lower values of blood flow and permeability correlate with good tumor response
A threshold Ktrans of 0.25min−1 emerged as the best value to identify patients with 90% or more response with AUC 0.71
Acknowledgments
We would like to thank Drs. Milou Martens and Regina G.H. Beets-Tan for providing Phillips-based 1.5T T1 data.
Drs. Zheng and Gonen are supported by an institutional core grant: National Institutes of Health (P30 CA008748)
References
- 1.Gollub MJ, Gultekin DH, Akin O, Do RK, Fuqua JL, 3rd, Gonen M, et al. Dynamic contrast enhanced-MRI for the detection of pathological complete response to neoadjuvant chemotherapy for locally advanced rectal cancer. European radiology. 2012;22(4):821–31. doi: 10.1007/s00330-011-2321-1. Epub 2011/11/22. [DOI] [PubMed] [Google Scholar]
- 2.Goh V, Padhani AR, Rasheed S. Functional imaging of colorectal cancer angiogenesis. The Lancet Oncology. 2007;8(3):245–55. doi: 10.1016/s1470-2045((07)70075-x. Epub 2007/03/03. [DOI] [PubMed] [Google Scholar]
- 3.Hötker AM, Tarlinton L, Mazaheri Y, Woo KM, Gönen M, Saltz LB, Goodman KA, Garcia-Aguilar J, Gollub MJ. Multiparametric MRI in the assessment of response of rectal cancer to neoadjuvant chemoradiotherapy: A comparison of morphological, volumetric and functional MRI parameters. Eur Radio. 2016 doi: 10.1007/s00330-016-4283-9. Published online March 5, 2016. [DOI] [PMC free article] [PubMed] [Google Scholar]
- 4.de Lussanet QG, Backes WH, Griffioen AW, Padhani AR, Baeten CI, van Baardwijk A, et al. Dynamic contrast-enhanced magnetic resonance imaging of radiation therapy-induced microcirculation changes in rectal cancer. International journal of radiation oncology, biology, physics. 2005;63(5):1309–15. doi: 10.1016/j.ijrobp.2005.04.052. Epub 2005/08/30. [DOI] [PubMed] [Google Scholar]
- 5.Atkin G, Taylor NJ, Daley FM, Stirling JJ, Richman P, Glynne-Jones R, et al. Dynamic contrast-enhanced magnetic resonance imaging is a poor measure of rectal cancer angiogenesis. The British journal of surgery. 2006;93(8):992–1000. doi: 10.1002/bjs.5352. Epub 2006/05/05. [DOI] [PubMed] [Google Scholar]
- 6.Kremser C, Trieb T, Rudisch A, Judmaier W, de Vries A. Dynamic T (1) mapping predicts outcome of chemoradiation therapy in primary rectal carcinoma: sequence implementation and data analysis. Journal of magnetic resonance imaging : JMRI. 2007;26(3):662–71. doi: 10.1002/jmri.21034. Epub 2007/08/31. [DOI] [PubMed] [Google Scholar]
- 7.Sahani DV, Kalva SP, Hamberg LM, Hahn PF, Willett CG, Saini S, et al. Assessing tumor perfusion and treatment response in rectal cancer with multisection CT: initial observations. Radiology. 2005;234(3):785–92. doi: 10.1148/radiol.2343040286. Epub 2005/03/01. [DOI] [PubMed] [Google Scholar]
- 8.Dinter DJ, Horisberger K, Zechmann C, Wenz F, Brade J, Willeke F, et al. Can dynamic MR imaging predict response in patients with rectal cancer undergoing cetuximab-based neoadjuvant chemoradiation? Onkologie. 2009;32(3):86–93. doi: 10.1159/000194950. Epub 2009/03/20. [DOI] [PubMed] [Google Scholar]
- 9.de Vries A, Griebel J, Kremser C, Judmaier W, Gneiting T, Debbage P, et al. Monitoring of tumor microcirculation during fractionated radiation therapy in patients with rectal carcinoma: preliminary results and implications for therapy. Radiology. 2000;217(2):385–91. doi: 10.1148/radiology.217.2.r00nv02385. Epub 2000/11/04. [DOI] [PubMed] [Google Scholar]
- 10.Devries AF, Griebel J, Kremser C, Judmaier W, Gneiting T, Kreczy A, et al. Tumor microcirculation evaluated by dynamic magnetic resonance imaging predicts therapy outcome for primary rectal carcinoma. Cancer research. 2001;61(6):2513–6. Epub 2001/04/06. [PubMed] [Google Scholar]
- 11.Capirci C, Valentini V, Cionini L, De Paoli A, Rodel C, Glynne-Jones R, et al. Prognostic value of pathologic complete response after neoadjuvant therapy in locally advanced rectal cancer: long-term analysis of 566 ypCR patients. International journal of radiation oncology, biology, physics. 2008;72(1):99–107. doi: 10.1016/j.ijrobp.2007.12.019. Epub 2008/04/15. [DOI] [PubMed] [Google Scholar]
- 12.Rodel C, Martus P, Papadoupolos T, Fuzesi L, Klimpfinger M, Fietkau R, et al. Prognostic significance of tumor regression after preoperative chemoradiotherapy for rectal cancer. Journal of clinical oncology : official journal of the American Society of Clinical Oncology. 2005;23(34):8688–96. doi: 10.1200/jco.2005.02.1329. Epub 2005/10/26. [DOI] [PubMed] [Google Scholar]
- 13.Kim SH, Lee JM, Gupta SN, Han JK, Choi BI. Dynamic contrast-enhanced MRI to evaluate the therapeutic response to neoadjuvant chemoradiation therapy in locally advanced rectal cancer. Journal of magnetic resonance imaging : JMRI. 2014;40(3):730–7. doi: 10.1002/jmri.24387. Epub 2013/12/07. [DOI] [PubMed] [Google Scholar]
- 14.Oberholzer K, Menig M, Pohlmann A, Junginger T, Heintz A, Kreft A, et al. Rectal cancer: assessment of response to neoadjuvant chemoradiation by dynamic contrast-enhanced MRI. Journal of magnetic resonance imaging : JMRI. 2013;38(1):119–26. doi: 10.1002/jmri.23952. Epub 2012/11/29. [DOI] [PubMed] [Google Scholar]
- 15.Lim JS, Kim D, Baek SE, Myoung S, Choi J, Shin SJ, et al. Perfusion MRI for the prediction of treatment response after preoperative chemoradiotherapy in locally advanced rectal cancer. European radiology. 2012;22(8):1693–700. doi: 10.1007/s00330-012-2416-3. Epub 2012/03/20. [DOI] [PubMed] [Google Scholar]
- 16.George ML, Dzik-Jurasz AS, Padhani AR, Brown G, Tait DM, Eccles SA, et al. Non-invasive methods of assessing angiogenesis and their value in predicting response to treatment in colorectal cancer. The British journal of surgery. 2001;88(12):1628–36. doi: 10.1046/j.0007-1323.2001.01947.x. Epub 2001/12/12. [DOI] [PubMed] [Google Scholar]
- 17.Yeo DM, Oh SN, Jung CK, Lee MA, Oh ST, Rha SE, et al. Correlation of dynamic contrast-enhanced MRI perfusion parameters with angiogenesis and biologic aggressiveness of rectal cancer: Preliminary results. Journal of magnetic resonance imaging : JMRI. 2015;41(2):474–80. doi: 10.1002/jmri.24541. Epub 2014/01/01. [DOI] [PubMed] [Google Scholar]
- 18.Tong T, Sun Y, Gollub MJ, Peng W, Cai S, Zhang Z, et al. Dynamic contrast-enhanced MRI: Use in predicting pathological complete response to neoadjuvant chemoradiation in locally advanced rectal cancer. Journal of magnetic resonance imaging : JMRI. 2015;42(3):673–80. doi: 10.1002/jmri.24835. Epub 2015/02/06. [DOI] [PubMed] [Google Scholar]
- 19.Intven M, Reerink O, Philippens ME. Dynamic contrast enhanced MR imaging for rectal cancer response assessment after neo-adjuvant chemoradiation. Journal of magnetic resonance imaging : JMRI. 2015;41(6):1646–53. doi: 10.1002/jmri.24718. Epub 2014/08/16. [DOI] [PubMed] [Google Scholar]
- 20.Intven M, Monninkhof EM, Reerink O, Philippens ME. Combined T2w volumetry, DW-MRI and DCE-MRI for response assessment after neo-adjuvant chemoradiation in locally advanced rectal cancer. Acta oncologica (Stockholm, Sweden) 2015:1–8. doi: 10.3109/0284186x.2015.1037010. Epub 2015/04/29. [DOI] [PubMed] [Google Scholar]
- 21.Martens MH, Subhani S, Heijnen LA, Lambregts DM, Buijsen J, Maas M, et al. Can perfusion MRI predict response to preoperative treatment in rectal cancer? Radiotherapy and oncology : journal of the European Society for Therapeutic Radiology and Oncology. 2015;114(2):218–23. doi: 10.1016/j.radonc.2014.11.044. Epub 2014/12/17. [DOI] [PubMed] [Google Scholar]
- 22.Kalff V, Ware R, Heriot A, Chao M, Drummond E, Hicks RJ. Radiation changes do not interfere with post-chemoradiation restaging of patients with rectal cancer by FDG PET/CT before curative surgical therapy. International journal of radiation oncology, biology, physics. 2009;74(1):60–6. doi: 10.1016/j.ijrobp.2008.06.1944. Epub 2008/10/17. [DOI] [PubMed] [Google Scholar]
- 23.Kalff V, Duong C, Drummond EG, Matthews JP, Hicks RJ. Findings on 18F-FDG PET scans after neoadjuvant chemoradiation provides prognostic stratification in patients with locally advanced rectal carcinoma subsequently treated by radical surgery. Journal of nuclear medicine : official publication, Society of Nuclear Medicine. 2006;47(1):14–22. Epub 2006/01/05. [PubMed] [Google Scholar]
- 24.Maas M, Lambregts DM, Nelemans PJ, Heijnen LA, Martens MH, Leijtens JW, et al. Assessment of Clinical Complete Response After Chemoradiation for Rectal Cancer with Digital Rectal Examination, Endoscopy, and MRI: Selection for Organ-Saving Treatment. Annals of Surgical Oncology. 2015;22:3873–3880. doi: 10.1245/s10434-015-4687-9. [DOI] [PMC free article] [PubMed] [Google Scholar]
- 25.Martens MH, Lambregts DMJ, Papnikolaou N, Alefantinou S, Maas M, Manikis GC, Marias K, Riedl RG, Beets GL, Beets-Tan RGH. Magnetization transfer imaging to assess tumor response after chemoradiotherapy in rectal cancer. Eur Radiol. 2016;26:390–397. doi: 10.1007/s00330-015-3856-3. [DOI] [PMC free article] [PubMed] [Google Scholar]
- 26.Habr-Gama A, Gama-Rodrigues J, Sao Juliao GP, Proscurshim I, Sabbagh C, Lynn PB, et al. Local recurrence after complete clinical response and watch and wait in rectal cancer after neoadjuvant chemoradiation: impact of salvage therapy on local disease control. International journal of radiation oncology, biology, physics. 2014;88(4):822–8. doi: 10.1016/j.ijrobp.2013.12.012. Epub 2014/02/06. [DOI] [PubMed] [Google Scholar]
- 27.Smith JD, Ruby JA, Goodman KA, Saltz LB, Guillem JG, Weiser MR, et al. Nonoperative management of rectal cancer with complete clinical response after neoadjuvant therapy. Annals of surgery. 2012;256(6):965–72. doi: 10.1097/SLA.0b013e3182759f1c. Epub 2012/11/17. [DOI] [PubMed] [Google Scholar]
- 28.Schneider CA, Rasband WS, Eliceiri KW. NIH Image to ImageJ: 25 years of image analysis. Nature methods. 2012;9(7):671–5. doi: 10.1038/nmeth.2089. Epub 2012/08/30. [DOI] [PMC free article] [PubMed] [Google Scholar]
- 29.Koh TS, Bisdas S, Koh DM, Thng CH. Fundamentals of tracer kinetics for dynamic contrast-enhanced MRI. Journal of magnetic resonance imaging : JMRI. 2011;34(6):1262–76. doi: 10.1002/jmri.22795. Epub 2011/10/06. [DOI] [PubMed] [Google Scholar]
- 30.Parker GJ, Roberts C, Macdonald A, Buonaccorsi GA, Cheung S, Buckley DL, et al. Experimentally-derived functional form for a population-averaged high-temporal-resolution arterial input function for dynamic contrast-enhanced MRI. Magnetic resonance in medicine. 2006;56(5):993–1000. doi: 10.1002/mrm.21066. Epub 2006/10/13. [DOI] [PubMed] [Google Scholar]
- 31.Shia J, Guillem JG, Moore HG, Tickoo SK, Qin J, Ruo L, et al. Patterns of morphologic alteration in residual rectal carcinoma following preoperative chemoradiation and their association with long-term outcome. The American journal of surgical pathology. 2004;28(2):215–23. doi: 10.1097/00000478-200402000-00009. Epub 2004/03/27. [DOI] [PubMed] [Google Scholar]
- 32.Trakarnsanga A, Gonen M, Shia J, Nash GM, Temple LK, Guillem JG, et al. Comparison of tumor regression grade systems for locally advanced rectal cancer after multimodality treatment. Journal of the National Cancer Institute. 2014;106(10) doi: 10.1093/jnci/dju248. Epub 2014/09/25. [DOI] [PMC free article] [PubMed] [Google Scholar]
- 33.Mandard AM, Dalibard F, Mandard JC, et al. Pathologic assessment of tumor regression after preoperative chemoradiotherapy of esophageal carcinoma. Clinicopathologic correlations. Cancer. 1994;73:2680–2686. doi: 10.1002/1097-0142(19940601)73:11<2680::aid-cncr2820731105>3.0.co;2-c. [DOI] [PubMed] [Google Scholar]
- 34.Intven M, Reerink O, Philippens ME. Diffusion-weighted MRI in locally advanced rectal cancer : pathological response prediction after neo-adjuvant radiochemotherapy. Strahlentherapie und Onkologie : Organ der Deutschen Rontgengesellschaft [et al] 2013;189(2):117–22. doi: 10.1007/s00066-012-0270-5. Epub 2013/01/04. [DOI] [PubMed] [Google Scholar]
- 35.Lambregts DM, Vandecaveye V, Barbaro B, Bakers FC, Lambrecht M, Maas M, et al. Diffusion-weighted MRI for selection of complete responders after chemoradiation for locally advanced rectal cancer: a multicenter study. Annals of surgical oncology. 2011;18(8):2224–31. doi: 10.1245/s10434-011-1607-5. Epub 2011/02/25. [DOI] [PMC free article] [PubMed] [Google Scholar]
- 36.Lambrecht M, Vandecaveye V, De Keyzer F, Roels S, Penninckx F, Van Cutsem E, et al. Value of diffusion-weighted magnetic resonance imaging for prediction and early assessment of response to neoadjuvant radiochemotherapy in rectal cancer: preliminary results. International journal of radiation oncology, biology, physics. 2012;82(2):863–70. doi: 10.1016/j.ijrobp.2010.12.063. Epub 2011/03/15. [DOI] [PubMed] [Google Scholar]
- 37.Kim SH, Lee JY, Lee JM, Han JK, Choi BI. Apparent diffusion coefficient for evaluating tumour response to neoadjuvant chemoradiation therapy for locally advanced rectal cancer. European radiology. 2011;21(5):987–95. doi: 10.1007/s00330-010-1989-y. Epub 2010/10/28. [DOI] [PubMed] [Google Scholar]
- 38.Lambregts DM, Beets GL, Maas M, Curvo-Semedo L, Kessels AG, Thywissen T, et al. Tumour ADC measurements in rectal cancer: effect of ROI methods on ADC values and interobserver variability. European radiology. 2011;21(12):2567–74. doi: 10.1007/s00330-011-2220-5. Epub 2011/08/09. [DOI] [PMC free article] [PubMed] [Google Scholar]
- 39.Petrillo A, Fusco R, Petrillo M, Granata V. Standardized Index of Shape (SIS): a quantitative DCE-MRI parameter to discriminate responders by non-responders after neoadjuvant therapy in LARC. Eur Radiol. 2015 Jul;25(7):1935–45. doi: 10.1007/s00330-014-3581-3. [DOI] [PubMed] [Google Scholar]


