

Summary
Conflicts between transcription and replication are a potent source of DNA damage. Co-transcriptional R-loops could aggravate such conflicts by creating an additional barrier to replication fork progression. Here, we use a defined episomal system to investigate how conflict orientation and R-loop formation influence genome stability in human cells. R-loops, but not normal transcription complexes, induce DNA breaks and orientation-specific DNA damage responses during conflicts with replication forks. Unexpectedly, the replisome acts as an orientation-dependent regulator of R-loop levels, reducing R-loops in the co-directional (CD) orientation but promoting their formation in the head-on (HO) orientation. Replication stress and deregulated origin firing increase the number of HO collisions leading to genome-destabilizing R-loops. Our findings connect DNA replication to R-loop homeostasis and suggest a mechanistic basis for genome instability resulting from deregulated DNA replication, observed in cancer and other disease states.
Graphical abstract

Introduction
During DNA synthesis, the replication machinery must overcome numerous obstacles, including tightly bound DNA-protein complexes, non-B form DNA structures and lesions that interfere with fork progression (Mirkin and Mirkin, 2007). Failure to overcome these barriers leads to genome instability, a hallmark of cancer and aging (Gaillard et al., 2015; Vijg and Suh, 2013; Zeman and Cimprich, 2014). Transcription complexes are one endogenous impediment frequently encountered by replication forks, and transcription-replication conflicts (TRCs) can induce DNA replication-fork stalling, DNA recombination, DNA breaks and mutations (Dutta et al., 2011; French, 1992; Merrikh et al., 2011; Sankar et al., 2016; Srivatsan et al., 2010). Therefore, TRCs pose a potent threat to genome stability (García-Muse and Aguilera, 2016).
TRCs occur in two orientations: co-directional (CD), where the replication fork moves in the same direction as the transcription machinery, and head-on (HO), where the two converge. In bacteria, HO collisions are the main cause of genomic alterations, leading to deletions, recombination and cell death (Srivatsan et al., 2010; Vilette et al., 1996). To minimize HO-TRCs, bacterial genomes are organized to preferentially co-orient essential and highly-transcribed genes with replication (Rocha, 2008). Although HO collisions are thought to be more deleterious, this orientation bias necessarily favors CD encounters, which can disrupt replication at specific sites, such as at the highly transcribed ribosomal DNA clusters (Merrikh et al., 2011). They can also form double-strand breaks (DSBs) when the replication fork encounters a stable backtracked RNA polymerase (RNAP) (Dutta et al., 2011).
Although there is less direct evidence, TRCs are proposed to be a potent threat to genome stability in eukaryotic cells. RNAP II transcribed genes can induce recombination on yeast plasmid constructs when transcription and replication are oriented in opposite directions (Prado and Aguilera, 2005). Furthermore, gene expression in mammalian cells can provoke S-phase-dependent recombination (Gottipati et al., 2008), and torsional stress created by Topoisomerase I depletion leads to stalled forks and DNA breaks at certain S-phase transcribed genes (Tuduri et al., 2009). Collisions in long genes may be particularly difficult to avoid, as they complete transcription over multiple cell cycles (Helmrich et al., 2011). Moreover, some long genes overlap with hotspots for chromosomal instability that replicate late in S-phase (Le Tallec et al., 2014). Early-replicating fragile sites lie at clusters of highly transcribed genes near early origins. Thus, their fragility may also be driven by transcription-replication encounters (Barlow et al., 2013). Together, these studies suggest conflicts between transcription and replication frequently threaten genome integrity in eukaryotic cells.
One potent co-transcriptional replication fork barrier is the R-loop, an RNA-DNA hybrid formed when nascent transcripts reanneal to their template DNA, displacing the non-template strand as single-stranded DNA (ssDNA) (Aguilera and García-Muse, 2012). Elevated R-loop levels cause DNA damage and genome instability. The loss of RNA processing and regulatory factors increases R-loop levels, causing R-loop dependent DNA damage in both yeast and human cells (Huertas and Aguilera, 2003; Li and Manley, 2005; Paulsen et al., 2009; Santos-Pereira and Aguilera, 2015; Sollier et al., 2014). R-loops are also prevalent in eukaryotic genomes, and are involved in immunoglobulin class switch recombination (Yu et al., 2003), transcription termination (Skourti-Stathaki et al., 2011), and gene regulation (Sun et al., 2013). DNA replication contributes to R-loop-induced DNA damage, consistent with R-loops potentially blocking replication forks (Castellano-Pozo et al., 2012; Gan et al., 2011; Tuduri et al., 2009). What happens when replication forks encounter R-loop-associated transcription complexes is unclear. Whether these R-loops are traversed or removed, how collision orientation affects R-loop stability, and what molecular intermediates may underlie the observed DNA damage are unresolved questions.
The plasticity of eukaryotic replication programs makes it difficult to study how R-loops and transcription orientation impact TRCs. Unlike in bacteria, where a single origin replicates each gene in a predictable orientation, mammalian chromosomes contain numerous origins that fire with variable efficiencies and timing (Hills and Diffley, 2014; Rhind and Gilbert, 2013). Moreover, eukaryotic cells have excess origins that can complete DNA synthesis when other replication forks stall (Alver et al., 2014). Thus, it is difficult to predict the location and orientation of a TRC in eukaryotic cells.
Here, we report a human-cell-based plasmid system with exquisite control over the direction and timing of replication, transcription and R-loop formation. We find striking differences between HO and CD collisions in the context with an R-loop. These collisions induce distinct DNA damage responses (DDRs) and differentially affect hybrid stability, reducing hybrids in the co-directional orientation but promoting them in the head-on orientation. Importantly, we demonstrate the same effects on hybrids in the native genomic context. These observations suggest the replisome regulates R-loop levels and provide mechanistic insight into how regulatory R-loops are tolerated in S phase. They also indicate deregulated replication may perturb R-loop levels, which may underlie genomic instability in cells experiencing replication stress, a hallmark of cancer and other disease states (Gaillard et al., 2015; Vijg and Suh, 2013; Zeman and Cimprich, 2014).
Results
An episomal system to study transcription-replication conflicts
To systematically probe the consequences of TRCs, we developed an episomal system to induce localized conflicts with controlled transcription levels. We took advantage of the Epstein–Barr virus replication origin (oriP) which allows for unidirectional replication of chromatinized plasmids ((Kirchmaier and Sugden, 1995) and data not shown). The co-expressed Epstein–Barr virus nuclear antigen 1 (EBNA1) protein uses the endogenous MCM helicase and other endogenous replication factors, while also binding the oriP site to block one arm of the bidirectional replication fork (Dhar et al., 2001; Gahn and Schildkraut, 1989). We cloned the R-loop forming portion of the mouse AIRN (mAIRN) gene (Ginno et al., 2012) or the non R-loop forming ECFP sequence in both directions relative to oriP to compare R-loop dependent (mAIRN) and independent (ECFP) HO and CD collisions (Figure 1A). Replication-independent R-loop formation was analyzed at both sequences by in vitro transcription of bacterial plasmid templates. Stable R-loops induce a topological change that reduces mobility in native agarose gel electrophoresis (Ginno et al., 2012). As expected, mAIRN but not ECFP transcription resulted in RNase H-sensitive R-loop formation in vitro (Figure 1B).
Figure 1. An episomal system to study transcription-replication conflicts.
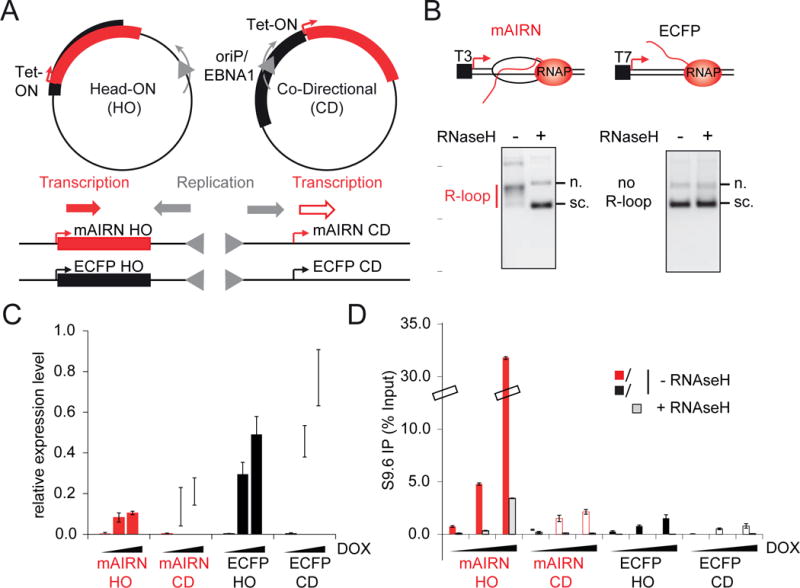
A) Schematic representation of the constructs. If not otherwise stated, clone #2 cells were used for analyses throughout this study (see Figure S1A–C).
B) R-loop formation at the mAIRN sequence in vitro. Plasmids were transcribed in vitro, treated as indicated with RNase H and then visualized by native agarose gel electrophoresis; n. nicked, s.c. supercoiled.
C) RT-qPCR analysis of mAIRN and ECFP HO/CD-induced transcription. RNA was extracted from clone #1 cells 72h after treatment with 0, 100 or 1000 ng/mL DOX. Gene expression was normalized relative to β-actin. The bars indicate mean and standard deviations between biological replicates (n=3).
D) DRIP-qPCR analysis of mAIRN and ECFP HO and CD constructs. Cells were treated with 0, 100 or 1000 ng/mL DOX for 72h and harvested for DRIP. Statistics as in C (n=2).
We next introduced these constructs into human embryonic kidney (HEK293) cells expressing the tetracycline (Tet)-regulated transactivator to control transcription of the mAIRN and ECFP sequences with doxycycline (DOX). We generated stable cell lines maintaining 10 to 150 plasmid copies per cell with >90% efficiency per generation (Figure S1A–C), a rate of plasmid loss consistent with other oriP/EBNA1-based vectors (Leight and Sugden, 2001). Reverse-transcription quantitative PCR (RT-qPCR) revealed dose-dependent transcriptional activation of Tet-ON controlled sequences in all cell lines (Figure 1C, Figure S1D–G). Interestingly, transcription through both sequences was reduced in the HO orientation compared to the CD orientation, suggesting HO conflicts inhibit RNAP II transcription. Independent of orientation, transcription was significantly higher in ECFP sequences than the R-loop forming mAIRN sequences (Figure 1C and Figure S1D–G). This could be caused by differences in mRNA turnover or R-loop formation.
To determine if transcription induces R-loop formation on the mAIRN sequence in cells, we performed DNA-RNA immunoprecipitation (DRIP) and qPCR on the plasmid using the RNA-DNA hybrid-specific S9.6 antibody (Boguslawski et al., 1986). The mAIRN HO cells exhibited robust RNase H-sensitive RNA-DNA hybrid formation upon DOX addition (Figure 1D, mAIRN HO). Surprisingly, RNA-DNA hybrids were poorly induced in the mAIRN CD cells (Figure 1D). Hybrids also formed predominantly on the mAIRN transcription unit on both constructs, with upstream and downstream regions showing only minor hybrid induction (Figure S1H, I). Thus, RNA-DNA hybrids were specifically enriched on the mAIRN HO transcription unit, despite the same promoter driving transcription of the same sequence in mAIRN CD cells. This finding suggests that the orientation with which a replication fork approaches the mAIRN transcription unit critically affects hybrid formation or hybrid stability on the plasmid.
The orientation of transcription and replication affects RNA-DNA hybrid levels
To further test our hypothesis that DNA replication alters RNA-DNA hybrid dynamics, we synchronized cells with a single thymidine block and compared hybrid levels in asynchronous and G1/S arrested cells (Figure 2A). If the observed difference in hybrid levels depends on replication, we reasoned arresting cells at the G1/S transition should alleviate the difference. We confirmed successful arrest and transcriptional induction by flow cytometry and RT-qPCR (Figure S2A–C). As previously noted, hybrid levels were greater on the mAIRN HO plasmid than the mAIRN CD plasmid in asynchronous cells (Figure 2B, ASYN). G1/S arrest reduced hybrids on the HO plasmid and increased hybrids on the CD plasmid. Strikingly, this block to replication completely neutralized the orientation-dependent difference in hybrid levels (Figure 2B, G1/S).
Figure 2. The orientation of transcription and replication affects RNA-DNA hybrid levels.
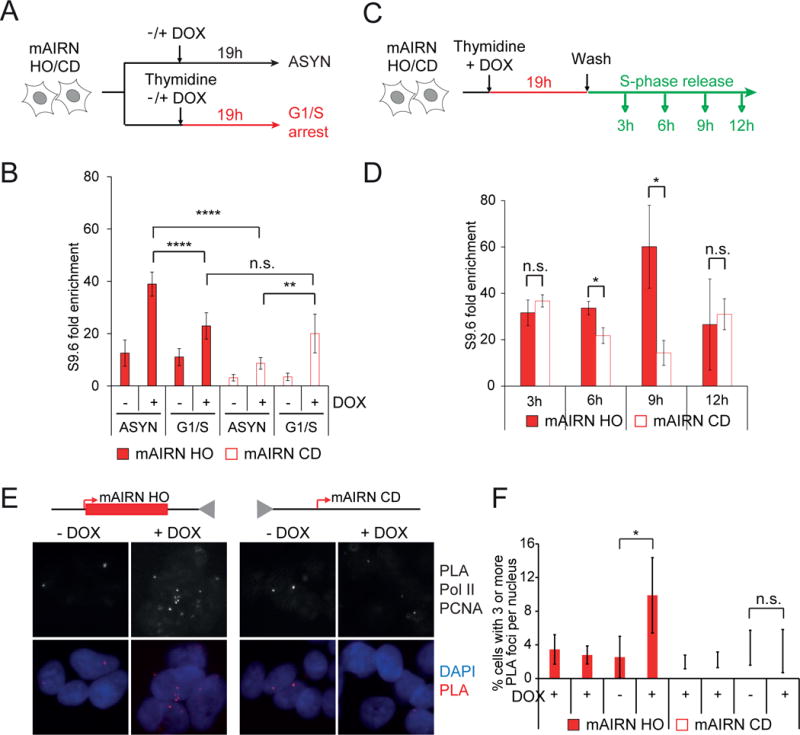
A) Schematic for the thymidine block experiment.
B) DRIP-qPCR analysis of mAIRN HO and CD cells after G1/S arrest with 0 or 1000ng/ml DOX. As a control, asynchronously growing cells were harvested for DRIP (ASYN). The DRIP signals were normalized and shown as fold enrichment to the non R-loop forming ZNF544 locus. The bars indicate mean and standard deviations between biological replicates (n=7). **p<0.01, ****p<0.0001. Unpaired Student’s t-test.
C) Schematic for the single-thymidine block and release experiment.
D) DRIP-qPCR analysis of mAIRN HO and CD cells after G1/S arrest for 19h and release into S-phase for 3, 6, 9, and 12h with 1000 ng/mL DOX. DRIP signals were normalized and shown as in B). Statistics as in B (n=3). *p<0.05, n.s. not significant.
E) Representative images and F) quantification of the percent of cells with ≥3 RNAP II-PCNA PLA foci per nucleus. RNAP II alone and PCNA alone are single-antibody controls from cells treated with 1000 ng/mL DOX for 24 hours. Statistics as in B) (n ≥ 3). n.s. not significant. *p<0.05. Scale bar: 10 μm.
We then monitored hybrid levels at different times after release from the thymidine block (Figure 2C). There was no difference in hybrid levels early (3h) after release, consistent with replication of the oriP/EBNA1 origin in mid to late S-phase (Zhou et al., 2009). A small but significant enrichment of hybrids was detected on mAIRN HO construct at 6h.
At 9h, hybrid levels further increased in the HO orientation and decreased in the CD orientation. Notably, hybrids returned to pre-replicative levels after 12h when most cells finished DNA replication (Figure 2D and Figure S2A, B). These observations strongly suggest replication fork progression increases co-transcriptional hybrid levels in the HO orientation, but decreases hybrid levels in the CD orientation. Thus, we conclude the replisome is an orientation-dependent regulator of RNA-DNA hybrids in our episomal system.
R-loops may accumulate in the HO orientation if the replication fork stalls at the RNA-DNA hybrid containing RNAP complex and fails to complete plasmid replication. We thus monitored interactions between the transcription and replication machineries using the proximity ligation assay (PLA). Antibodies against RNAP II and PCNA were used to mark transcription complexes and replication forks, respectively (Figure 2E). In pre-extracted mAIRN HO cells, the fraction of cells containing ≥3 PLA foci (RNAP II and PCNA interaction) increased approximately 4-fold upon DOX induction. Strikingly, no change was detected in the CD orientation (Figure 2F). This finding suggests that persistent collisions arise from HO but not CD TRCs.
R-loops are enriched at HO regions of the human genome
To test the generality of our conclusions from the plasmid system, we asked if TRC orientation modulates RNA-DNA hybrid levels around replication origins in the native genomic context. To do so, we performed DRIP with next generation sequencing (DRIP-Seq) to map R-loops genome-wide in unperturbed HeLa cells. We observed 15,833 DRIP peaks primarily in genic regions (Figure S3A–B) and confirmed enrichment at some of these sites by qPCR (Figure S3C). These data are in line with previous DRIP-Seq experiments performed in Ntera2 cells, although HeLa cells showed noticeably more DRIP peaks in intergenic areas (27.3%) than Ntera2 cells (8.3%) (Sanz et al., 2016). R-loops were enriched at promoters and terminators (Figure S3D), consistent with their roles in promoter methylation and transcription termination (Ginno et al., 2012; Skourti-Stathaki et al., 2014). We also observed significant overlap between DRIP peaks and regions of GC-skew, consistent with this strand asymmetry driving R-loop formation (Ginno et al., 2013) (Figure S3E).
Next, we used published Okazaki fragment sequencing (OK-Seq) data from HeLa cells to map active replication origins (Petryk et al., 2016). We focused on origins in expressed genes defined by an existing Global Run-On Sequencing (GRO-Seq) dataset from the same cell line (Andersson et al., 2014). Transcription through genes is predominantly unidirectional, but replication origins initiate bi-directionally. Thus, each genic origin has the potential for both an HO and a CD collision. This arrangement provides a powerful natural experiment to test how collision orientation affects RNA-DNA hybrid levels by measuring DRIP-Seq signal around each origin. RNA-DNA hybrids tend to be high at promoters and gene terminators (Sanz et al., 2016) (Figure S3D). Thus, we excluded origins where the edge of a 24kb window lay within 5kb of these regulatory regions, ensuring each collision pair occurred within homogenous regions of the same gene body. 2,169 origins within 1,259 genes met these criteria, showing the expected change of replication fork directionality (RFD) and uniform transcription directionality across the 24kb windows (Figure 3B and Supplemental Table S3).
Figure 3. R-loops are enriched at HO regions of the genome.
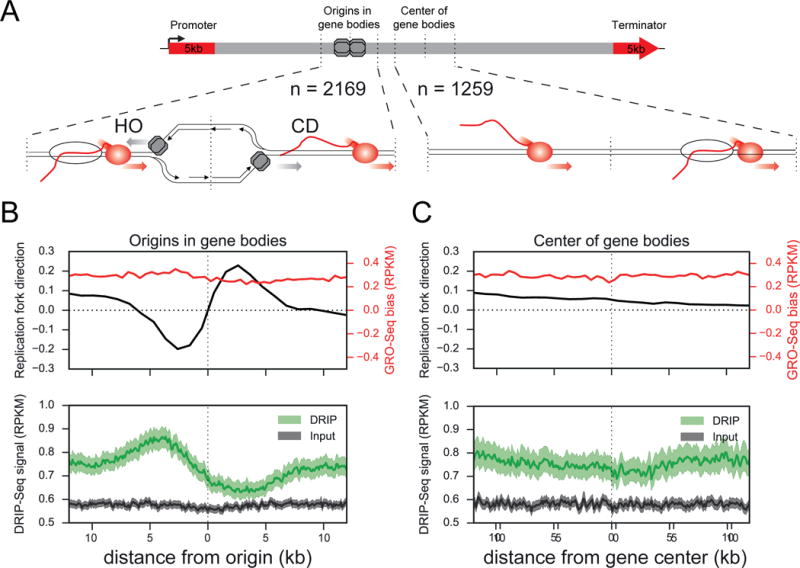
A) Diagram of genic origins of replication or centered control regions from the same gene bodies. Windows around regions are 24kb in size and at least 5kb from promoters and terminators.
B–C) Mean replication fork direction (black) and transcription (red) directionality bias across origins in gene bodies (B) or gene centers (C). IP (green) and input (grey) signal from DRIP-Seq shows R-loops accumulate on the HO side of origins in gene bodies compared to the CD side (p=1.1e-23, Wilcoxon singed-rank test). No corresponding pattern in DRIP-Seq signal is seen for these gene centers (p=0.27, Wilcoxon signed-rank test). Error bands represent a 95% confidence interval as determined by a bootstrap of the mean.
Strikingly, DRIP-Seq signal around these 2,169 origins was significantly higher in the HO region than in the adjacent CD region (Figure 3B, p = 1.1e-23, Wilcoxon signed-rank test). Because the HO collision always lies upstream of the CD collision, we ensured this pattern in hybrid signal was specific to origins and not due to a general decrease of hybrids across gene bodies. To do so, we aggregated DRIP-Seq signal in 24kb windows around the centers of the same 1,259 origin-containing genes. These regions showed no changes in RFD and thus were not enriched for replication initiation sites (Figure 3C). No difference was observed in hybrid levels across these control regions (Figure 3C, p = 0.27, Wilcoxon signed-rank test), indicating the observed pattern is origin-specific. Elevated hybrid levels in HO regions also cannot be explained by GC content or chromatin accessibility (by DNAseI-Seq), which were uniform across both origin regions and gene centers (Figure S3F). Histone modifications showed no bias throughout these regions and reflect expected modifications for active gene bodies (Figure S3F). Lastly, the origins were evenly distributed across the gene bodies, showing no strong bias towards the 5′ or 3′ ends (Figure S3G). Thus, changes in origin positioning or chromatin environment cannot account for the observed differences in hybrid levels. Interestingly, GRO-Seq and mNet-Seq analysis of RNAP II (pSer2-CTD) across origins showed enrichment of nascent transcripts and elongating RNAP II at the HO side of these origins (Figure S3H, p = 9.3e-22 GRO-Seq, p =1.2e-109 mNet-Seq, Wilcoxon signed-rank test), indicative of preferential RNAP II stalling in this orientation, whereas no strong difference was observed across the control regions (Figure S3H, p = 0.21 for GRO-Seq, p = 4.8e-3 mNet-Seq, Wilcoxon signed-rank test). As an independent approach, we examined hybrid distribution in a 24kb window around 1084 origins with HO collisions on both sides (HO-HO), or 1025 origins with CD collisions on both sides (CD-CD) (Figure S4A, B). These origins lie close to different transcription units on both sides, so we accounted for potential differences by matching these regions on factors known to correlate with hybrid formation, including transcription levels, replication timing or GC-content. Origin-proximal regions classified as HO-HO showed a significant increase in DRIP signal relative to CD-CD regions on both sides of the origin (p < 1.0e-6, one tailed bootstrap of the mean) (Figure S4C, D). These findings demonstrate that regions predicted to undergo HO collisions in the genome have a higher frequency of RNA-DNA hybrids than regions predicted to undergo CD collisions and are consistent with our model that HO oriented collisions are more persistent and induce R-loops, whereas CD collisions reduce origin-proximal R-loop levels.
Perturbation of the replication program increases genomic levels of R-loops
Recent analysis of high resolution OK-Seq data indicates that replication forks are significantly co-oriented with transcription complexes in the human genome (Petryk et al., 2016). Our results predict this bias helps minimize genomic R-loops in S-phase and that disrupting it would promote R-loop formation genome-wide. To test this hypothesis, we first reduced TRCs by halting DNA replication in cells using high doses of hydroxyurea (HU) or the DNA polymerase inhibitor aphidicolin (APH) for 1h. As most TRCs are expected to occur in the CD orientation, these perturbations should primarily prevent R-loop clearance (Figure S5A–B). Indeed, we observed an increase in RNaseH1-sensitive nuclear RNA-DNA hybrids after HU or APH treatment by S9.6 immunofluorescence (Figure 4A,B) and a decrease of RNAP II-PCNA PLA foci to background levels (Figure 4C). This result suggests active replication forks clear RNA-DNA hybrids under normal conditions, consistent with the co-directional bias of the human genome.
Figure 4. Perturbation of the replication program increases genomic levels of R-loops.
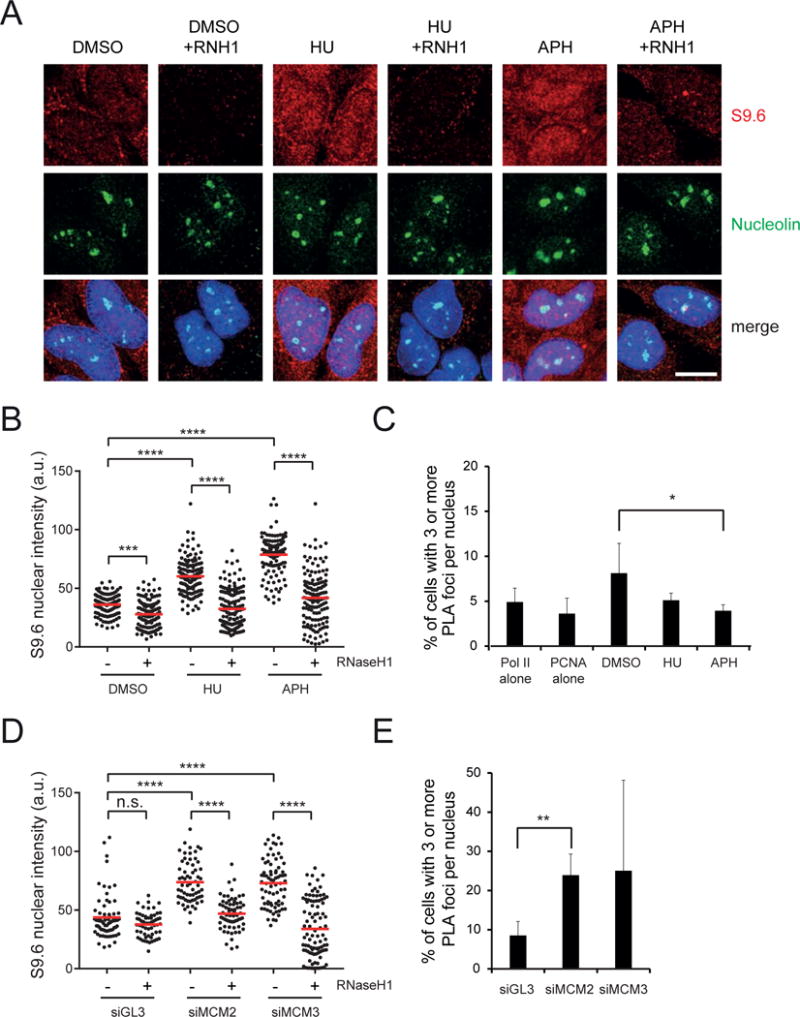
A) Immunostaining and B) quantification of S9.6 nuclear signal in HeLa cells treated with 3mM HU or 2μM aphidicolin for 1h. The nucleus was co-stained with nucleolin antibody and treated with RNaseH1 as indicated. The mean value is shown as a red line. a.u. = arbitrary units. ***p<0.001. ****p<0.0001. One-way ANOVA test (n≥100). Scale bar: 15 μm.
C) Percentage of cells with ≥ 3 RNA RNAP II - PCNA PLA foci under the same conditions as in A). RNAP II alone and PCNA alone are single-antibody controls from HeLa cells treated with DMSO for 1h. The bars indicate mean and standard deviations between biological replicates (n ≥ 3). *p<0.05. Unpaired Student’s t-test.
D) Immunostaining and quantification of S9.6 nuclear signal in HeLa cells transfected with indicated siRNAs and fixed after 48h. The nucleus was co-stained with nucleolin antibody and treated with RNaseH1 as indicated. The mean value is shown as a red line. a.u. = arbitrary units. ****p<0.0001. n.s. not significant. One-way ANOVA test (n≥100).
E) Percentage of cells with ≥ 3 RNAP II – PCNA PLA foci in HeLa cells under the same conditions as in D). The bars indicate mean and standard deviations between biological replicates (n ≥ 3). **p<0.01. Unpaired Student’s t-test.
Next, we asked if disrupting this co-orientation bias and promoting HO collisions in the genome would result in higher levels of R-loops. We reduced origin firing by partially depleting Mcm2-7 complexes and monitored RNA-DNA hybrid levels and RNAP II-PCNA PLA interactions. Mcm2-7 complexes are loaded in excess of the number of origins normally used, licensing dormant origins that can rescue stalled forks and allow completion of DNA synthesis under conditions of replication stress (Ibarra et al., 2008). Perturbing MCM complexes changes origin usage patterns (Kunnev et al., 2015) and should force some forks to approach transcription complexes with a different orientation, thereby promoting HO collisions (Hills and Diffley, 2014) (Figure S5C). Consistent with this hypothesis, small interfering (si)RNA-mediated knockdown of Mcm2 or Mcm3 resulted in a significant increase in cells containing ≥3 RNAP II-PCNA PLA foci (Figure 4E). As predicted, these perturbations also increased nuclear RNA-DNA hybrids to an extent similar to that observed upon depletion of SRSF1 or BRCA2, two factors known to prevent R-loop formation (Bhatia et al., 2014; Li and Manley, 2005) (Figure 4D and Figure S5D). Similar results were observed in two different cell lines and with independent siRNAs (Figure S5D–F), and partial Mcm2 or Mcm3 depletion did not affect cell cycle progression (Figure S5G). As an independent approach, we inhibited the Cdc7 kinase, which is essential for replication initiation (Montagnoli et al., 2008). Although this inhibitor changes origin usage by targeting a different step of the replication cycle than MCM depletion, it still significantly increased nuclear RNA-DNA hybrids and the fraction of cells containing ≥3 RNAP II-PCNA PLA foci (Figure S5I, J). The highest dose of this inhibitor also reduced Cdk9-dependent RNAP II phosphorylation, necessary for transcription elongation (Figure S5H). As other Cdk9 inhibitors like 5,6-Dichloro-1-β-D-ribofuranosylbenzimidazole are known to decrease hybrid levels (Sanz et al., 2016), the increase observed with the Cdc7 inhibitor is likely replication-specific and not an off-target effect on transcription elongation. In all cases, the S9.6 signal showed the same changes in the nucleolus, was reversed by RNaseH1 treatment and confirmed by a slot-blot assay (Figure 4A, B, D and Figure S5I, K, L, M). These findings suggest that proper execution of the replication program is critical for R-loop homeostasis and reinforce our finding that replication fork progression modulates R-loop levels in an orientation-specific manner.
R-loop formation exacerbates the effect of TRCs on plasmid instability
Because increased R-loop formation and TRCs are associated with DNA damage, we asked whether TRC orientation or R-loop formation affects plasmid stability. At the highest concentration of DOX, mAIRN HO plasmid copy number decreased to ~27% of that observed without DOX stimulation, while mAIRN CD plasmid copy number decreased to ~50% (Figure 5A). We only observed this effect after prolonged DOX induction (≥ 24h), suggesting significant plasmid loss requires cell cycle progression (Figure S6A–B). Increased transcription-induced plasmid loss in mAIRN HO versus CD cells was confirmed by Southern blot (Figure S6C–D). Orientation also affected ECFP plasmid stability (Figure 5A, ~42% HO and ~83% CD). However even at lower transcription levels, the R-loop prone mAIRN sequence showed greater plasmid loss.
Figure 5. R-loop formation exacerbates the effect of TRCs on plasmid instability.
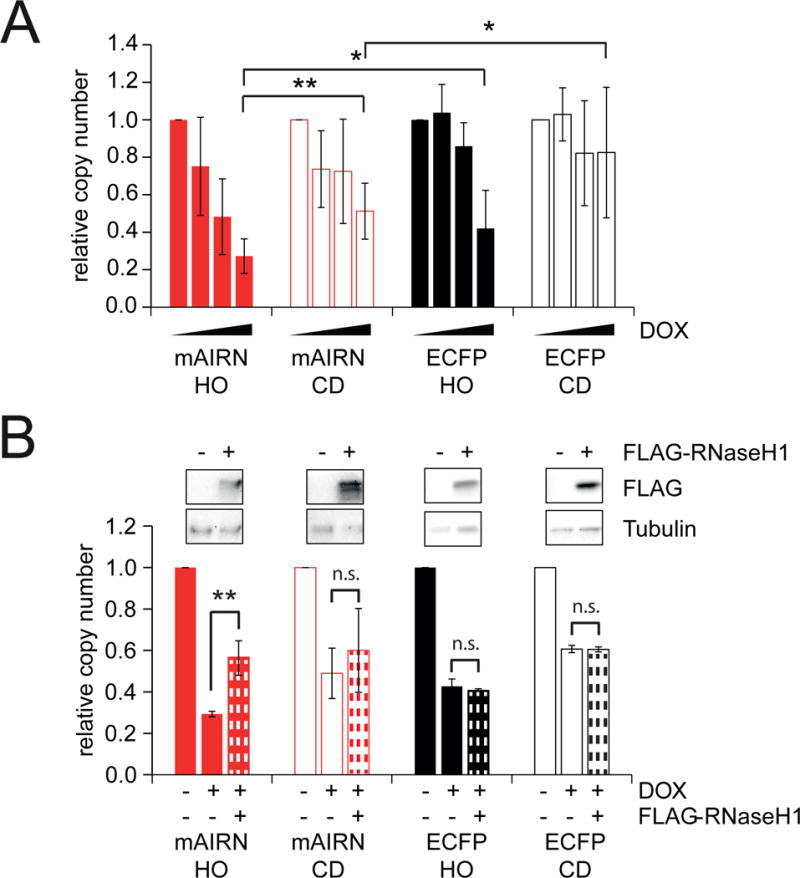
A) mAIRN/ECFP HO and CD cells were treated with 0, 50, 100, or 1000 ng/mL DOX for 72h. The relative plasmid copy number (normalized to 0 ng/mL DOX) was determined by quantitative PCR on genomic DNA. The bars indicate mean and standard deviations between biological replicates (n ≥ 3). *p<0.05. **p<0.01. Unpaired Student’s t-test.
B) mAIRN and ECFP HO and CD cells were treated with 0 or 1000 ng/mL DOX. After 24h, cells were transfected with a vector expressing FLAG-tagged RNaseH1 or an empty vector control in the absence or presence of 1000 ng/mL DOX for further 48h. Plasmid copy number was determined as in A) (n=2–4). ** p< 0.01, n.s. not significant. Unpaired Student’s t-test.
To test whether hybrid formation explains these differences in plasmid stability, we assessed plasmid loss in cells transfected with a control or RNaseH1 overexpression vector (Figure 5B). RNaseH1 overexpression did not noticeably affect cell cycle progression (Figure S6E–F). Strikingly, RNaseH1 partially reduced plasmid instability in mAIRN HO cells, but had no significant effect in mAIRN CD cells or the ECFP control constructs. This is consistent with robust R-loop formation specifically in mAIRN HO cells (Figure 1D) and suggests a significant portion of the plasmid loss in this orientation is R-loop dependent. Together, these results indicate HO collisions are more detrimental than CD collisions, particularly at sequences prone to R-loop formation.
HO and CD TRCs are differentially processed
Next, we sought to determine whether DNA damage from TRCs causes plasmid instability by analyzing the integrity of extracted circular plasmid DNA by Southern blot analysis. Strikingly, DOX treatment induced the formation of low molecular weight DNA fragments in both mAIRN HO and CD cells, suggesting plasmids undergo degradation (Figure 6A, B). In contrast, no such fragments were observed from the non-R-loop forming ECFP constructs (Figure 6C, D). Importantly, DOX induction also caused conversion of the supercoiled plasmid to a nicked form in mAIRN CD cells, but little additional change was observed in the mAIRN HO cells (Figure 6A, B). These results show HO and CD collisions with an R-loop induce DNA breaks and are processed in a distinct manner. We conclude that TRCs are exacerbated by R-loops and represent a potent endogenous source of DNA breaks.
Figure 6. HO and CD TRCs are differentially processed.
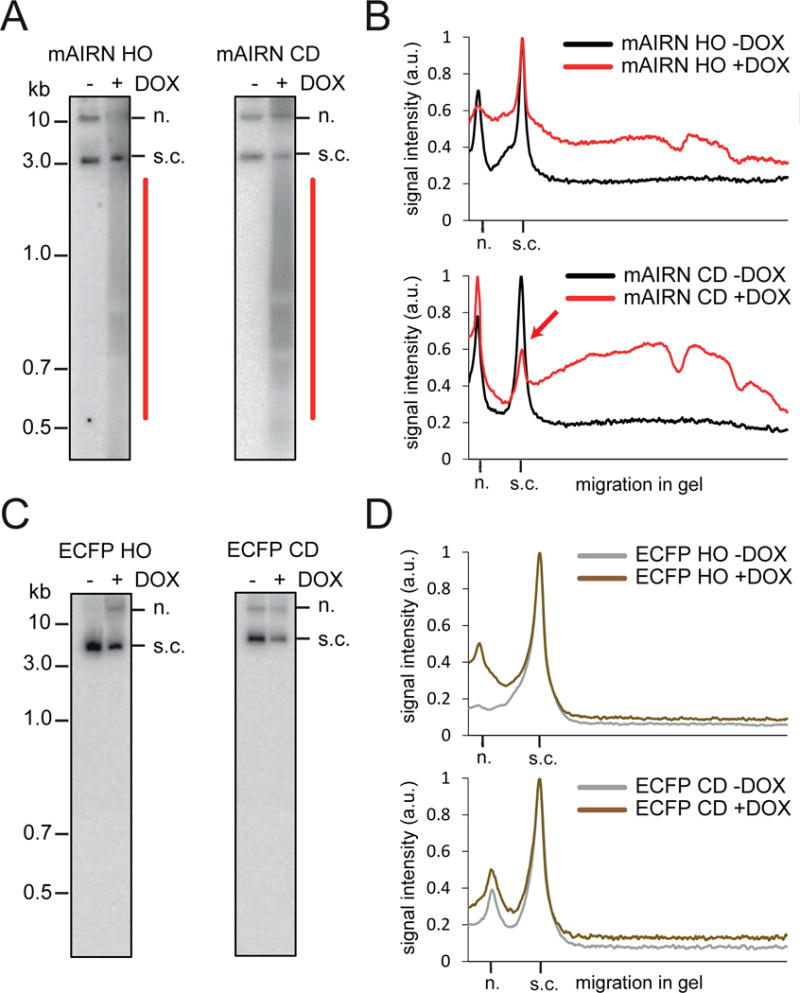
A) Southern blot images and B) profile analyses of HIRT-extracted mAIRN HO/CD plasmid constructs after treatment with 0 or 1000ng/ml DOX for 24h. The mAIRN CD blot is shown at a shorter exposure compared to mAIRN HO to account for the different plasmid amounts present in both cell populations. Signal intensities were normalized to the band with the highest intensity and plotted against the migration in the gel. a.u. arbitrary units. n. nicked. s.c. supercoiled.
C–D) Same as in A) and B) of HIRT-extracted ECFP HO/CD constructs.
HO and CD conflicts with R-loops induce distinct DNA damage responses
Because HO and CD constructs form distinct intermediates upon DOX induction, we next asked whether they trigger different signaling pathways. To do so, we monitored DDR activation, first measuring H2AX phosphorylation (γ-H2AX). Interestingly, immunofluorescence and western blot analysis showed that γ-H2AX was induced in the mAIRN HO cells, but not in the mAIRN CD cells, even when the mAIRN CD cells carried ~5-fold more plasmids than the mAIRN HO cells (50–100 vs ~10–20 copies per cell) (Figure 7A,B and Figure S7A). We could detect γ-H2AX induction in an mAIRN CD cell line with an even greater copy number (~140 copies) (Figure S7A), indicating a greater number of CD-TRCs can induce a detectable γ-H2AX response. The non-R-loop forming ECFP cells showed no significant induction of γ-H2AX in either orientation (Figure 7B), suggesting both the R-loop forming mAIRN sequence and HO orientation together promote γ-H2AX at collisions.
Figure 7. HO and CD conflicts with R-loops induce DNA breaks and distinct DNA damage responses.
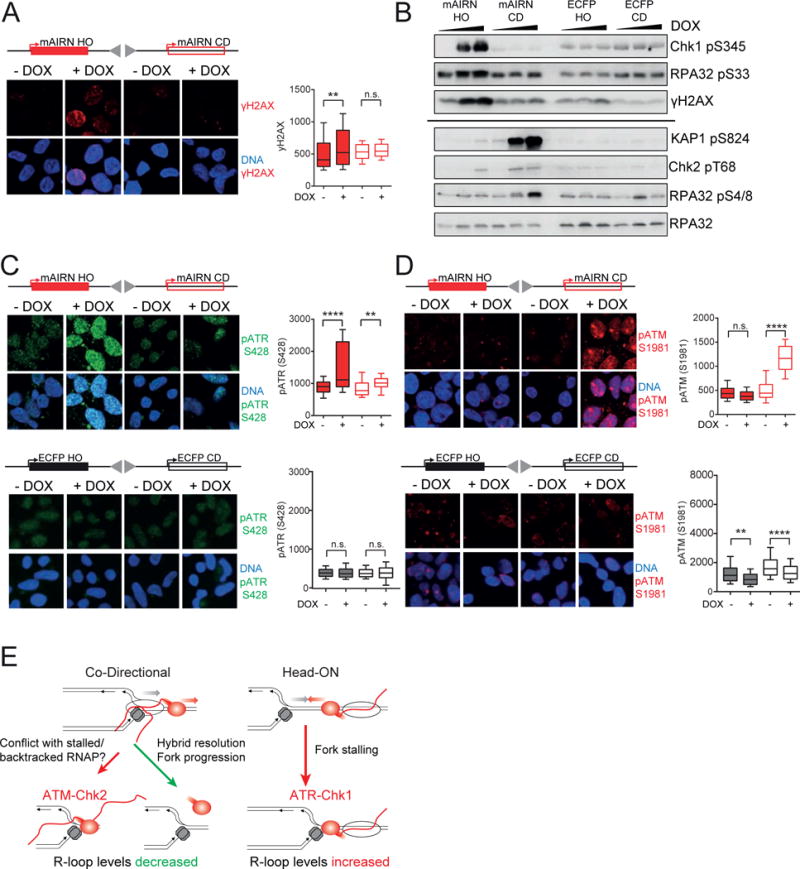
A) Immunostaining for γH2AX in mAIRN HO and CD cells treated with 0 or 1000 ng/mL DOX for 24h. Box and whisker plots show the 10–90 percentile. a.u. = arbitrary units. n.s. not significant. **p<0.01. ****p<0.0001. One-way ANOVA test (n ≥ 100). mAIRN HO clone #2 cells with 10–20 plasmid copies and mAIRN CD clone #2 cells with 50–100 copies per cell were analyzed. Scale bar: 15 μm.
B) mAIRN HO/CD or ECFP HO/CD cells were treated with 0, 100 or 1000 ng/mL DOX for 24h. Equal protein amounts from whole cell lysates were analyzed by immunoblotting with the indicated antibodies. Copy numbers for mAIRN HO and mAIRN CD cells were the same as in A). ECFP HO clone #2 and ECFP CD clone #2 cells had 10–20 and 100–150 copies per cell, respectively. The same samples were run on two independent gels as indicated by a black line.
C) Immunostaining for ATR pS428 in mAIRN HO/CD and ECFP HO/CD cells treated with 0 or 1000 ng/mL DOX for 24h. Box and whisker plots show the 10–90 percentile. a.u. = arbitrary units. n.s. not significant. **p<0.01. ****p<0.0001. One-way ANOVA test (n ≥ 100). Copy numbers for mAIRN HO/CD and ECFP HO/CD cells were the same as in A) and B). Scale bar: 15 μm.
D) Immunostaining for ATM pS1981 in mAIRN HO/CD and ECFP HO/CD cells treated with 0 or 1000 ng/mL DOX for 24h. Box and whisker plots show the 10–90 percentile. a.u. = arbitrary units. n.s. not significant. **p<0.01. ****p<0.0001. One-way ANOVA test (n ≥ 100). Copy numbers for mAIRN HO/CD and ECFP HO/CD cells were the same as in A) and B). Scale bar: 15 μm.
E) Model for how head-on and co-directional transcription-replication conflicts regulate R-loop homeostasis and induce distinct DNA damage responses in human cells.
We also monitored activation of the DDR kinases ATR (ataxia telangiectasia-mutated [ATM] and rad3-related) and ATM. Whereas ATM is primarily activated by DSBs, ATR responds to stretches of RPA-coated ssDNA at stalled replication forks (Cimprich and Cortez, 2008). Strikingly, transcription of the mAIRN HO construct induced robust ATR S428 phosphorylation without affecting ATM S1981 autophosphorylation. In contrast, transcription in the mAIRN CD cells resulted in strong ATM autophosphorylation, but had a minor effect on ATR phosphorylation (Figure 7C, D and Figure S7B–C). Importantly, the ATM targets Chk2, KAP1 S824 and RPA32 S4/8 were preferentially phosphorylated in mAIRN CD cells, whereas the ATR effector kinase Chk1 and the ATR target RPA32 S33 were preferentially phosphorylated in mAIRN HO cells (Figure 7B). These effects were specific to the R-loop forming mAIRN constructs, as ATR, ATM and their downstream targets were not significantly phosphorylated in ECFP HO/CD cells (Figure 7B–D). We also confirmed orientation-specific effects on ATM and ATR phosphorylation using an independent set of clones with comparable copy numbers (Figure S7B, C). Taken together, these findings suggest collisions between replication forks and R-loop associated RNAPII, but not RNAPII alone, induce distinct DDRs with HO collisions activating ATR and CD collisions activating ATM.
Discussion
We have established a cell-based system to reliably induce TRCs at a defined site, and used it to compare the effects of HO and CD collisions in human cells. Unexpectedly, we observed important differences between collisions that involve an R-loop and those that do not. Constructs prone to R-loop formation are processed and activate DNA damage response pathways in orientation-specific ways. Thus, cells differentially sense and respond to HO and CD collisions between replication forks and co-transcriptional R-loops, activating ATR and ATM respectively. Furthermore, our data show that R-loop levels themselves depend on the orientation of the TRC. HO collisions promote R-loop formation, while CD collisions resolve R-loops. Overall, our results provide mechanistic insights into how R-loops threaten genome stability and the tradeoffs cells make to maintain physiological R-loops.
DNA Damage Signaling and DNA Processing at HO versus CD TRCs
In our system, collision orientation and R-loop formation are the two critical factors that define highly distinct cellular responses to TRCs. Constructs without an R-loop do exhibit some instability, but not plasmid processing or DDR activation. By contrast, sequences prone to R-loop formation exhibit enhanced plasmid instability and processing, while activating distinct DDR and processing events in the HO and CD orientations. The HO orientation robustly activates the ATR pathway, reflected by increased phosphorylation of ATR and its downstream targets Chk1, RPA S33 and H2AX. This suggests R-loop forming transcription complexes block replication fork progression in this orientation, generating ssDNA at the stalled fork (Byun et al., 2005). An intriguing alternative is that displaced ssDNA in the hybrid structure contributes to ATR activation. We propose stalled forks at R-loop-containing transcription complexes fail to complete replication, leading to dramatic plasmid loss. Ultimately, replication fork processing or fork collapse would form breaks, consistent with the modest plasmid degradation observed.
CD-oriented R-loop forming sequences robustly activate ATM and its downstream targets Chk2, KAP1 and RPA S4/8. Surprisingly, γ-H2AX is low in these cells. The reasons for this are unclear, but we speculate there is a lack of H2AX molecules in the highly transcribed mAIRN CD plasmid sequence. In fact, γ-H2AX modification is strongly diminished over highly transcribed genes in yeast (Lee et al., 2014) and we achieved much higher transcription levels with the mAIRN CD cells than with the mAIRN HO cells (Figure 1C). Studies with human cells, however, suggest γ-H2AX can still be enriched at highly expressed regions on the genome (Kantidakis et al., 2016; Tuduri et al., 2009), so our data may be explained by less stably assembled chromatin on the plasmid than on the genome.
Regardless of γ-H2AX status, ATM activation suggests CD collisions can form DSBs. This is consistent with conversion of supercoiled DNA to smaller DNA fragments, damage that could account for plasmid instability in this orientation. DSBs may form when the replication fork collides with a stable state of the transcription machinery associated with hybrids. Paused or arrested RNAP complexes can backtrack along the template, resulting in a highly stable, transcriptionally inactive conformation (Nudler, 2012) that can induce DSBs on bacterial plasmid templates in the CD orientation (Dutta et al., 2011). Thus, the hybrid may cause fork arrest, DSB formation and ATM activation through the induction of polymerase backtracking, which could persist long after the original hybrid is resolved.
Our work demonstrates that R-loop formation changes how TRCs drive instability at both HO and CD collisions. It also raises questions about how cells differentially sense and process TRCs with an R-loop. Further studies will determine the structural intermediates formed upon HO and CD TRCs with an R-loop, and the involvement of other factors implicated in processing RNA-DNA hybrids into DSBs such as the transcription-coupled nucleotide excision repair endonucleases (Sollier et al., 2014; Stork et al., 2016).
The Impact of Collision Orientation on Hybrid Formation
While R-loops have previously been thought to form prior to collisions, we unexpectedly find replication itself modulates hybrid formation, resolving hybrids in CD encounters and promoting them in the HO orientation. HO collisions may block transcription, confining the nascent RNA strand close to the DNA template and promoting RNA-DNA hybrid formation. Converging transcription and replication machineries may also create topological stress, exacerbating RNAP stalling and hybrid formation (García-Muse and Aguilera, 2016). Surprisingly, in spite of their HO orientation, few hybrids were observed in ECFP HO cells. Thus, we suggest robust formation of R-loops requires both a HO collision and an R-loop prone sequence.
A benefit of our system is that it isolates CD and HO collisions between R-loops and a single replication fork, which is difficult to do on the genome. This precise control allowed us to show that CD TRCs decrease hybrid levels (Figure 1D), consistent with reduced hybrid formation in genomic regions predicted to have a CD bias (Figure 3). This finding suggests replication presents both a mechanism for R-loop resolution and tolerance and a threat to genome stability. While many replisome-associated factors have hybrid-resolving activity (Alzu et al., 2012; García-Rubio et al., 2015; Schwab et al., 2015; Yüce and West, 2013), replicative helicases from all domains of life can unwind RNA-DNA hybrids in a 3′ to 5′ orientation (Shin and Kelman, 2006). This biochemical activity and localization of both the MCM complex and CD-oriented hybrids to the leading strand (Fu et al., 2011) suggests an intriguing alternative: the Mcm2-7 helicase itself may directly resolve RNA-DNA hybrids in the CD orientation.
Because replication forks must access the entire genome, this mechanism could be a safeguard that resolves R-loops in genomic regions inaccessible to other R-loop resolution factors, and additionally allows cells to tolerate physiological R-loops without impacting genome stability. Furthermore, replisome-mediated hybrid clearance could rescue replication forks stalled at R-loops in the HO orientation, where an approaching replication fork from the CD orientation could unwind the hybrid, remove the block and finish DNA synthesis. This resolution mechanism may also explain why persistent TRCs are relatively rare in highly transcribed genes near origins.
It is curious that CD collisions with R-loops on the genome remove these genome-destabilizing structures, but on our plasmid system create potentially toxic DSBs. A strong R-loop seeding sequence and high transcription on our constructs could lead to R-loops with higher half-lives than previously observed (Sanz et al., 2016). This could lead to particularly severe CD collisions at stalled or backtracked polymerases. In normal genomes, spatiotemporal separation of replication and transcription may make collisions with such R-loop prone genes rare events. However, if cancer genomes lose this separation, it would promote such pathological collisions and convert a protective R-loop resolution mechanism into an endogenous source of DSBs.
Impact of Replication and Genome Organization on R-loop Levels
Finally, replication slowdown or deregulated origin firing induces hybrid accumulation. Thus, proper execution of the replication program can suppress R-loop accumulation. This replication-dependent control of hybrid levels extends our understanding of replication-stress induced genome instability. Replication fork slowdown or stalling activates dormant replication origins near the stalled fork to complete DNA synthesis (Yekezare et al., 2013). Cancer cells experiencing oncogene activation or nucleotide depletion also activate dormant origins (Bartkova et al., 2006; Bester et al., 2011). In a genome biased toward CD collisions, this “unscheduled” origin firing may come at the cost of HO TRCs and accumulation of genome-destabilizing R-loops, possibly saturating other R-loop resolution pathways. The co-orientation bias of the human genome may therefore help to coordinate replication with transcription, minimize deleterious R-loops, and maintain genomic stability.
Summary
In this study, we show that R-loops contribute more to TRC-induced genome stability than transcription alone. Replication fork progression can both promote and resolve R-loops, with both protective and harmful consequences for genome instability. The co-directional bias of the genome and availability of backup origins helps cells tolerate physiological R-loops and avoid their harmful effects. When conflicts do occur, cells employ different signaling pathways to respond to and resolve them, though the structural intermediates formed during TRC resolution remain unclear. Our episomal system will be instrumental in resolving these questions, and in further exploring how mammalian cells process HO and CD TRCs.
STAR Methods
Contact for Reagent and Resource Sharing
Further information and requests for reagents should be directed to and will be fulfilled by the Lead Contact, Karlene Cimprich (cimprich@stanford.edu).
Experimental Model and Subject Details
Human embryonic kidney (HEK) cells were used as previous studies showed efficient replication of oriP/EBNA1 plasmids in this cell line (Leight and Sugden, 2001) HEK293 Tet-ON and HeLa cells were cultured in DMEM (GIBCO) supplemented with 10% FBS, 2 mM L-glutamine and penicillin/streptomycin in 5% CO2 at 37°C. To generate monoclonal HEK293-TetON cell lines, cells were transfected with vectors pSH26 (ECFP-HO), pSH27 (ECFP-CD), pSH36 (mAIRN-HO) or pSH37 (mAIRN-CD) and selected with 200 g/ml hygromycin B for 2–3 weeks. Surviving single cell colonies were further expanded and screened for stable maintenance and replication of the episomal DNA by quantitative PCR and Southern blotting. Cells were maintained under selection in 200 g/ml hygromycin B. For cell cycle synchronization experiments, cells were cultured in DMEM supplemented with 2mM thymidine for 19h, washed twice with PBS and released into S-phase with regular DMEM for the indicated time-points.
Method Details
Oligonucleotides and plasmids
Standard techniques were used for cloning of plasmids. Complete lists of oligonucleotides and plasmids used in this study can be found in Tables S1 and S2.
Plasmid and siRNA transfections
FuGENE (Promega) or DharmaFECT (Darmacon) transfection reagents were used for all plasmid and siRNA transfections, respectively, following the manufacturer’s protocol. Transfection reaction mixtures were incubated at room temperature for 20–30min before adding dropwise to cells. Culture media was replaced with fresh media after 16–24h incubation at 37°C.
In vitro transcription for R-loop formation
Plasmid substrates (3 μg) containing the mAIRN or ECFP sequences flanked by oppositely oriented T3 and T7 promoters were in vitro transcribed using T3 or T7 RNA polymerase according to manufacturer’s protocol at 37 °C for 30 min. After heat inactivation at 65°C for 10 min, the sample was spl it in half and incubated with 0.5 g RNase A alone or 0.5 g RNase A and 10U RNase H as a negative control for 30 min at 37°C. After digestion with 20 μg Proteinase K for 30 min at 37°C, R-loop formation causes a characteristic shift in mobility of the plasmid on a 0.9% 1x TBE agarose gel run at 90V for 60 min. Gel was post-stained with ethidium bromide.
Reverse Transcription-qPCR
Cells were harvested and total RNA was isolated using TRIzol reagent following the manufacturer’s protocol. After digestion with RNAse-free DNAse I at 37°C for 30min, reverse transcription was carried out with 1.5 g total RNA with random hexamer primers and SuperScript III Reverse Transcriptase Kit. Equal amounts of cDNA were mixed with iTaq SYBR Green Supermix and run on a Roche LightCycler 480 Instrument II. mRNA expression levels were measured by the change in comparative threshold cycles with primers bAct(F) and bAct(R) in beta-actin cDNA as a reference.
DNA:RNA immunoprecipitation
DRIP was performed as described in Ginno et al., 2012. Briefly, DNA was extracted with phenol/chloroform in phase lock tubes (5Prime), precipitated with EtOH/sodium acetate, washed with 70% EtOH, and resuspended in TE. DNA was digested with EcoRI and XcmI (NEB) restriction enzymes overnight at 37 °C. For RNase H-treated samples, 4 ug of DNA was treated with RNase H overnight at 37 °C. DNA was purified by phenol/chloroform, EtOH/sodium acetate precipitation as described above. 4 μg of DNA was bound with 10 μg of S9.6 antibody in 1 X binding buffer (10 mM NaPO4 pH 7, 140 mM NaCl, 0.05% Triton X-100) overnight at 4°C. Prot ein A/G agarose beads were added for 2 h. Bound beads were washed 3 times in binding buffer and elution was performed in elution buffer (50 mM Tris pH 8, 10 mM EDTA, 0.5% SDS, Proteinase K) for 45 min at 55°C. DNA was purified as described. Quantitative PCR of immunoprecipitated DNA fragments was performed on a Roche LightCycler 480 Instrument II using SYBR-Green master mix (Biorad).
Plasmid copy number
Genomic DNA was isolated from 2–4 × 10⁵ cells. After trypsinization, cells were washed in 1x PBS and resuspended in TE buffer followed by the addition of an equal volume of IRN buffer (50mM Tris-HCl at pH 8, 20 mM EDTA, 0.5 M NaCl), 0.5% SDS and 10 g Proteinase K. After digestion for 1h at 37°C, DNA was extracted w ith phenol/chloroform and digested with 20 g RNase A for 1h at 37°C. After chloroform extracti on, DNA was precipitated with EtOH/sodium acetate, washed with 70% EtOH, and resuspended in TE. DNA was digested with EcoRI (NEB) restriction enzyme overnight at 37°C. The plasmid copy number was analyzed with primer pairs SH62/SH63 and in1(F)/in1(R) amplifying either the oriP region of the plasmid or a region of the genomic beta-actin gene. The relative plasmid copy number was determined by quantitative PCR on a Roche LightCycler 480 Instrument II using SYBR-Green master mix (Biorad) and defined as the ratio of the amount of oriP to the amount of beta-Actin.
HIRT episome extraction
Episomal DNA from HEK293 Tet-ON cells was extracted as previously described with minor modifications (Hirt, 1967). Briefly, 1–2 × 10⁷ cells were resuspended in 2.82 ml of 10 mM Tris-Cl and 10 mM EDTA pH 8 before the addition of 180 l of 10% SDS (final concentration 0.5%). Cells are lysed by inverting the tube 7–10 times and one-quarter volume (750 μl) of 5 M NaCl is added to the cell lysate. The white precipitates forming upon mixing with NaCl were kept at 4° for at least 24 h. Cell debris and genomic DNA were removed by centrifugation for 30 min at 13,700g. Clear supernatant containing episomal DNA was transferred to a new tube and digested with 100 μg/ml Proteinase K overnight at 37°C. DNA was extracted by phenol/chloroform extraction and digested with 20 μg RNase A for 1h at 37°C. DNA was recovered by EtOH/sodium acetate precipitation, washed with 70% EtOH, and resuspended in TE.
Southern blotting
Nucleic acids from genomic DNA and HIRT-extracted episomal DNA preparations were separated on agarose gels and blotted onto Nylon membranes (Hybond N+, GE) by capillary transfer in 1 M ammonium acetate. DNA probes for hybridization were generated using the RadPrime DNA labeling system (Invitrogen) with incorporation of [α−32P]dATP (Perkin-Elmer) according to the instructions of the manufacturer. Images were acquired with the Typhoon 9410 imaging system.
Western blotting
Cells were lysed in RIPA buffer (50mM Tris HCl, pH 7.4, 150mM NaCl, 0.5%deoxycholate, 0.1% sodium dodecyl sulfate, 1% NP-40) containing protease inhibitors (Sigma-Aldrich, Cat#11873580001). Whole cell extracts were separated by electrophoresis, transferred onto polyvinylidene difluoride membranes and blocked in 5% skimmed milk dissolved in 0.1%Tween/TBS. Membranes were incubated with primary antibodies overnight at 4°C followed by washing in 0.1%Tween/TBS. Membranes were incubated with appropriate HRP-linked secondary antibodies at 25°C for 1h and washed thrice prior to signal detection. Membranes were developed by chemiluminescence using ECL reagent.
S9.6 Slot blotting
Genomic DNA was prepared as described in DNA:RNA immunoporecipitation. 250ng or 125ng from each sample was spotted on nylon membranes (Hybond N+, GE) using a slot blot apparatus and vacuum suction. For total DNA control, the membrane was denatured for 10 min in 0.5 M NaOH, 1.5 M NaCl, and neutralized for another 10 min in 1 M NaCl, 0.5 M Tris-HCl pH7.0. Membranes were then UV-crosslinked (0.12J/m2), blocked in 5% milk/TBST, and incubated overnight at 4°C with mouse S9.6 (1:500) or single-strand DNA antibody (1:10,000). Blots were washed 3 times with TBST and secondary antibody (1:10,000 goat anti-mouse HRP) was added for 1 hr at RT.
Immunostaining
Cells were fixed with 4% PFA/PBS (EMS) for 15 min, permeabilized with 0.25% Triton-X 100 for 5 min, washed 3 times in 1X PBS, and blocked in 2% BSA/PBS for 1hr at RT. For S9.6 immunofluorescence, cells were fixed in 100% methanol for 10 min at −20°C, washed 3 times in 1X PBS, pre-treated with 6 μg/ml of enzyme for 45 minutes at 37°C in 10 mM Tris-HCl pH 7.5 supplemented with 0.5 M NaCl before blocking in 2% BSA/PBS for 1 hr at RT. If indicated, slides were treated with 6.4 μg human RNase H1 (Gift from Dr. Frédéric Chédin) for 4 hours at 37°C prior to i ncubation with indicated primary antibodies overnight at 4°C. Antibodies: Rabbit P-H 2AX antibody (1:500), P-ATR S428 (1:100), P-ATM S1981 (1:100), S9.6 (1:200), Nucleolin (1:500). Cells were then washed 3 times in 1X PBS and co-stained with Hoechst (1:1000) and anti-rabbit AlexaFluoro-488- and anti-mouse AlexaFluoro-594-conjugated secondary antibodies (1:1000). Cells were imaged at 63x on a Zeiss AxioObserver Z.1 Fluoresence Light Microscope or Zeiss LSM 500 Confocal Microscope with ZEN 2009 Software. Analysis of P-H2AX, P-ATR, P-ATM or S9.6 intensity per nucleus or nucleolus was calculated using Image J (v 1.50b), where Hoechst is used as a mask for the nucleus or nucleolin as a mask for the nucleolus. In box and whisker plots, box and whiskers indicate 25–75 and 10–90 percentiles, respectively, with lines representing median values.
Cell Cycle Analysis
To monitor S-phase progression, cells were pulse-labeled with 25 μM 5-Bromo-2′-deoxyuridine (BrdU) for 30 min, and washed three times with PBS. After fixing samples with ice-cold 70% ethanol, cells were permeabilized with 0.25% Triton X-100/PBS for 15 min on ice, blocked in 2% BSA/PBS for 15 min, and incubated in primary BrdU antibody for 2 h. Cells were then washed three times in PBS, incubated in AlexaFluoro-488 secondary antibody for 1 h, and washed three times with PBS. Propidium iodide (PI; 0.1 mg/mL; Sigma) and RNase A (10 mg/mL) was added to determine DNA content and cells were analyzed on a FACSCalibur device (BD Bioscience). Cell cycle profiles were determined using FlowJo™ software.
Proximity Ligation Assay
For the proximity ligation assay (PLA), cells were pre-extracted with cold 0.5% NP-40 for 4 min on ice. Cells were then fixed with 4% PFA/PBS for 15 min, washed 3 times with 1X PBS and blocked for 1 h at RT with 2% BSA/PBS. Cells were then incubated in primary antibody overnight at 4°C (1:500 mouse RNAP II 8WG16Pol; 1:500 rabbit PCNA alone; or 1:500 mouse RNAP II 8WG16 with 1:500 rabbit PCNA). Cells were washed 3 times in 1X PBS and incubated in a pre-mixed solution of PLA probe anti-mouse minus and PLA probe anti-rabbit plus (Sigma) for 1 h at 37°C. The Duolink In Situ Detection Reagents (Green) were then used to perform the PLA reaction according to the manufacturer’s instructions. Slides were mounted in Duolink In Situ Mounting Medium with DAPI and imaged on a Zeiss Axioscope at 40X or on a AxioObserver Z.1 at 63x. The number of PLA foci was quantified using Image J. A threshold of 3 or more PLA foci per nucleus was chosen as a threshold based on the fact that less than 1% of control cells acquired 3 PLA foci under unperturbed conditions.
DRIP-Seq
HeLa cells were cultured in DMEM (GIBCO) supplemented with 10% FBS, 2 mM L-glutamine and penicillin/streptomycin in 5% CO2 at 37°C and transfected with siGL3 for 72h using Dharmafect1 (ThermoFisher) according to the manufacturer’s protocol. DRIP followed by library preparation, next generation sequencing, and peak calling were performed as described in Stork et al., 2016 with minor modifications. RNase A pre-treatment before DRIP was conducted with 6 μg/ml of enzyme for 45 min at 37°C in 10 mM Tris-HCl pH 7.5 supplemented with 0.5M NaCl as described in (Sanz et al., 2016) In addition, sheared Drosophila melanogaster chromatin and a Drosophila-specific H2Av antibody was spiked-in as a minor fraction of the DRIP DNA to allow normalization of read counts according to the manufacturer’s protocol. Libraries were pooled and sequenced on an Illumina HiSeq 4000 machine with paired-end 75bp reads at the Stanford Functional Genomics Facility (NIH grant S10OD018220). The raw sequencing data were uploaded to the GEO database (GSE93368).
Bioinformatic analyses
Replication fork directionality (RFD) in HeLa cells was obtained from the OK-Seq data in the supplementary information of (Petryk et al., 2016). Using the mean RFD between the two replicates, the data was smoothed using a cubic spline fit. Origin-proximal areas were defined as all areas of the spline with positive slope between a local minimum and a local maximum. These areas were split into a Crick region (stretching from the local minimum to the discrete zero) and a Watson region (stretching from the discrete zero to the local maximum). In order to classify the local transcriptional profile around these origins, we used GRO-seq data in HeLa cells (GEO dataset GSM1518913). We then selected out regions where the Watson and Crick regions showed identical GRO-Seq strandedness, such that one side of the origin would experience a head-on collision, and the other side a co-directional collision, obtaining 6703 such origins. We further narrowed these collisions to those 2169 origins that intersected the gene bodies of canonical UCSC genes, and where the origin occurred at least 17kb from the annotated transcription start and end sites. Areas with predominantly negative GRO-seq signal were inverted, such that the head-on collision always occurs on the genome coordinates negative to the origin. With these classified origins, we calculated profiles of DRIP-seq read density in a 24kb window around each type of origin using the HTseq python package and matrix manipulations in numpy (Anders et al., 2015). GRO-seq, DNAse I Seq, and Histone ChIP data from ENCODE, as well as RNA-Pol2 mNET-Seq data (GEO dataset GSE60358) was similarly aggregated on 500bp intervals within this 24kb window using bedtools and custom python scripts. We used the same procedures to aggregate these datasets over 24kb windows around the center of UCSC genes containing the origins of interest, as a control for the general transcriptional environment of these genes. To assess the statistical significance of the accumulation of signal upstream of the origin, we calculated the mean signal upstream and downstream of the origin for all 2169 areas, and then used a paired Wilcoxon signed-rank test to compare the upstream and downstream sides.
We similarly examined the distribution of R-loops around origins with a bias towards HO collisions (HO-HO) or CD collisions (CD-CD) on both sides of the origin. We aggregated DRIP-Seq signal in 24kb windows around each origin, and additionally obtained the mean values of GC-content, HeLa replication timing from ENCODE UW-RepliSeq data, and nascent transcription from GRO-Seq (Andersson et al., 2014). As these confounding factors were different between the CD-CD and HO-HO origins, we matched the datasets on these factors using the following procedure. First, we found the closest (not necessarily unique) pairs of CD-CD and HO-HO regions by L2 distance on the standardized versions of these datasets. We then took one million bootstrap samples from the HO-HO dataset. For each of these bootstrap samples, we calculated a corresponding, matched sample by selecting the closest pair to each element of the bootstrap set in the CD-CD sample. We then plotted the original HO-HO bootstrap, as well as the matched CD-CD bootstrap as a median and 95% confidence interval of the DRIP signal.
Quantification and statistical analyses
Statistical parameters including the number of biological replicates (n), standard deviation and statistical significance are reported in the figures and the figure legends. Statistical significance is determined by the value of p < 0.05 by two-tailed Student’s t test or One-Way ANOVA test, where appropriate. For bioinformatic analyses, statistical significance was determined by Wilcoxon-signed rank test. Where appropriate, we confirmed that sample sizes were large enough that any deviations from normality did not affect the statistical test results.
Data and Software Availability
DRIP-Seq data from this study have been deposited to the Gene Expression Omnibus (GEO) database under the accession number GSE93368. The custom python scripts used to determine DRIP-Seq signal across HO and CD regions were made available under github (https://github.com/cimprichlab/Hamperl_et_al).
Supplementary Material
A) The oriP plasmid constructs expressing EBNA1 and hygromycin phosphotransferase (HygB) were transfected into HEK293 Tet-ON cells. Two days after transfection, 102 to 103 cells per 10-cm dish were plated in media containing 200 μg/ml hygromycin B. After selection for 2 to 3 weeks, ~20–40 drug-resistant clones for each plasmid derivative were isolated and expanded, giving rise to the mAIRN and ECFP HO and CD cell clones used in this study.
B) The plasmid copy number of the individual cell clones was determined by qPCR analysis after the initial expansion of the clones. If not otherwise stated, clone #2 cells for each construct were used for analyses throughout this study.
C) Replication efficiency of each construct was monitored over the course of ~8 weeks by qPCR analysis of the plasmid copy number remaining in the cell population. The bars indicate mean and standard deviations between biological replicates (n=3).
D–G) RT-qPCR analyses of RNA samples extracted from cells induced with 0, 10, 100, 500 or 1000 ng/mL DOX for 72h. Gene expression was measured and normalized relative to β-Actin as a reference gene. The bars indicate mean and standard deviations between biological replicates (n=3, except for 10 and 500 ng/mL DOX for mAIRN CD clone #1 and ECFP CD clone #1 where n=1).
H–I) DRIP-qPCR analysis of mAIRN HO and CD constructs. The scheme indicates the relative position of the primer pairs on both constructs and the black triangle the restriction sites used for fragmentation of the DNA. Cells were treated with 0 or 1000 ng/mL doxycycline in the culture medium for 72h and harvested for DRIP. The bars indicate mean and standard deviations between biological replicates (n=3).
A–B) Representative fluorescence-activated cell sorting (FACS) profiles of mAIRN HO and CD cells treated with 0 or 1000 ng/mL DOX under asynchronous conditions (ASYN), after treatment with 2mM thymidine for 19h (G1/S) or subsequent wash-out with fresh medium for 3h, 6h, 9h and 12h. Cells were pulsed with 25 M BrdU for 30 min prior to fixation. DNA content is marked by propidium iodide as shown on the x-axis and BrdU incorporation is shown on the y-axis. The percentage of cells in G1, early, mid, late S and G2/M-phase is plotted on the right.
C) RT-qPCR analysis of mAIRN HO and CD cells under the conditions described in A) and B). RNA samples were extracted and gene expression was normalized relative to the expression of the β-actin gene. The bars indicate mean and standard deviations between biological replicates (n=3).
A) Integrated Genome Viewer display of OK-Seq, GRO-Seq and DRIP-Seq enrichments at OXSR1, a representative gene used in the analysis. Scale is reads per million mapped for DRIP and GRO-Seq experiments, and RFD (defined as the fraction of reads mapping to the dominant strand) for OK-Seq. Independent replicates of DRIP-Seq are shown as light or dark green colors.
B) DRIP-Seq read counts normalized for total mapped reads from DRIP vs. Input signal. Graphs are from 2 biological experiments. Black dots indicate DRIP-negative restriction fragments and red dots indicate fragments with DRIP peaks.
C) DRIP-qPCR validation. HeLa cells under unperturbed conditions were harvested for DRIP. 3 DRIP-negative and 5 DRIP-positive regions were analyzed. The bars indicate mean and standard deviations between biological replicates (n=2).
D) Location analysis of DRIP peaks compared with expected genomic distribution under random placement.
E) GC skew density centered around DRIP peaks. Error bands represent a 95 percent confidence interval of the signal.
F) Aggregate plots of GC content, DNAseI-Seq and ChIP-Seq for H3K4me3, H3K9me3 and H3K36me3 histone marks around origins in gene bodies, and centers of the same gene bodies. The dotted line and grey bar represent the mean and standard deviation of GC-content for 500bp intervals across the genome. H3K4me3, H3K9me3 and H3K36me3 are marks of promoters, constitutive heterochromatin and active gene bodies, respectively.
G) Distribution of 24kb windows surrounding origins located in gene bodies (blue) or 24kb windows around the centers of gene bodies (red). The mean location of the origins is not strongly biased towards the 5′ end of the gene (p=0.68, bootstrap of the mean with the null hypothesis that the mean value is greater than 0.5) or 3′ end of the gene (p=0.32, bootstrap of the mean with the null hypothesis that the mean value is less than 0.5).
H) Aggregate plots of GRO-Seq and mNet-Seq (using an antibody specific to C-terminal domain serine 2 phosporylated RNAPII) around origins in gene bodies and the centers of gene bodies as control regions. The HO side of the origins showed an enrichment in nascent transcripts and elongating RNAP II (p = 9.3e-22 GRO-Seq, p =1.2e-109 mNet-Seq, Wilcoxon signed-rank test), whereas no strong difference was observed in GRO-Seq and mNET-Seq signals across the centers of the genes (p = 0.206 for GRO-Seq, p = 4.8e-3 for mNet-Seq, Wilcoxon signed-rank test).
A) Diagram showing the orientation of replication forks and transcription complexes at origins experiencing either two head-on collisions (HO-HO) or two co-directional collisions (CD-CD).
B) Aggregate plots of replication fork directionality as assessed by OK-Seq (black) and transcription directionality determined by GRO-Seq (HO-HO signal in red, CD-CD signal in blue), showing opposing orientations in the HO-HO case and co-orientation in the CD-CD case.
C) Aggregate plots of DRIP signal around HO-HO origins, CD-CD origins, as well as representative input across both regions. HO-HO and CD-CD areas are matched to have similar replication timing, GC-content and transcription to avoid differences in confounding factors for R-loop formation between these regions. Error bands represent a 95% confidence interval of DRIP and input signal as determined by a bootstrap of the mean.
D) Distribution of bootstrap samples used to produce the confidence window in C. Comparing the bootstrapped means gives a highly significant (p < 1e-6) difference in mean signal for the HO-HO regions when compared to the matched CD-CD regions.
A) Under unperturbed conditions, R-loop levels are decreased by the preferential co-directional movement of replication forks and transcription complexes. This bias towards CD collisions allows the replisome to resolve RNA-DNA hybrids, possibly by processive CMG (Cdc45-Mcm2-7-GINS) helicases that encircle the RNA-DNA hybrid containing leading strand in the CD orientation to drive replication fork progression (Fu et al., 2011).
B) High doses of replication inhibitors (HU/APH) induce R-loops by blocking replication fork progression, thereby inhibiting the resolution of RNA-DNA hybrids during CD collisions.
C) Decreasing the number of active origins by depletion of MCM proteins or inhibition of CDC7 kinase reduces the number of active replication forks and/or changes the pattern of origin usage, therefore increasing the frequency of HO collisions with transcription complexes and increasing R-loop levels.
D) Quantification of S9.6 nuclear signal in HEK293 cells transfected with indicated siRNAs and fixed after 48h. The nucleus was co-stained with Hoechst. The mean value is shown as a red line. a.u. = arbitrary units. ****p<0.0001. One-way ANOVA test (n≥100).
E) Quantification of S9.6 nuclear signal in HeLa cells transfected with indicated siRNAs and fixed after 48h. The nucleus was co-stained with Hoechst. The mean value is shown as a red line. a.u. = arbitrary units. *p<0.05. **p<0.01. ***p<0.001. ****p<0.0001. One-way ANOVA test (n≥100).
F) Western blot analysis of HeLa cells transfected with indicated siRNAs. After 48h, whole cell lysates were analyzed by immunoblotting with the indicated antibodies.
G) Representative FACS profiles of HeLa cells transfected with indicated siRNAs as in B). Cell cycle profiles were acquired as described in the legend to Figure S3A–B.
H) Western blot analysis of HeLa cells treated with Cdc7 inhibitor (PHA-767491) at the indicated concentrations. After 4h, whole cell lysates were analyzed by immunoblotting with the indicated antibodies.
I) Immunostaining and quantification of S9.6 nuclear signal in HeLa cells treated with Cdc7 inhibitor (PHA-767491) at the indicated concentrations and fixed 4 hr later. The nucleus was co-stained with nucleolin antibody and treated with RNaseH1 as indicated. The mean value is shown as a red line. a.u. = arbitrary units. *p<0.05. ****p<0.0001. One-way ANOVA test (n≥100).
J) Percentage of cells with ≥ 3 RNAP II – PCNA PLA foci between RNAP II antibody and PCNA antibody in HeLa cells under the same conditions as in A). The bars indicate mean and standard deviations between biological replicates (n ≥ 3). **p<0.01. Unpaired Student’s t-test.
K–L) Slot blot analysis and quantification to detect global RNA-DNA hybrids with S9.6 antibody in HeLa cells under the same conditions as in Figure 4 and A). Total denatured DNA is stained with a single-strand DNA antibody. The bars indicate mean and standard deviations between biological replicates (n = 3).
M) Quantification of S9.6 nucleolar signal in HeLa cells under the same conditions as in Figure 4 and H–J). The nucleus was co-stained with nucleolin antibody. The mean value is shown as a red line. a.u. = arbitrary units. *p<0.05, ***p<0.001, ****p<0.0001, n,s. not significant. One-way ANOVA test (n≥100).
A–B) mAIRN HO cells or mAIRN CD cells were treated with 0, 100 or 1000 ng/mL DOX for the indicated timepoints. After extraction of genomic DNA, the relative plasmid copy number (normalized to 0 ng/ml DOX) was determined by quantitative PCR. The bars indicate mean and standard deviations between biological replicates (n=3).
C) Southern blot of EcoRI digested DNA samples from mAIRN HO or mAIRN CD cells after induction of transcription with 0, 10, 50, 100, 500 or 1000 ng/mL DOX for 72h. Black triangles and red bars indicate positions of EcoRI restriction sites and the mAIRN probe used to visualize a 6.8kb or 3.2kb fragment of the mAIRN HO or CD construct, respectively. The blot was subsequently stripped and probed against an EcoRI fragment derived from the genomic β-actin locus as a loading control.
D) Quantification of Southern blot experiments as shown in C). The relative plasmid copy number was determined by the ratio change of the mAIRN fragment and an EcoRI fragment derived from the genomic β-actin locus (normalized to 0 ng/ml DOX). The bars indicate mean and standard deviations between biological replicates (n=2).
E) mAIRN and ECFP HO and CD cells were treated as described in the legend to Figure 5B. Whole cell lysates of all the samples treated with 1000 ng/ml DOX were analyzed by immunoblotting with the indicated antibodies.
F) Representative fluorescence-activated cell sorting (FACS) profiles of mAIRN and ECFP HO and CD cells under the same conditions as described in the legend to Figure 5. Cells were pulsed with 25 μM BrdU for 30 min prior to fixation. DNA content is marked by propidium iodide as shown on the x-axis and BrdU incorporation is shown on the y-axis. The percentage of cells in G1, early, mid, late S and G2/M-phase is shown.
A–C) Representative images (left) and quantification (right) after immunostaining for A) γH2AX, B) ATR pS428 or C) ATM pS1981 in mAIRN HO (clone #1) and mAIRN CD (clone #1 or clone #2) cells either treated with 0 or 1000 ng/mL DOX for 48h. Hoechst is used to stain the nucleus. Box and whisker plots show the 10–90 percentile. a.u. = arbitrary units. n.s. not significant. **p<0.01. ****p<0.0001. One-way ANOVA test (n ≥ 120). Scale bar: 10 μm.
Genomic locations of the identified HO-CD, HO-HO and CD-CD regions.
Acknowledgments
We thank Fréderic Chédin for reagents and protocols for in vitro transcription assays, Fréderic Chédin and members of the Cimprich laboratory for helpful discussions, and Joanna Wysocka and Dan Jarosz for manuscript feedback. This work was supported by a grant from the NIH (GM119334) to K.A.C, fellowships from the American Cancer Society (PF-15-165-01-DMC) and Burroughs Wellcome Fund to J.C.S and from the German Research Foundation DFG (HA 6996/1-1) to S.H.
Footnotes
Publisher's Disclaimer: This is a PDF file of an unedited manuscript that has been accepted for publication. As a service to our customers we are providing this early version of the manuscript. The manuscript will undergo copyediting, typesetting, and review of the resulting proof before it is published in its final citable form. Please note that during the production process errors may be discovered which could affect the content, and all legal disclaimers that apply to the journal pertain.
Author Contributions
S.H., J.C.S. and K.A.C. designed experiments. S.H. and J.C.S. performed experiments. M.B. and T.S. performed the bioinformatical and statistical analyses. S.H., J.C.S. and M.B. analyzed the data. S.H. and K.A.C. wrote the manuscript.
References
- Aguilera A, García-Muse T. R loops: from transcription byproducts to threats to genome stability. Mol Cell. 2012;46:115–124. doi: 10.1016/j.molcel.2012.04.009. [DOI] [PubMed] [Google Scholar]
- Alver RC, Chadha GS, Blow JJ. The contribution of dormant origins to genome stability: from cell biology to human genetics. DNA Repair (Amst) 2014;19:182–189. doi: 10.1016/j.dnarep.2014.03.012. [DOI] [PMC free article] [PubMed] [Google Scholar]
- Alzu A, Bermejo R, Begnis M, Lucca C, Piccini D, Carotenuto W, Saponaro M, Brambati A, Cocito A, Foiani M, et al. Senataxin associates with replication forks to protect fork integrity across RNA-polymerase-II-transcribed genes. Cell. 2012;151:835–846. doi: 10.1016/j.cell.2012.09.041. [DOI] [PMC free article] [PubMed] [Google Scholar]
- Anders S, Pyl PT, Huber W. HTSeq–a Python framework to work with high-throughput sequencing data. Bioinformatics. 2015;31:166–169. doi: 10.1093/bioinformatics/btu638. [DOI] [PMC free article] [PubMed] [Google Scholar]
- Andersson R, Refsing Andersen P, Valen E, Core LJ, Bornholdt J, Boyd M, Heick Jensen T, Sandelin A. Nuclear stability and transcriptional directionality separate functionally distinct RNA species. Nat Commun. 2014;5:5336. doi: 10.1038/ncomms6336. [DOI] [PubMed] [Google Scholar]
- Barlow JH, Faryabi RB, Callén E, Wong N, Malhowski A, Chen HT, Gutierrez-Cruz G, Sun HWW, McKinnon P, Wright G, et al. Identification of early replicating fragile sites that contribute to genome instability. Cell. 2013;152:620–632. doi: 10.1016/j.cell.2013.01.006. [DOI] [PMC free article] [PubMed] [Google Scholar]
- Bartkova J, Rezaei N, Liontos M, Karakaidos P, Kletsas D, Issaeva N, Vassiliou LVFV, Kolettas E, Niforou K, Zoumpourlis VC, et al. Oncogene-induced senescence is part of the tumorigenesis barrier imposed by DNA damage checkpoints. Nature. 2006;444:633–637. doi: 10.1038/nature05268. [DOI] [PubMed] [Google Scholar]
- Bester AC, Roniger M, Oren YS, Im MM, Sarni D, Chaoat M, Bensimon A, Zamir G, Shewach DS, Kerem B. Nucleotide deficiency promotes genomic instability in early stages of cancer development. Cell. 2011;145:435–446. doi: 10.1016/j.cell.2011.03.044. [DOI] [PMC free article] [PubMed] [Google Scholar]
- Bhatia V, Barroso SI, García-Rubio MLL, Tumini E, Herrera-Moyano E, Aguilera A. BRCA2 prevents R-loop accumulation and associates with TREX-2 mRNA export factor PCID2. Nature. 2014;511:362–365. doi: 10.1038/nature13374. [DOI] [PubMed] [Google Scholar]
- Boguslawski SJ, Smith DE, Michalak MA, Mickelson KE, Yehle CO, Patterson WL, Carrico RJ. Characterization of monoclonal antibody to DNA. RNA and its application to immunodetection of hybrids. J Immunol Methods. 1986;89:123–130. doi: 10.1016/0022-1759(86)90040-2. [DOI] [PubMed] [Google Scholar]
- Byun TS, Pacek M, Yee MC, Walter JC, Cimprich KA. Functional uncoupling of MCM helicase and DNA polymerase activities activates the ATR-dependent checkpoint. Genes Dev. 2005;19:1040–1052. doi: 10.1101/gad.1301205. [DOI] [PMC free article] [PubMed] [Google Scholar]
- Castellano-Pozo M, García-Muse T, Aguilera A. R-loops cause replication impairment and genome instability during meiosis. EMBO Rep. 2012;13:923–929. doi: 10.1038/embor.2012.119. [DOI] [PMC free article] [PubMed] [Google Scholar]
- Cimprich KA, Cortez D. ATR: an essential regulator of genome integrity. Nat Rev Mol Cell Biol. 2008;9:616–627. doi: 10.1038/nrm2450. [DOI] [PMC free article] [PubMed] [Google Scholar]
- Core LJ, Martins ALL, Danko CG, Waters CT, Siepel A, Lis JT. Analysis of nascent RNA identifies a unified architecture of initiation regions at mammalian promoters and enhancers. Nat Genet. 2014;46:1311–1320. doi: 10.1038/ng.3142. [DOI] [PMC free article] [PubMed] [Google Scholar]
- Dhar SK, Yoshida K, Machida Y, Khaira P, Chaudhuri B, Wohlschlegel JA, Leffak M, Yates J, Dutta A. Replication from oriP of Epstein-Barr virus requires human ORC and is inhibited by geminin. Cell. 2001;106:287–296. doi: 10.1016/s0092-8674(01)00458-5. [DOI] [PubMed] [Google Scholar]
- Dutta D, Shatalin K, Epshtein V, Gottesman ME, Nudler E. Linking RNA polymerase backtracking to genome instability in E. coli. Cell. 2011;146:533–543. doi: 10.1016/j.cell.2011.07.034. [DOI] [PMC free article] [PubMed] [Google Scholar]
- French S. Consequences of replication fork movement through transcription units in vivo. Science. 1992;258:1362–1365. doi: 10.1126/science.1455232. [DOI] [PubMed] [Google Scholar]
- Fu YV, Yardimci H, Long DT, Ho TV, Guainazzi A, Bermudez VP, Hurwitz J, van Oijen A, Schärer OD, Walter JC. Selective bypass of a lagging strand roadblock by the eukaryotic replicative DNA helicase. Cell. 2011;146:931–941. doi: 10.1016/j.cell.2011.07.045. [DOI] [PMC free article] [PubMed] [Google Scholar]
- Gahn TA, Schildkraut CL. The Epstein-Barr virus origin of plasmid replication, oriP, contains both the initiation and termination sites of DNA replication. Cell. 1989;58:527–535. doi: 10.1016/0092-8674(89)90433-9. [DOI] [PubMed] [Google Scholar]
- Gaillard H, García-Muse T, Aguilera A. Replication stress and cancer. Nat Rev Cancer. 2015;15:276–289. doi: 10.1038/nrc3916. [DOI] [PubMed] [Google Scholar]
- Gan W, Guan Z, Liu J, Gui T, Shen K, Manley JL, Li X. R-loop-mediated genomic instability is caused by impairment of replication fork progression. Genes Dev. 2011;25:2041–2056. doi: 10.1101/gad.17010011. [DOI] [PMC free article] [PubMed] [Google Scholar]
- García-Muse T, Aguilera A. Transcription-replication conflicts: how they occur and how they are resolved. Nat Rev Mol Cell Biol. 2016;17:553–563. doi: 10.1038/nrm.2016.88. [DOI] [PubMed] [Google Scholar]
- García-Rubio MLL, Pérez-Calero C, Barroso SI, Tumini E, Herrera-Moyano E, Rosado IVV, Aguilera A. The Fanconi Anemia Pathway Protects Genome Integrity from R-loops. PLoS Genet. 2015;11:e1005674. doi: 10.1371/journal.pgen.1005674. [DOI] [PMC free article] [PubMed] [Google Scholar]
- Ginno PA, Lott PL, Christensen HC, Korf I, Chédin F. R-loop formation is a distinctive characteristic of unmethylated human CpG island promoters. Mol Cell. 2012;45:814–825. doi: 10.1016/j.molcel.2012.01.017. [DOI] [PMC free article] [PubMed] [Google Scholar]
- Ginno PA, Lim YW, Lott PL, Korf I, Chédin F. GC skew at the 5′ and 3′ ends of human genes links R-loop formation to epigenetic regulation and transcription termination. Genome Res. 2013;23:1590–1600. doi: 10.1101/gr.158436.113. [DOI] [PMC free article] [PubMed] [Google Scholar]
- Gottipati P, Cassel TN, Savolainen L, Helleday T. Transcription-associated recombination is dependent on replication in Mammalian cells. Mol Cell Biol. 2008;28:154–164. doi: 10.1128/MCB.00816-07. [DOI] [PMC free article] [PubMed] [Google Scholar]
- Griesenbeck J, Boeger H, Strattan JS, Kornberg RD. Purification of defined chromosomal domains. Meth Enzymol. 2004;375:170–178. doi: 10.1016/s0076-6879(03)75011-3. [DOI] [PubMed] [Google Scholar]
- Helmrich A, Ballarino M, Tora L. Collisions between replication and transcription complexes cause common fragile site instability at the longest human genes. Mol Cell. 2011;44:966–977. doi: 10.1016/j.molcel.2011.10.013. [DOI] [PubMed] [Google Scholar]
- Hills SA, Diffley JF. DNA replication and oncogene-induced replicative stress. Curr Biol. 2014;24:R435–44. doi: 10.1016/j.cub.2014.04.012. [DOI] [PubMed] [Google Scholar]
- Hirt B. Selective extraction of polyoma DNA from infected mouse cell cultures. J Mol Biol. 1967;26:365–369. doi: 10.1016/0022-2836(67)90307-5. [DOI] [PubMed] [Google Scholar]
- Huertas P, Aguilera A. Cotranscriptionally formed DNA:RNA hybrids mediate transcription elongation impairment and transcription-associated recombination. Mol Cell. 2003;12:711–721. doi: 10.1016/j.molcel.2003.08.010. [DOI] [PubMed] [Google Scholar]
- Ibarra A, Schwob E, Méndez J. Excess MCM proteins protect human cells from replicative stress by licensing backup origins of replication. Proc Natl Acad Sci USA. 2008;105:8956–8961. doi: 10.1073/pnas.0803978105. [DOI] [PMC free article] [PubMed] [Google Scholar]
- Kantidakis T, Saponaro M, Mitter R, Horswell S, Kranz A, Boeing S, Aygün O, Kelly GP, Matthews N, Stewart A, et al. Mutation of cancer driver MLL2 results in transcription stress and genome instability. Genes Dev. 2016;30:408–420. doi: 10.1101/gad.275453.115. [DOI] [PMC free article] [PubMed] [Google Scholar]
- Kirchmaier AL, Sugden B. Plasmid maintenance of derivatives of oriP of Epstein-Barr virus. J Virol. 1995;69:1280–1283. doi: 10.1128/jvi.69.2.1280-1283.1995. [DOI] [PMC free article] [PubMed] [Google Scholar]
- Kunnev D, Freeland A, Qin M, Leach RW, Wang J, Shenoy RM, Pruitt SC. Effect of minichromosome maintenance protein 2 deficiency on the locations of DNA replication origins. Genome Res. 2015;25:558–569. doi: 10.1101/gr.176099.114. [DOI] [PMC free article] [PubMed] [Google Scholar]
- Langmead B, Salzberg SL. Fast gapped-read alignment with Bowtie 2. Nat Methods. 2012;9:357–359. doi: 10.1038/nmeth.1923. [DOI] [PMC free article] [PubMed] [Google Scholar]
- Lee CSS, Lee K, Legube G, Haber JE. Dynamics of yeast histone H2A and H2B phosphorylation in response to a double-strand break. Nat Struct Mol Biol. 2014;21:103–109. doi: 10.1038/nsmb.2737. [DOI] [PMC free article] [PubMed] [Google Scholar]
- Leight ER, Sugden B. Establishment of an oriP replicon is dependent upon an infrequent, epigenetic event. Mol Cell Biol. 2001;21:4149–4161. doi: 10.1128/MCB.21.13.4149-4161.2001. [DOI] [PMC free article] [PubMed] [Google Scholar]
- Li X, Manley JL. Inactivation of the SR protein splicing factor ASF/SF2 results in genomic instability. Cell. 2005;122:365–378. doi: 10.1016/j.cell.2005.06.008. [DOI] [PubMed] [Google Scholar]
- Li H, Handsaker B, Wysoker A, Fennell T, Ruan J, Homer N, Marth G, Abecasis G, Durbin R. The Sequence Alignment/Map format and SAMtools. Bioinformatics. 2009;25:2078–2079. doi: 10.1093/bioinformatics/btp352. [DOI] [PMC free article] [PubMed] [Google Scholar]
- Liu B, Alberts BM. Head-on collision between a DNA replication apparatus and RNA polymerase transcription complex. Science. 1995;267:1131–1137. doi: 10.1126/science.7855590. [DOI] [PubMed] [Google Scholar]
- Love MI, Huber W, Anders S. Moderated estimation of fold change and dispersion for RNA-seq data with DESeq2. Genome Biol. 2014;15:550. doi: 10.1186/s13059-014-0550-8. [DOI] [PMC free article] [PubMed] [Google Scholar]
- Merrikh H, Machón C, Grainger WH, Grossman AD, Soultanas P. Co-directional replication-transcription conflicts lead to replication restart. Nature. 2011;470:554–557. doi: 10.1038/nature09758. [DOI] [PMC free article] [PubMed] [Google Scholar]
- Mirkin EV, Mirkin SM. Replication fork stalling at natural impediments. Microbiol Mol Biol Rev. 2007;71:13–35. doi: 10.1128/MMBR.00030-06. [DOI] [PMC free article] [PubMed] [Google Scholar]
- Montagnoli A, Valsasina B, Croci V, Menichincheri M, Rainoldi S, Marchesi V, Tibolla M, Tenca P, Brotherton D, Albanese C, et al. A Cdc7 kinase inhibitor restricts initiation of DNA replication and has antitumor activity. Nat Chem Biol. 2008;4:357–365. doi: 10.1038/nchembio.90. [DOI] [PubMed] [Google Scholar]
- Nojima T, Gomes T, Grosso AR, Kimura H, Dye MJ, Dhir S, Carmo-Fonseca M, Proudfoot NJ. Mammalian NET-Seq Reveals Genome-wide Nascent Transcription Coupled to RNA Processing. Cell. 2015;161:526–540. doi: 10.1016/j.cell.2015.03.027. [DOI] [PMC free article] [PubMed] [Google Scholar]
- Nudler E. RNA polymerase backtracking in gene regulation and genome instability. Cell. 2012;149:1438–1445. doi: 10.1016/j.cell.2012.06.003. [DOI] [PMC free article] [PubMed] [Google Scholar]
- Paulsen RD, Soni DV, Wollman R, Hahn AT, Yee MCC, Guan A, Hesley JA, Miller SC, Cromwell EF, Solow-Cordero DE, et al. A genome-wide siRNA screen reveals diverse cellular processes and pathways that mediate genome stability. Mol Cell. 2009;35:228–239. doi: 10.1016/j.molcel.2009.06.021. [DOI] [PMC free article] [PubMed] [Google Scholar]
- Petryk N, Kahli M, d’Aubenton-Carafa Y, Jaszczyszyn Y, Shen Y, Silvain M, Thermes C, Chen CLL, Hyrien O. Replication landscape of the human genome. Nat Commun. 2016;7:10208. doi: 10.1038/ncomms10208. [DOI] [PMC free article] [PubMed] [Google Scholar]
- Prado F, Aguilera A. Impairment of replication fork progression mediates RNA polII transcription-associated recombination. EMBO J. 2005;24:1267–1276. doi: 10.1038/sj.emboj.7600602. [DOI] [PMC free article] [PubMed] [Google Scholar]
- Quinlan AR, Hall IM. BEDTools: a flexible suite of utilities for comparing genomic features. Bioinformatics. 2010;26:841–842. doi: 10.1093/bioinformatics/btq033. [DOI] [PMC free article] [PubMed] [Google Scholar]
- Rhind N, Gilbert DM. DNA replication timing. Cold Spring Harb Perspect Biol. 2013;5:a010132. doi: 10.1101/cshperspect.a010132. [DOI] [PMC free article] [PubMed] [Google Scholar]
- Rocha EP. Evolutionary patterns in prokaryotic genomes. Curr Opin Microbiol. 2008;11:454–460. doi: 10.1016/j.mib.2008.09.007. [DOI] [PubMed] [Google Scholar]
- Sankar TS, Wastuwidyaningtyas BD, Dong Y, Lewis SA, Wang JD. The nature of mutations induced by replication–transcription collisions. Nature. 2016;535:178–181. doi: 10.1038/nature18316. [DOI] [PMC free article] [PubMed] [Google Scholar]
- Santos-Pereira JMM, Aguilera A. R loops: new modulators of genome dynamics and function. Nat Rev Genet. 2015;16:583–597. doi: 10.1038/nrg3961. [DOI] [PubMed] [Google Scholar]
- Sanz LA, Hartono SR, Lim YW, Steyaert S, Rajpurkar A, Ginno PA, Xu X, Chédin F. Prevalent, Dynamic, and Conserved R-Loop Structures Associate with Specific Epigenomic Signatures in Mammals. Mol Cell. 2016;63:167–178. doi: 10.1016/j.molcel.2016.05.032. [DOI] [PMC free article] [PubMed] [Google Scholar]
- Schwab RA, Nieminuszczy J, Shah F, Langton J, Lopez Martinez D, Liang CCC, Cohn MA, Gibbons RJ, Deans AJ, Niedzwiedz W. The Fanconi Anemia Pathway Maintains Genome Stability by Coordinating Replication and Transcription. Mol Cell. 2015;60:351–361. doi: 10.1016/j.molcel.2015.09.012. [DOI] [PMC free article] [PubMed] [Google Scholar]
- Shin JHH, Kelman Z. The replicative helicases of bacteria, archaea, and eukarya can unwind RNA-DNA hybrid substrates. J Biol Chem. 2006;281:26914–26921. doi: 10.1074/jbc.M605518200. [DOI] [PubMed] [Google Scholar]
- Skourti-Stathaki K, Proudfoot NJ, Gromak N. Human senataxin resolves RNA/DNA hybrids formed at transcriptional pause sites to promote Xrn2-dependent termination. Mol Cell. 2011;42:794–805. doi: 10.1016/j.molcel.2011.04.026. [DOI] [PMC free article] [PubMed] [Google Scholar]
- Skourti-Stathaki K, Kamieniarz-Gdula K, Proudfoot NJ. R-loops induce repressive chromatin marks over mammalian gene terminators. Nature. 2014;516:436–439. doi: 10.1038/nature13787. [DOI] [PMC free article] [PubMed] [Google Scholar]
- Sollier J, Stork CT, García-Rubio MLL, Paulsen RD, Aguilera A, Cimprich KA. Transcription-coupled nucleotide excision repair factors promote R-loop-induced genome instability. Mol Cell. 2014;56:777–785. doi: 10.1016/j.molcel.2014.10.020. [DOI] [PMC free article] [PubMed] [Google Scholar]
- Srivatsan A, Tehranchi A, MacAlpine DM, Wang JD. Co-orientation of replication and transcription preserves genome integrity. PLoS Genet. 2010;6:e1000810. doi: 10.1371/journal.pgen.1000810. [DOI] [PMC free article] [PubMed] [Google Scholar]
- Stork CT, Bocek M, Crossley MP, Sollier J, Sanz LA, Chédin F, Swigut T, Cimprich KA. Co-transcriptional R-loops are the main cause of estrogen-induced DNA damage. Elife. 2016;5 doi: 10.7554/eLife.17548. [DOI] [PMC free article] [PubMed] [Google Scholar]
- Sun Q, Csorba T, Skourti-Stathaki K, Proudfoot NJ, Dean C. R-loop stabilization represses antisense transcription at the Arabidopsis FLC locus. Science. 2013;340:619–621. doi: 10.1126/science.1234848. [DOI] [PMC free article] [PubMed] [Google Scholar]
- Tallec Le B, Koundrioukoff S, Wilhelm T, Letessier A, Brison O, Debatisse M. Updating the mechanisms of common fragile site instability: how to reconcile the different views? Cell Mol Life Sci. 2014;71:4489–4494. doi: 10.1007/s00018-014-1720-2. [DOI] [PMC free article] [PubMed] [Google Scholar]
- Tuduri S, Crabbé L, Conti C, Tourrière H, Holtgreve-Grez H, Jauch A, Pantesco V, De Vos J, Thomas A, Theillet C, et al. Topoisomerase I suppresses genomic instability by preventing interference between replication and transcription. Nat Cell Biol. 2009;11:1315–1324. doi: 10.1038/ncb1984. [DOI] [PMC free article] [PubMed] [Google Scholar]
- Vijg J, Suh Y. Genome instability and aging. Annu Rev Physiol. 2013;75:645–668. doi: 10.1146/annurev-physiol-030212-183715. [DOI] [PubMed] [Google Scholar]
- Vilette D, Ehrlich SD, Michel B. Transcription-induced deletions in plasmid vectors: M13 DNA replication as a source of instability. Mol Gen Genet. 1996;252:398–403. doi: 10.1007/BF02173004. [DOI] [PubMed] [Google Scholar]
- Yekezare M, Gómez-González B, Diffley JF. Controlling DNA replication origins in response to DNA damage - inhibit globally, activate locally. J Cell Sci. 2013;126:1297–1306. doi: 10.1242/jcs.096701. [DOI] [PubMed] [Google Scholar]
- Yu K, Chedin F, Hsieh CLL, Wilson TE, Lieber MR. R-loops at immunoglobulin class switch regions in the chromosomes of stimulated B cells. Nat Immunol. 2003;4:442–451. doi: 10.1038/ni919. [DOI] [PubMed] [Google Scholar]
- Yüce Ö, West SC. Senataxin, defective in the neurodegenerative disorder ataxia with oculomotor apraxia 2, lies at the interface of transcription and the DNA damage response. Mol Cell Biol. 2013;33:406–417. doi: 10.1128/MCB.01195-12. [DOI] [PMC free article] [PubMed] [Google Scholar]
- Zeman MK, Cimprich KA. Causes and consequences of replication stress. Nat Cell Biol. 2014;16:2–9. doi: 10.1038/ncb2897. [DOI] [PMC free article] [PubMed] [Google Scholar]
- Zhou J, Snyder AR, Lieberman PM. Epstein-Barr virus episome stability is coupled to a delay in replication timing. J Virol. 2009;83:2154–2162. doi: 10.1128/JVI.02115-08. [DOI] [PMC free article] [PubMed] [Google Scholar]
Associated Data
This section collects any data citations, data availability statements, or supplementary materials included in this article.
Supplementary Materials
A) The oriP plasmid constructs expressing EBNA1 and hygromycin phosphotransferase (HygB) were transfected into HEK293 Tet-ON cells. Two days after transfection, 102 to 103 cells per 10-cm dish were plated in media containing 200 μg/ml hygromycin B. After selection for 2 to 3 weeks, ~20–40 drug-resistant clones for each plasmid derivative were isolated and expanded, giving rise to the mAIRN and ECFP HO and CD cell clones used in this study.
B) The plasmid copy number of the individual cell clones was determined by qPCR analysis after the initial expansion of the clones. If not otherwise stated, clone #2 cells for each construct were used for analyses throughout this study.
C) Replication efficiency of each construct was monitored over the course of ~8 weeks by qPCR analysis of the plasmid copy number remaining in the cell population. The bars indicate mean and standard deviations between biological replicates (n=3).
D–G) RT-qPCR analyses of RNA samples extracted from cells induced with 0, 10, 100, 500 or 1000 ng/mL DOX for 72h. Gene expression was measured and normalized relative to β-Actin as a reference gene. The bars indicate mean and standard deviations between biological replicates (n=3, except for 10 and 500 ng/mL DOX for mAIRN CD clone #1 and ECFP CD clone #1 where n=1).
H–I) DRIP-qPCR analysis of mAIRN HO and CD constructs. The scheme indicates the relative position of the primer pairs on both constructs and the black triangle the restriction sites used for fragmentation of the DNA. Cells were treated with 0 or 1000 ng/mL doxycycline in the culture medium for 72h and harvested for DRIP. The bars indicate mean and standard deviations between biological replicates (n=3).
A–B) Representative fluorescence-activated cell sorting (FACS) profiles of mAIRN HO and CD cells treated with 0 or 1000 ng/mL DOX under asynchronous conditions (ASYN), after treatment with 2mM thymidine for 19h (G1/S) or subsequent wash-out with fresh medium for 3h, 6h, 9h and 12h. Cells were pulsed with 25 M BrdU for 30 min prior to fixation. DNA content is marked by propidium iodide as shown on the x-axis and BrdU incorporation is shown on the y-axis. The percentage of cells in G1, early, mid, late S and G2/M-phase is plotted on the right.
C) RT-qPCR analysis of mAIRN HO and CD cells under the conditions described in A) and B). RNA samples were extracted and gene expression was normalized relative to the expression of the β-actin gene. The bars indicate mean and standard deviations between biological replicates (n=3).
A) Integrated Genome Viewer display of OK-Seq, GRO-Seq and DRIP-Seq enrichments at OXSR1, a representative gene used in the analysis. Scale is reads per million mapped for DRIP and GRO-Seq experiments, and RFD (defined as the fraction of reads mapping to the dominant strand) for OK-Seq. Independent replicates of DRIP-Seq are shown as light or dark green colors.
B) DRIP-Seq read counts normalized for total mapped reads from DRIP vs. Input signal. Graphs are from 2 biological experiments. Black dots indicate DRIP-negative restriction fragments and red dots indicate fragments with DRIP peaks.
C) DRIP-qPCR validation. HeLa cells under unperturbed conditions were harvested for DRIP. 3 DRIP-negative and 5 DRIP-positive regions were analyzed. The bars indicate mean and standard deviations between biological replicates (n=2).
D) Location analysis of DRIP peaks compared with expected genomic distribution under random placement.
E) GC skew density centered around DRIP peaks. Error bands represent a 95 percent confidence interval of the signal.
F) Aggregate plots of GC content, DNAseI-Seq and ChIP-Seq for H3K4me3, H3K9me3 and H3K36me3 histone marks around origins in gene bodies, and centers of the same gene bodies. The dotted line and grey bar represent the mean and standard deviation of GC-content for 500bp intervals across the genome. H3K4me3, H3K9me3 and H3K36me3 are marks of promoters, constitutive heterochromatin and active gene bodies, respectively.
G) Distribution of 24kb windows surrounding origins located in gene bodies (blue) or 24kb windows around the centers of gene bodies (red). The mean location of the origins is not strongly biased towards the 5′ end of the gene (p=0.68, bootstrap of the mean with the null hypothesis that the mean value is greater than 0.5) or 3′ end of the gene (p=0.32, bootstrap of the mean with the null hypothesis that the mean value is less than 0.5).
H) Aggregate plots of GRO-Seq and mNet-Seq (using an antibody specific to C-terminal domain serine 2 phosporylated RNAPII) around origins in gene bodies and the centers of gene bodies as control regions. The HO side of the origins showed an enrichment in nascent transcripts and elongating RNAP II (p = 9.3e-22 GRO-Seq, p =1.2e-109 mNet-Seq, Wilcoxon signed-rank test), whereas no strong difference was observed in GRO-Seq and mNET-Seq signals across the centers of the genes (p = 0.206 for GRO-Seq, p = 4.8e-3 for mNet-Seq, Wilcoxon signed-rank test).
A) Diagram showing the orientation of replication forks and transcription complexes at origins experiencing either two head-on collisions (HO-HO) or two co-directional collisions (CD-CD).
B) Aggregate plots of replication fork directionality as assessed by OK-Seq (black) and transcription directionality determined by GRO-Seq (HO-HO signal in red, CD-CD signal in blue), showing opposing orientations in the HO-HO case and co-orientation in the CD-CD case.
C) Aggregate plots of DRIP signal around HO-HO origins, CD-CD origins, as well as representative input across both regions. HO-HO and CD-CD areas are matched to have similar replication timing, GC-content and transcription to avoid differences in confounding factors for R-loop formation between these regions. Error bands represent a 95% confidence interval of DRIP and input signal as determined by a bootstrap of the mean.
D) Distribution of bootstrap samples used to produce the confidence window in C. Comparing the bootstrapped means gives a highly significant (p < 1e-6) difference in mean signal for the HO-HO regions when compared to the matched CD-CD regions.
A) Under unperturbed conditions, R-loop levels are decreased by the preferential co-directional movement of replication forks and transcription complexes. This bias towards CD collisions allows the replisome to resolve RNA-DNA hybrids, possibly by processive CMG (Cdc45-Mcm2-7-GINS) helicases that encircle the RNA-DNA hybrid containing leading strand in the CD orientation to drive replication fork progression (Fu et al., 2011).
B) High doses of replication inhibitors (HU/APH) induce R-loops by blocking replication fork progression, thereby inhibiting the resolution of RNA-DNA hybrids during CD collisions.
C) Decreasing the number of active origins by depletion of MCM proteins or inhibition of CDC7 kinase reduces the number of active replication forks and/or changes the pattern of origin usage, therefore increasing the frequency of HO collisions with transcription complexes and increasing R-loop levels.
D) Quantification of S9.6 nuclear signal in HEK293 cells transfected with indicated siRNAs and fixed after 48h. The nucleus was co-stained with Hoechst. The mean value is shown as a red line. a.u. = arbitrary units. ****p<0.0001. One-way ANOVA test (n≥100).
E) Quantification of S9.6 nuclear signal in HeLa cells transfected with indicated siRNAs and fixed after 48h. The nucleus was co-stained with Hoechst. The mean value is shown as a red line. a.u. = arbitrary units. *p<0.05. **p<0.01. ***p<0.001. ****p<0.0001. One-way ANOVA test (n≥100).
F) Western blot analysis of HeLa cells transfected with indicated siRNAs. After 48h, whole cell lysates were analyzed by immunoblotting with the indicated antibodies.
G) Representative FACS profiles of HeLa cells transfected with indicated siRNAs as in B). Cell cycle profiles were acquired as described in the legend to Figure S3A–B.
H) Western blot analysis of HeLa cells treated with Cdc7 inhibitor (PHA-767491) at the indicated concentrations. After 4h, whole cell lysates were analyzed by immunoblotting with the indicated antibodies.
I) Immunostaining and quantification of S9.6 nuclear signal in HeLa cells treated with Cdc7 inhibitor (PHA-767491) at the indicated concentrations and fixed 4 hr later. The nucleus was co-stained with nucleolin antibody and treated with RNaseH1 as indicated. The mean value is shown as a red line. a.u. = arbitrary units. *p<0.05. ****p<0.0001. One-way ANOVA test (n≥100).
J) Percentage of cells with ≥ 3 RNAP II – PCNA PLA foci between RNAP II antibody and PCNA antibody in HeLa cells under the same conditions as in A). The bars indicate mean and standard deviations between biological replicates (n ≥ 3). **p<0.01. Unpaired Student’s t-test.
K–L) Slot blot analysis and quantification to detect global RNA-DNA hybrids with S9.6 antibody in HeLa cells under the same conditions as in Figure 4 and A). Total denatured DNA is stained with a single-strand DNA antibody. The bars indicate mean and standard deviations between biological replicates (n = 3).
M) Quantification of S9.6 nucleolar signal in HeLa cells under the same conditions as in Figure 4 and H–J). The nucleus was co-stained with nucleolin antibody. The mean value is shown as a red line. a.u. = arbitrary units. *p<0.05, ***p<0.001, ****p<0.0001, n,s. not significant. One-way ANOVA test (n≥100).
A–B) mAIRN HO cells or mAIRN CD cells were treated with 0, 100 or 1000 ng/mL DOX for the indicated timepoints. After extraction of genomic DNA, the relative plasmid copy number (normalized to 0 ng/ml DOX) was determined by quantitative PCR. The bars indicate mean and standard deviations between biological replicates (n=3).
C) Southern blot of EcoRI digested DNA samples from mAIRN HO or mAIRN CD cells after induction of transcription with 0, 10, 50, 100, 500 or 1000 ng/mL DOX for 72h. Black triangles and red bars indicate positions of EcoRI restriction sites and the mAIRN probe used to visualize a 6.8kb or 3.2kb fragment of the mAIRN HO or CD construct, respectively. The blot was subsequently stripped and probed against an EcoRI fragment derived from the genomic β-actin locus as a loading control.
D) Quantification of Southern blot experiments as shown in C). The relative plasmid copy number was determined by the ratio change of the mAIRN fragment and an EcoRI fragment derived from the genomic β-actin locus (normalized to 0 ng/ml DOX). The bars indicate mean and standard deviations between biological replicates (n=2).
E) mAIRN and ECFP HO and CD cells were treated as described in the legend to Figure 5B. Whole cell lysates of all the samples treated with 1000 ng/ml DOX were analyzed by immunoblotting with the indicated antibodies.
F) Representative fluorescence-activated cell sorting (FACS) profiles of mAIRN and ECFP HO and CD cells under the same conditions as described in the legend to Figure 5. Cells were pulsed with 25 μM BrdU for 30 min prior to fixation. DNA content is marked by propidium iodide as shown on the x-axis and BrdU incorporation is shown on the y-axis. The percentage of cells in G1, early, mid, late S and G2/M-phase is shown.
A–C) Representative images (left) and quantification (right) after immunostaining for A) γH2AX, B) ATR pS428 or C) ATM pS1981 in mAIRN HO (clone #1) and mAIRN CD (clone #1 or clone #2) cells either treated with 0 or 1000 ng/mL DOX for 48h. Hoechst is used to stain the nucleus. Box and whisker plots show the 10–90 percentile. a.u. = arbitrary units. n.s. not significant. **p<0.01. ****p<0.0001. One-way ANOVA test (n ≥ 120). Scale bar: 10 μm.
Genomic locations of the identified HO-CD, HO-HO and CD-CD regions.