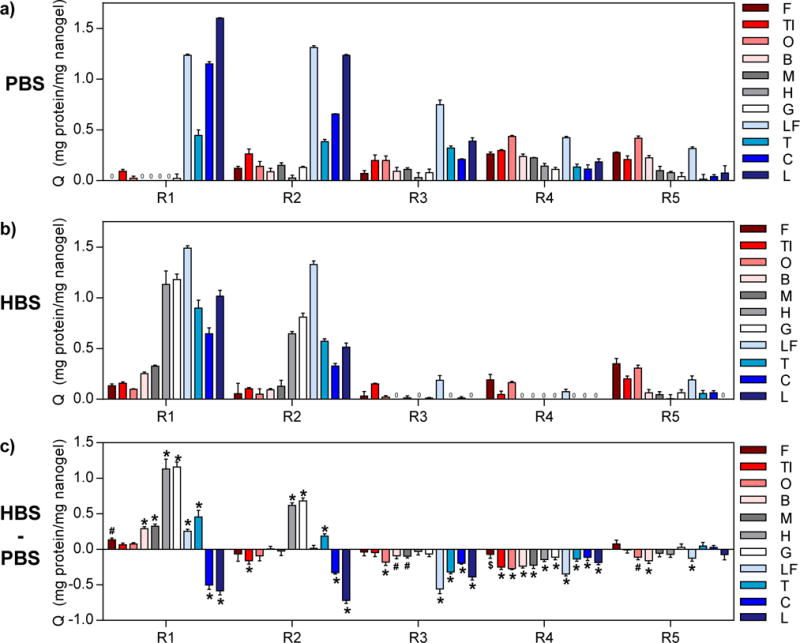
Figure 2. Characterization of cross-reactivity of poly(NIPAM-co-MAA) nanogels.

Adsorption capacity values (Q) of the eleven proteins to R1-R5 nanogels were determined from equilibrium protein binding experiments performed in (a) 0.1X PBS and (b) 0.1X HBS with initial protein concentrations of 0.5 mg/mL. (c) Difference between Q for protein binding in the two buffers (QHBS – QPBS) showing the impact of buffer on protein binding behavior. Statistical analysis was performed to determine significant differences in Q in the two buffers (n=3, Šidák’s test, $= p<0.05, # = p<0.01, * = p<0.001). Red shades = low pI proteins (pI < 6.0), gray shades = near-neutral pI proteins (6.0 ≤ pI ≤ 8.0), blue shades = high pI proteins (pI > 8.0).
