

Abstract
Toxicity and resistance remain major challenges for advanced or recurrent cervical cancer therapies, as treatment requires high doses of chemotherapeutic agents. Restoration of TP53 and hypophosphorylated-retinoblastoma (pRB) proteins by human papillomavirus (HPV) E6/E7 siRNA sensitizes HPV-positive cervical cancer cells toward chemotherapeutic agents. Here, we investigated the therapeutic effects of E6/E7 siRNA on the dynamic behavior of TP53 and RB/E2F signaling networks in deciding the cell fate. The synergistic effect of HPV E6/E7 siRNA pool (SP) with chemotherapeutic agents on TP53 and RB/E2F signaling, proliferation, and apoptosis was analyzed in vitro and in vivo. Compared to the E6/E7 SP alone, E6/E7 SP with cisplatin treatment effectively restored TP53 and RB/E2F signaling and contributes to differences in cell fate, such as apoptosis or cell cycle arrest. We also developed a cellular dynamics model that includes TP53-RB/E2F dynamics and cell proliferation profiles, and confirmed its utility for investigating E6/E7 siRNA-based combination regimens. Using a dual reporter system, we further confirmed the cross talk between TP53 and RB/E2F signaling mechanisms. Treatment of E6/E7 SP cationic liposome (i.v.) with cisplatin and paclitaxel (i.p.) potentially inhibited tumor growth in BALB/c-nude mice. Altogether, our findings suggest that stabilization of TP53 and the RB/E2F repressor complex by E6/E7 SP combined with low-dose chemotherapy can effectively suppress tumor growth.
Introduction
Human papillomavirus (HPV) infections of the high-risk group lead to the development of cervical cancer and are also associated with anogenital and head and neck cancers. High-risk HPV-16 and HPV-18 are the most frequent genotypes and are responsible for 62.6% and 15.7% of cervical cancer cases, respectively [1], [2]. Overexpression of HPV E6 and E7 oncoproteins is critical and necessary toward HPV-related diseases [3]. Binding of E6 oncoproteins accelerates the ubiquitin-mediated degradation of TP53 tumor suppressor protein and other targets [4], [5]. In contrast, E7 oncoprotein specifically interacts with retinoblastoma (RB) and related pocket protein members (p107 and p130), which results in the disruption and loss of RB/E2F repressor complexes. This process liberates E2F-regulated gene transcription and allows entry into S phase of the cell cycle [6], [7]. TP53 status and the level of RB/E2F signaling influence the efficacy of anticancer therapies that induce DNA damage, while the loss of TP53 functions is often associated with resistance to therapy [8], [9], [10]. Hence, understanding how the restoration of TP53 and RB/E2F signaling may contribute to the development of novel anticancer therapeutic strategies.
Various stress signals stabilize TP53 and subsequently regulate the expression of distinct downstream targets involved in DNA damage repair, apoptosis, angiogenesis, and senescence [11], [12], [13]. Recently, dynamic behavior of TP53 in response to DNA damage, UV radiation, and double-strand breaks (DSBs) that were induced by multiple sources has been extensively investigated [14], [15]. DSBs trigger a series of TP53 pulses [16], and excitability of TP53 pulses is stimulated in either a sustained or a transient form in response to DSBs. TP53 dynamics can also be altered by using nutlin (an Mdm2 inhibitor) and etoposide (a DNA damaging agent), thereby producing changes in TP53 dynamics that are independent of the extent of DNA damage [17], [18], [19], [20]. Cisplatin (cis-diaminedichloroplatinum II; CDDP) also induces TP53 cellular responses by repressing virally encoded E6 protein in cervical cancer [21].
The E2F family (E2F 1-8) of transcriptional regulators is essential for the timely activation of genes involved in cell cycle progression, DNA repair, DNA replication, and apoptosis [10], [22]. In HPV-driven tumorigenesis, loss of RB activity by E7 oncoprotein results in an abundance of free E2F and high expression levels of its regulated genes, which determine cell fate. Hence, deciphering the dynamics of TP53 wild-type (WT) and RB/E2F signaling is crucial to understand chemotherapeutic drug responses and HPV-mediated tumorigenesis. The mechanisms for generating excitability of TP53 pulses and RB/E2F signaling pathway restoration in tumor growth suppression in response to HPV E6/E7 siRNA alone or with combination therapy have not yet been elucidated.
The roles of TP53 and RB/E2F signaling restoration in cell fate decisions remain to be elucidated in the HPV cancer model. Therefore, we established a dual E2Fs-response element-mediated RFP (E2F-RE-RFP) and TP53-RE-GFP reporter HeLa cell line, which models regulation of the signaling networks during tumor progression in living cells. In addition, we developed an integrated protein dynamics model [23] to delineate the influence of HPV E6/E7 siRNA with combination chemotherapy on signal transduction in HPV-positive cervical cancer cells. Such a modeling approach may help us gain insight to the intracellular mechanism of anticancer agents by tracing the time course of TP53 and RB/E2F1 signaling. In this study, we provide novel details regarding induction of TP53 and RB/E2F signaling and contribute to the understanding of the mechanisms of anticancer therapy in cervical cancer models.
Material and Methods
Cell Culture, RNA Interference, and Chemical Treatment
The human cervical cancer cell lines HeLa (HPV 18-positive) and CaSki (HPV16-positive) were obtained from the ATCC (Manassas, VA). Cells were routinely tested for mycoplasma and characterized by short tandem report profiling (AmpFISTR identifier kit, Applied Biosystems, Foster, CA, cat. 4322288). HeLa and CaSki cells were transfected with siRNAs using DharmaFECT transfection reagent (Thermo Scientific, USA) according to the manufacturer's protocol. The HPV 16 and 18 siRNA sequences are listed in Table S1. Cisplatin (P4394) and paclitaxel (T7191) were obtained from Sigma-Aldrich, USA. For combination therapy, cells were exposed to E6/E7 siRNA along with chemotherapeutic agents.
Western Blotting
Western blot analysis was performed as described previously [24], [25]. The detailed procedure was listed in the supplementary materials and methods. Primary antibodies used for these studies are TP53 [DO7], HPV 18-E6 [G7], HPV16-E6 [C1P5], HPV 18-E7 [F7], HPV16-E7 [ED17], E2F-1 [KH195], cyclin E [M20], p21 (C19), CDK-2 (M2), and β-actin [C4], purchased from Santa Cruz Biotechnology (St. Louis, CA), as well as RB [554164] (BD Pharmingen, USA) and Phospho-TP53 (ser-15) [9284] (Cell Signaling, USA).
Luciferase Assay
The luciferase reporter constructs pTA-Luc (empty vector control), pTA-TP53-Luc (TP53 reporter), and pTA-E2F-Luc (E2F reporter) were obtained using the Clontech pathway profiling system (Mountain View, CA). The detailed procedure is listed in the supplementary materials and methods.
Cell Proliferation Assay, Cell Cycle Analysis, and Quantitative Real-Time PCR
Procedure details were described previously [25], [26]. The detailed procedure is listed in the supplementary materials and methods.
Establishment of TP53-RE-GFP Reporter and Dual Reporter Cell Lines
Establishment of reporter cell lines is detailed in the supplementary materials and methods.
Cell Growth and TP53-RE-GFP Reporter Assessment Using the IncuCyte Live Cell Monitoring System
The growth properties and TP53 restoration of TP53-RE-GFP stable cells transfected with HPV E6/E7 siRNA or control siRNA were assessed using the IncuCyte HD system (Essen Instruments, Ann Arbor, MI). The detailed setting procedure was listed in the supplementary materials and methods. Time series of TP53-RE-GFP dynamics were analyzed in response to NC plus cisplatin (CDDP), SP, or SP plus CDDP treatment in TP53-RE-GFP reporter HeLa stable cells. We took IncuCyte images of HeLa cells without GFP or with TP53-RE-GFP signal. Mean GFP fluorescence intensities were measured using Image J (NIH) software. Background fluorescence intensity and TP53-RE-GFP cells without GFP expression were determined and corrected. Fluorescence intensity maximum of arbitrary unit is set as 100% and minimum as 0%. Each line denotes average of the total TP53-RE-GFP expression level in around 20 cells/image, as measured in response to NC plus CDDP, SP, or SP plus CDDP treatment during IncuCyte analysis.
Live Cell Imaging and Confocal Image Analysis
Details about live cell imaging and instrument settings are described in the supplementary materials and methods.
Cellular Dynamics Modeling of SP with CDDP
Relative protein expression levels of E6, E7, TP53, p21, cyclin E, and E2F1, all of which play critical roles in apoptosis after SP with CDDP treatment, were used for dynamics modeling. For detailed mathematical modeling calculation, please see the supplementary materials and methods.
In Vivo Xenografts and Immunohistochemistry Analysis
In vivo xenografts and immunohistochemistry analysis were performed as described previously [24], [25]. The hind legs of BALB/c-nude mice were injected with 2 × 10⁶ HeLa cells. After 15 days, cationic liposome/siRNA (4 mg/kg body weight, 100 μl) was injected into the tail vein every 48 hours. On the day after the first E6/E7 siRNA pool injection (426+ 450), CDDP (2 mg/kg) and paclitaxel (PTX) (4 mg/kg) were administered to the mice. The chosen dose for CDDP and PTX was designated “low-dose (9- to 11-fold)” according to the mouse equivalent dose of individual agents used for humans [27], [28], [29]. Tumor sizes were measured using digital calipers, and volumes were calculated as length × width × height × π/6 (mm3). For detailed immunohistochemistry analysis procedure and study approval, please see the supplementary materials and methods.
Chou and Talalay Analysis
The Chou and Talalay analysis method was used to determine the combined effects of HPV E6/E7 siRNA and chemotherapeutic drugs [30]. A combination index (CI) was then determined based on the divergence between dose-effect results. CIs of <1, =1, and >1 indicate synergy, additive effects, and antagonism, respectively.
Statistics
All the results are presented as the means ± SDs of triplicate samples from at least three independent experiments. Statistical significance was calculated using a two-tailed Student's t test, or ANOVA where two or more groups were compared. A P < .05 was considered statistically significant.
Results
siRNA-Mediated E6/E7 Silencing Strongly Correlates with Restoration of TP53 and RB/E2F Signaling Pathways
We previously reported the HPV E6/E7-specific siRNAs, along with their chemically modified derivatives with improved E6/E7 silencing efficiency, that demonstrated their sensitizing effects to the DNA-damaging agent CDDP and radiotherapy [24], [25]. Here, we focused on the silencing efficiency of our chemically modified E6/E7 siRNA, as well as the restoration of TP53 and RB/E2F signaling. We used HPV type 18 E6/E7 siRNA derivatives (426, 450) or 16 E6/E7 siRNA derivatives (366, 448, 497) alone or in combination with CDDP to treat HPV type 18 (HeLa)– and HPV type 16 (CaSki)–positive cervical cancer cells. Various concentrations of CDDP in the presence of negative control siRNA (NC) or SP were screened in order to select the optimal concentration (Figure S1A). After 24 hours, the individual siRNA derivatives or pooled siRNAs (SP) produced dramatic increase in TP53 levels compared to NC-treated cells (Figure 1A). As shown in Figure 1B, either E6/E7 siRNA alone or SP significantly inhibited cell proliferation in both cell lines. Moreover, SP plus CDDP treatment was more effective than E6/E7 siRNA derivatives and its pooling alone or with NC plus CDDP, leading to effective reductions in cell proliferation with maximal TP53 restoration (Figure 1B). Based on our results, we selected 20 nM of SP and 10 μM of CDDP for further experiments in both cell lines.
Figure 1.

Analysis of TP53 and pRB/E2F dynamics in HPV E6/E7 SP or with CDDP-treated cancer cells. (A) HeLa cells (left panels) and CaSki cells (right panels) were transfected with 20 nM of negative control siRNA (NC), HPV E6/E7 siRNA, followed by exposure to 10 μM cisplatin (CDDP). After 24 hours, whole cell lysates were collected for immunoblot analysis of E6 and E7 silencing efficiency and induction of TP53, with β-actin as a control. (B) After 24 hours, cell viability was determined by WST assays. (C) Analysis of TP53 and pRB induction in tumor cells treated with HPV E6/E7 siRNA using TP53 and E2F luciferase reporter activity. A TP53 and E2F luciferase reporter vector was transfected into cells in conjunction with 20 nM of siRNA for either E6/E7 or negative control alone, and/or with 10 μM CDDP. The values were normalized to the control sample lanes, which were set as 1. TP53 activity increased and E2F activity decreased in HeLa cells (left panel) and CaSki cells (right panel) after treatment with either E6/E7 specific siRNA alone or in conjunction with CDDP. (D) HeLa (top panel, middle panel) and CaSki (bottom panel) cells treated with 20 nM of siRNA for either E6/E7 or negative control alone, and/or with 10 μM CDDP. Restoration of endogenous TP53 and pRB, as well as silencing of 18E7, 16E7, 18E6, and 16E6, was analyzed along with other downstream targets at the time points indicated, with β-actin as a control. (E) Histogram showing the relative intensity (%) of endogenous TP53, E6, E2F, and E7 obtained from the corresponding immunoblots. (F) Real-time quantitative (q)PCR analysis of p21, transcript levels in HeLa (left panel) and CaSki (right panel) cells treated with 20 nM of siRNA for either E6/E7 or negative control alone, and/or with 10 μM CDDP. Error bars represent the mean ± standard deviation (SD) (n = 4). (*P < .05, **P < .01).
ppRB: hyperphosphorylated RB; pRB: hypophosphorylated RB.
In order to assess the functional activity of TP53 and RB/E2F signaling, both cell lines were transfected with luciferase reporter plasmids (pTA-TP53 and pTA-E2F) with response elements (REs) for TP53 and E2Fs (E2F1-E2F5), respectively. Both cell lines were co-transfected with SP, NC/SP plus CDDP, as well as with pTA-TP53/ pTA-E2F luciferase reporters or the empty control vector. At 48 hours, cells were harvested and luciferase activity was measured. In cells receiving SP plus CDDP, there was a five- to seven-fold increase in TP53 levels, and E2Fs-induced luciferase expression was decreased. No significant differences were observed between cells transfected with the pTA-empty plasmid and the NC (Figure 1C). This suggests that TP53 and RB/E2F signaling was functionally active in both SP- and SP plus CDDP–treated cells. We also determined the expression level of TP53, RB/E2F, and its target genes at various time points after transfection with E6/E7 SP alone or in conjunction with CDDP. TP53 and its phosphorylation at serine 15 are activated by the ataxia telangiectasia gene (ATM) in response to DNA damage [31]. In both HeLa and CaSki cells, HPV E6/E7 SP with CDDP exposure elevated both TP53 and its phosphorylated form, suggesting posttranslational regulation of TP53 (Figure 1D). Increased TP53 phosphorylation is associated with induction of TP53 protein expression [32]. The p21 (p21WAF1/Cip1) protein is a significant contributor to cell cycle regulation and is expressed as a result of TP53 accumulation in cells [33]. p21 directly inhibits cyclin-dependent kinase (CDK)–mediated phosphorylation of RB, which also disrupts RB/E2F repressor complexes. In response to CDDP plus SP treatment, TP53, phospho-TP53 (ser-15) and p21 protein expression level displayed earlier induction compared with SP alone in HeLa and CaSki cells, respectively, and attains its maximum level at 24 hours (Figure 1D). Disruption of RB/E2F complexes by the E7 oncogene impairs repression and increases the concentration of unbound E2F family members such as E2F1, which stimulates gene transcription [34]. Overexpression of cyclin E (encoded by a target gene of E2F1) greatly accelerates premature S phase entry and DNA synthesis in cultured cells [35]. Significant decrease in E2F1 and cyclin E results from increased levels of hypophosphorylated RB (pRB) and p21, respectively, in SP plus CDDP–treated HeLa cells. Large fluctuations in E2F1 expression level were observed, which decreased at 24 hours in CaSki cells (Figure 1D). There were no changes in CDK2 levels (data not shown). Collectively, these results demonstrate that SP plus CDDP effectively restores TP53 and RB/E2F signaling. Densitometric quantification demonstrated a negative correlation between TP53 and E6 expression in SP- and SP plus CDDP–treated cells (Figure 1E), which was not observed with CDDP treatment alone (Figure S1B, C, and D).
Effect of tp53 Restoration on Its Well-Characterized Target Genes
Knockdown of the E6 oncogene by HPV E6/E7 SP with CDDP resulted in elevated TP53 levels and earlier induction of the TP53 target gene, p21, starting from 6 and 8 hours in HeLa and CaSki cells, respectively (Figure 1F). We also compared the expression of TP53-dependent genes (GADD45A, XPC, MDM2, PPM1D, BAX, APAF1, PML, and YPEL3) in HPV E6/E7 siRNA transfected HeLa and CaSki cells with or without CDDP at different time points [19], [36]. p21 transcription (Figure 1F), as well as transcription of all TP53-dependent genes tested, significantly increased with SP treatment alone and/or in combination with CDDP in both HeLa (Figure S2A) and CaSki (Figure S2C) cells compared to NC plus CDDP treatment alone in HeLa cells (Figure S2B) and CaSki cells (Figure S2D). Induction of MDM2 transcription increased by four- to eight-fold with E6/E7 siRNA treatment alone or with CDDP. MDM2 binds to TP53 and stimulates its degradation by proteasomes via a negative feedback loop mechanism that may regulate and sustain TP53 levels in both cell lines.
E6/E7 Silencing Effect on TP53 Dynamics and Cell Fate
Immunoblotting techniques have limitations for determining TP53 dynamics. Analysis of cellular protein dynamics often requires measurement in single cells. Even in same clone cell lines, proteins exhibit nonidentical patterns in individual cells, even with identical concentrations of drug treatments [37]. Immunoblot and qPCR analysis indicate that expression of TP53 and its targets continually increase 6 to 8 hours after treatment with E6/E7 siRNA alone or with CDDP. Hence, we decided to observe the restoration of TP53 dynamics in single cell level as well as in the total cell population after E6/E7 siRNA treatment. We utilized an IncuCyte HD system to measure TP53 dynamics and cell fate using live TP53-RE-GFP reporter stable (HeLa and CaSki) cell lines, which express the GFP reporter under the control of a TP53-RE and a minimal CMV promoter. These cell lines express GFP in response to TP53 signals, which allows observation of endogenous TP53 dynamics. We collected time-lapse live imaging following treatment of NC plus CDDP, or HPV E6/E7 SP alone or in combination with CDDP. CDDP induces TP53 activation, whereas SP restores TP53 by silencing E6/E7 oncogenes (Figure 2). Dose-response curves for different combinations (SP alone or with CDDP) are presented in Figure S3. Cell proliferation rates (Figure S3A) and TP53-RE-GFP count values were normalized with cell counts in order to obtain actual TP53-RE-GFP counts (Figure S3B), and the results indicate that inhibition of the proliferation rate coincided with TP53-RE-GFP increases in the reporter cells. Synergism between SP and CDDP was demonstrated using Chou-Talalay analysis (Table S2). Combination of SP (20 nM) and CDDP (10 μM) effectively inhibited proliferation and induced TP53-RE-GFP. We also assessed cell growth rates and short tandem repeat authentication of the reporter cell profiles compared to parental HeLa cells; however, no changes were observed. Thus, we decided to use these concentrations for subsequent evaluations of TP53 dynamics and cell fates.
Figure 2.

Effects of E6/E7 silencing on TP53 dynamics and cell fate.
Schematic of the TP53-RE-GFP reporter constructs used to generate stable cell lines. A well-characterized TP53-RE that contains a TP53 consensus binding site (green box), with the arrow indicating a minimal TATA box with the GFP-reporter gene. Time-lapse microscopy images of live TP53-RE-GFP HeLa stable cells that were treated with of 20 nM of NC, SP, or combination therapy of NC/SP plus CDDP (10 μM). Values shown are from all nine regions of each well at 1-hour intervals, merged and averaged across three independent experiments. (A) A selection of posttransfection representative images is shown as a merge of fluorescent and phase-contrast images, with NC-treated cells as a control. Scale bar: 40 μm. (B) Stable TP53-RE-GFP HeLa reporter cells, proliferation rate (top left), GFP count (top right), GFP intensity (bottom left), and GFP count normalization (bottom right) in response to HPV E6/E7 siRNA, NC alone, and/or with CDDP combination treatments are shown. Arrows indicate HPV E6/E7 siRNA treatment and induction of TP53-RE-GFP reporter gene expression. (C) Stable TP53-RE-GFP CaSki reporter cells, proliferation rate (top left), GFP count (top right), GFP intensity (bottom left), and GFP count normalization (bottom right) in response to HPV E6/E7 siRNA, NC alone, and/or with CDDP combination treatments are shown. Red arrows indicate HPV E6/E7 siRNA treatment and induction of TP53-RE-GFP reporter gene expression from the time after HPV E6/E7 siRNA treatment. (D) Mean fluorescence intensity of TP53-RE-GFP positive cells (n) was quantified using Image J software for 48 hours or until cell death occurred. Normalized TP53-RE-GFP intensities in response to various treatments are shown in arbitrary unit (AU). Dotted red line indicates the maximum GFP intensity level observed. Arrow indicates the time point between which most of the cells showed maximum GFP intensity level in SP plus CDDP treatment. (E) Simulation of TP53 dynamics in response to NC plus CDDP, HPV E6/E7 SP, (or) SP plus CDDP combination treatment.
We monitored the TP53 dynamic responses and cell fate changes in SP alone, CDDP alone, or combination-treated TP53-RE-GFP stable HeLa reporter cells (Figure 2A, S1-S3, available online) and CaSki cells (Figure S4) using time-lapse movies. The increased GFP counts in TP53-RE-GFP reporter cells with different treatment combinations are due to increases in endogenous TP53 levels. No significant changes were observed with NC-treated cells. CDDP with NC treatment induced TP53-RE-GFP dynamics in a pulse form at low level and resulted in enlarged cell morphology, out of which few cells entered into apoptosis. SP alone or with CDDP treatment produced dramatic increase in TP53 in a sustained manner, leading to irreversible fates such as cell death or cell cycle arrest. There were differences in the time required for TP53 dynamic restoration between cells of the same clone. As shown in Figure 2B (HeLa cells) and Figure 2C (CaSki cells), the cell proliferation rates, TP53-RE-GFP positive cell counts, total TP53-RE-GFP integrated intensities, and normalized TP53-RE-GFP count were analyzed. SP plus CDDP–treated cells showed higher TP53-RE-GFP count with reduced cell proliferation rate in both HeLa and CaSki cells.
Using our IncuCyte time-lapse movies, we further traced and quantified the real-time induction of TP53 dynamics in individual cells in response to SP, and NC/SP plus CDDP. Distinct TP53-RE-GFP responses were observed in each group. Our dynamics result (Figure 2D) demonstrates that CDDP treatment exhibited pulsed form early on in 35% of total cell population (S1-S3, available online). After 48 hours, 47.9% of total cell populations are viable. In contrast, SP plus CDDP stimulates high-level sustained form of TP53-RE-GFP restoration starting at 8 hours in 32.6% of cells followed by immediate cell death (S1-S3, available online), wherein only 22.3% of total cell population were viable at 48 hours. SP stimulates TP53-RE-GFP induction between 16 and 18 hours in 34.9% and reaches a plateau, which results in cell death or cell cycle arrest with continuous TP53-RE-GFP expression (S1-S3, available online), and after 48 hours, only 36.1% of total cell population survived.
Based on these findings, we propose a model for TP53 dynamics in cell fate determination. CDDP cytotoxicity is mediated by DNA damage recognition machinery following the formation of cross-linked DNA adducts, which triggers TP53 protein and its targets [21]. We hypothesize that low concentrations of CDDP increase periodic TP53 pulses and cells experience both temporary cell-cycle arrest and recovery from the DNA damage. E6/E7 SP treatment restores TP53 (WT) signaling by repressing the E6 oncogene, and TP53 produces nonoscillatory, lower-level sustained pulses that result in cell death or cell cycle arrest. However, SP plus CDDP treatment doubly triggers TP53 signaling, which reaches its maximum after 6 hours. Accumulated TP53 is sustained in cells, which results in irreparable cell death (Figure 2E).
The Relationship between TP53 and RB/E2F Signaling in HPV E6/E7 siRNA-Treated Cells
Dissociation of RB/E2F complexes by the HPV E7 oncogene increases the concentration of unbound E2Fs in cervical cancer cells [6], [38]. To gain insight on the expression of TP53 and E2F1 in clinical human cervical cancer samples, we investigated the genomic copy number alteration, RNA expression, and amplification of TP53 and E2F genes utilizing the Cancer Genome Atlas database (Figure S5, A, B, and C). We predicted that E2F-RE–mediated RFP reporter assay would enable visualization of the loss of RB by monitoring crucial E2F activity in a model of human cervical carcinomas. In order to test this model, we developed novel dual HeLa reporter cells for the simultaneous investigation of TP53 and RB/E2F signaling in response to SP alone or in a combination treatment. We found that transfection of the E2F-TA-RFP construct enabled sensitive monitoring of E2F-RE-RFP downregulation following the treatment with HPV E6/E7 SP in TP53-RE-GFP reporter HeLa cells. Cells were monitored at specific time intervals by confocal microscope. During the first 12 hours after SP treatment, we observed a slow disappearance of E2F-RE-RFP expression, suggesting restoration of the RB/E2F complex through E7 silencing. A typical time series is shown in Figure 3A.
Figure 3.

Dynamics of TP53-RE-GFP and E2F-RE-RFP in response to HPV E6/E7 siRNA alone or with CDDP. (A) Dual TP53-RE-GFP and E2F-RE-RFP reporter HeLa cells were cultured and imaged using confocal microscopy to assess the time-dependent transition of E2F-RE-RFP (red) to TP53-RE-GFP (green), suggesting silencing efficacy of HPV E6/E7 oncogenes in HeLa cells. Red represents excitation/emission (Ex/Em) = 565 nm/650 nm. Green represents Ex/Em = 495 nm/545 nm. Fluorescence images in cells are superimposed on phase contrast images. Scale bar: 50 μm. (B) Mean intensity data acquired with time-lapsed confocal imaging of dual reporter cells in response to HPV E6/E7 siRNA alone or with CDDP combination treatments. Cells were imaged every 20 minutes from 12 to 24 hours following administration. A transition pattern was observed in regions of interest (ROIs) following HPV E6/E7 siRNA transfection with or without CDDP.
Dual reporter cells were monitored by time-lapse imaging using computer-assisted confocal microscopy (Leica TCS SP8) in order to trace the restoration of TP53 and RB/E2F signaling. Cells were quantified following SP or SP plus CDDP treatment in each group, and the mean intensity was calculated from three different regions. The dual reporter model also provides an absolute quantitation of TP53 and E2F dynamics at the single cell level. More cells showed TP53-RE-GFP expression at lower levels at the start of imaging, followed by a sudden increase at 18 to 20 hours after SP treatment. TP53-RE-GFP was expressed at high levels immediately following treatment with SP plus CDDP and reached a maximum after 12 to 14 hours (Figure 3B), while some cells entered cell death before expressing TP53-RE-GFP. Conversely, the mean intensity of the RFP slope demonstrated that SP plus CDDP treatment steadily decreased E2F-RE-RFP expression, while SP treatment produced severe fluctuations in E2F-RE-RFP expression, including a sudden decrease at 19 to 21 hours. RFP to GFP conversion or complete disappearance of RFP indicates the restoration of TP53/pRB, which leads to immediate cell death (S4, available online).
Cellular Dynamics Modeling of SP with CDDP
Critical proteins such as E6, E7, TP53, p21, cyclin E, and E2F1 were selected to build the dynamics model (Figure 4A). Monoexponential decrease models well explained the changes in E6 and E7 levels over time. Since relative protein expression levels from the Western blot analysis were used for modeling, baselines of each protein levels (measured at 24 hours in the no-treatment group) were set as 1, and the other data were normalized by the baselines. Cascade models for TP53, p21, cyclin E, E2F1, and cell proliferation successfully described the pharmacodynamics of SP with CDDP. Cell growth in the control (no treatment) group exhibited saturation at 48 hours in the experimental conditions (Figure 2B). Thus, the logistic cell growth function was used in this dynamic modeling where the observation period (24 hours) was not enough to show such saturation. Final parameter estimates after SP and CDDP treatment are listed in Table S3, and model-fitted profiles are shown in Figure 4, A and B.
Figure 4.

Schematic of the simple dynamics model of SP with CDDP effects in HPV (+) cancer cells. (A) The SP with CDDP compartment represents SP and CDDP concentrations in vitro assumed to be constant for 24 hours. Open and closed bars are stimulation and inhibition processes, respectively. (B) Changes in model-fitted (lines) and observed (circles) relative protein expression levels and cell proliferation over time by continuous SP (20 nM) and CDDP (10 μM) exposure. Dashed lines/black circles: SP with CDDP treatment, dashed lines/red circles: NC treatment.
Therapeutic Effects of Triple Combination Therapy on HPV-Positive Cervical Cancer Cells In Vitro and In Vivo
Although CDDP is beneficial for treating cervical and other cancers, development of resistance to CDDP has become a major concern. Increase in the dosage of CDDP in order to overcome this resistance results in side effects including nephrotoxicity and ototoxicity, thereby limiting the efficacy and clinical use of CDDP [39], [40]. So, we next investigated whether SP plus CDDP combination therapy is effective against CDDP-resistant cervical cancer cells. We developed a CDDP-resistant HeLa cell line (HeLa-R), which exhibited delayed growth compared to HeLa (nonresistant) cells. Cell numbers were adjusted for seeding before triple treatment to compensate for any potential bias that could arise as a consequence of any difference in cell proliferation. We also investigated the effects of SP plus PTX in HeLa cells (Figure S6). No significant changes in the protein expression levels of TP53 and E2F1 were observed compared to with SP alone. In addition, no significant effect was observed in cell proliferation, indicating that not all drugs produce strong T53 activation when coupled with E6/E7 siRNA (Figure S6, A and B). CDDP-PTX combination has been reported to be a better treatment option than CDDP alone, specifically for treatment of advanced or recurrent cervical cancer [27], [28]. HeLa and HeLa-R cell lines were used to compare the effects of triple drug combination, including SP (20 nM), CDDP (5 μM), and PTX (10 nM). Triple drug combination was compared to combined treatment with SP (20 nM) and CDDP (10 μM). Water-Soluble Tetrazolium salts (WST) assays were used to determine the responses of HeLa (parental) and HeLa-R (CDDP-resistant) cells. To exclude any potential bias that could have resulted from unequal cell proliferation of the HeLa-R cell lines, survival rates were normalized to mock-treated cells. As depicted in Figure S6C, our WST assay results indicated that CDDP plus SP treatment is not as effective in HeLa-R cells as in HeLa cells. However, triple combination with a low dose of CDDP (5 μM) produced better antiproliferative effects than SP plus CDDP (10 μM) and CDDP plus PTX treatments in both HeLa-R and HeLa cells.
The majority of the cells were arrested in G0/G1 phases 24 hours after treatment with SP alone (72.78%) or SP plus CDDP (45.34%). Triple combination treatment produced marked cell death (sub-G1 phase, 19.35% in triple combination versus 11.33% in CDDP plus PTX and 5.0% in SP), and most cells had died after 72 hours, confirming that triple combination including a low dose of CDDP has a marked effect on cell cycle regulation (Figure 5A). Similar effects were also observed in CaSki cells (Figure S6D). To further confirm the occurrence of apoptosis, the triple combination–treated cells were subjected to Annexin-V/PI double staining followed by flow cytometry analyses. Exposure of the cells to low dose of triple combination induced significant apoptosis in both HeLa (Figure 5B) and CaSki cells (Figure S6E). However, Western analysis of triple combination–treated cells shows similar TP53 and RB/E2F restoration signaling when compared with SP plus CDDP treatment (Figure 5C). Similar TP53 induction patterns were also observed between triple combination– and SP plus CDDP–treated TP53-RE-GFP reporter cells (Figure 5D). Synergistic effects of SP, CDDP, and PTX triple combination therapy were demonstrated in both HeLa and HeLa-R cell lines using Chou-Talalay analysis (Table S4). Altogether, our results suggest that triple combination with low dose CDDP has better therapeutic profile over SP plus CDDP treatment in cervical cancer cells.
Figure 5.

Therapeutic effects of triple combination therapy on HPV-positive cervical cancer cells in vitro and in vivo. HeLa cells treated with triple combination (E6/E7 specific siRNA, CDDP plus PTX)/(control siRNA, CDDP plus PTX) or their combinations. After 24 hours, treated HeLa cells underwent further analysis. (A) Cell cycle analysis results from HeLa cells indicating cell fractions in each phase (G0-G1, S, and G2/M, indicated as % of cells). Data presented are means ± SDs (n = 4) [negative control (NC) versus siRNA pool (SP); *P < .05 and NC + CDDP + PTX versus SP + CDDP + PTX; #P < .05]. (B) HeLa cells were subjected to (E6/E7 specific siRNA, CDDP plus paclitaxel; PTX)/(control siRNA (NC), CDDP plus paclitaxel), or their combinations treatment. The combination treatment–induced apoptosis was determined by using Annexin V-FITC. Error bars represent the means ± SDs of independent experiments (n = 3), *P < .05.(C) Induction of endogenous TP53 and pRB, and silencing of 18E7 and 18E6 were analyzed, as well as other downstream target genes at the indicated time points, with β-actin as a control. (D) Effect of triple combination on the dynamics of TP53-RE-GFP. The cell proliferation rate (top left), GFP count (top right), GFP intensity (bottom right), and GFP count normalization (bottom left) are shown. Red arrows indicate HPV E6/E7 siRNA treatment and induction of TP53-RE-GFP reporter gene expression from the time after HPV E6/E7 siRNA treatment.
Next, we assessed the in vivo activity of triple combination in a HeLa xenograft tumor model. Treatment with 40 μg of SP cationic liposome and CDDP (2 mg/kg) plus PTX (4 mg/kg) robustly inhibited tumor growth without producing rebound effects following cessation of chemotherapy. In our previous study, treatment of E6/E7 siRNA alone did not show any significant effect on tumor growth inhibition [25]. Continuous tumor growth was detected in mice receiving GFP siRNA with or without CDDP plus PTX, but not in triple combination–treated mice, after 25 days (Figure 6A). No obvious signs of toxicity or unusual behavioral patterns were observed in all group. Next, tumors from all three groups were excised and dissected for histological analysis (Figure 6B). Tumors treated with GFP siRNA alone or with CDDP plus PTX were heterogeneous with a high degree of cellular polymorphisms. In contrast, the triple combination–treated tumors were homogenous, with a low degree of cellular polymorphisms and well-demarcated tumors. In addition, approximately 60% to 80% of TP53-, p21- and RB-positive cells was observed in tumors from mice treated with 18E6/E7 SP with CDDP plus PTX. Tumors treated with triple combination therapy had increased TUNEL-positive cells mostly due to restoration of TP53 and RB/E2F signaling (Figure 6B).
Figure 6.

Synergistic effects of triple combination therapy on tumor growth inhibition. (A) The tumor volumes of the three groups are plotted until 25 days after treatment, with average values (error bars indicate SDs) (left panel). Representative images from the CDDP plus paclitaxel (PTX) group 25 days after treatment and from the triple combination treatment group 25 days after treatment (right panel). Whole mount section of tumor in all three groups were also shown (bottom panel). Scale bar: 2000 μm. (B) H&E staining, tunnel assay, and immunohistochemistry analysis of TP53, p21, and RB protein expression using mouse xenograft samples. Scale bar: 50 μm.
Discussion
Although the clinical utility of siRNA has not yet been conclusively demonstrated, there are many ongoing patient trials investigating siRNA-based cancer treatments. Several preclinical and clinical trials on RNAi are in progress for various diseases including metabolic diseases, skin diseases, viral infections, and respiratory disorders [41], [42]. We previously reported that E6/E7 siRNA sensitizes xenografted tumors to CDDP therapy and radiation therapy in cervical carcinomas [24], [25]. Additionally, chemical modifications (such as 2′-OMe) to siRNAs reduce off-target effects. [43] In this study, we investigated the effects of chemically modified (2′-OMe) HPVE6/E7 specific siRNA in combination with chemotherapeutic drugs on cervical cancer cells. We focused on reactivation of wild-type TP53 protein and RB/E2F signaling mechanisms. Low-concentration pooled 2′-OMe modified E6/E7 siRNA reduces off-target effects while still producing maximum silencing efficiency [25]. For the first time, we investigated the influence of E6/E7 SP and associated combination therapies on cellular TP53 dynamics and stability, as well as on transcriptional regulation related to cervical cancer cell fates. We found that concentrations of E6 continuously decreased over the course of combination therapy, starting at 6 to 8 hours following administration, and E6 was completely undetectable after 12 hours. Decreasing expression levels of E6 oncoprotein coincided with restoration of TP53 protein, indicating that repression of the E6 oncoprotein is a major contributor to TP53 protein restoration in cervical cancer cells.
Reactivation of TP53 protein in cervical cancer cells by combination therapy may be a critical step in the progression of apoptosis and/or permanent cell cycle arrest (senescence). Furthermore, activated MDM2 binds to TP53, acting as its agonist through an autoregulatory feedback loop mechanism; thereby, it may regulate and sustain TP53 level in both cell lines. Downstream targets, e.g., BAX and APAF-1 (involved in apoptosis), as well as PML and YPEL3 (involved in senescence), were activated or upregulated, respectively. Activation of apoptosis was observed at approximately 16 hours posttreatment and coincided with restoration of TP53 protein. Although induction of TP53-RE-GFP expression varied between cells, most cells underwent apoptosis. Cells that did not experience apoptosis entered into cell cycle arrest after 36 hours of continuous TP53-RE-GFP expression. Our dynamic analysis of TP53 protein revealed that simultaneous inhibition of HPV E6/E7 oncogene expression along with combination of chemotherapy induces TP53 restoration and sensitizes cancer cells to either cell death or cell cycle arrest.
Previous reports suggest that DNA damage increases TP53 protein levels, resulting in p21 activation and induction of E2F1 inactivation, which coordinate cell fate decisions [44], [45]. It is imperative to understand the relationship between TP53 and RB/E2F signaling which may elucidate the mechanisms for variable sensitivity to different therapeutic strategies. This study provides the first simultaneous measurement of E2F and TP53 dynamics using a dual reporter HeLa cell line. Our live cell imaging analysis demonstrate that 17 to 19 hours of E6/E7 SP treatment increases TP53-RE-GFP and decreases E2F-RE-RFP expression, which confirm silencing of E6 and E7 oncoproteins that target TP53 and RB tumor suppressor proteins for ubiquitin-mediated proteosomal degradation [6]. CDDP treatment alone activates TP53 and its target gene p21, and represses expression of E6/E7 [46]. However, when SP is transfected in combination with CDDP, repression of E2F-RE-RFP signaling occurs much sooner. We suggest that CDDP induces the TP53 target gene p21, which produces cell cycle arrest by inactivating the CDKs that mediate phosphorylation of the RB protein. Collectively, these observations support the hypothesis that TP53-induced p21 via E6 oncogene silencing may also contribute to stabilization of RB/E2F complex association by inhibiting cyclin E (Figure 1D) in HPV-positive cancer cells [44], [46]. Finally, we also confirmed the reliability of our dual reporter system for monitoring endogenous TP53 and E2F levels in this cervical cancer model. Our dual reporter model may also be useful for screening novel drug combinations for treatment of cervical cancer.
We also developed an integrated TP53, p21, cyclin E, and E2F1 dynamic model in order to characterize the involvement of SP in conjunction with CDDP-induced DNA damage and restoration of the signaling molecules underlying the cell fate decisions. Although our model was a simple one built with relatively small and short-term observation data, where other DNA damage signaling mediators such as mitogen-activated protein kinase and TP73 (TP53-related gene) [47] were not considered, it successfully quantified the time course of the anticancer effect and signal transduction cascade that preceded cell death.
Multiple combinations of chemotherapeutic agents may reduce the undesirable side effects associated with treatment of CDDP-resistant cervical cancer [27], [28], [48]. Recently, various phases of clinical trial results suggest that multiple combination therapies effectively modulate DNA damage response and sensitize tumors to chemotherapy, giving better outcomes in advanced cervical cancer [49], [50]. The present study aimed to determine whether triple combination of SP, CDDP, and PTX would have improved therapeutic efficacy for treatment of cervical cancer. E6/E7 SP highly sensitized HeLa cells to a low dose of CDDP plus PTX combination treatment. Interestingly, we observed accumulation of cells in the sub-G1 population and induced cell apoptosis, which strongly suggests that triple combination therapy inhibits cell growth, as well as induce DNA fragmentation and apoptotic cell death. Recent advancement in the research focuses on optimized siRNA delivery system such as polymer-based nanoparticles to enhance the rate of cellular uptake. Hence, we also performed single-blinded study to assess the efficacy of polymer-based 16 type E6/E7 SP nanoparticles (i.v. injection) in combination with CDDP (40 μg) and PTX (80 μg) in the CaSki xenograft model, and dramatic tumor growth inhibition was observed (data not shown). All our results demonstrate that triple combination therapy was highly efficacious even with low concentrations of chemotherapeutic drugs. However, further studies in xenograft mice to elucidate the in vivo pharmacokinetics and pharmacodynamics of siRNA nanoparticles with CDDP and/or PTX, as well as assessing the predictability of our dynamics model as a bridge for in vitro and in vivo studies, are planned. Comparison of the TP53 dynamics and RB/E2F signaling mechanisms following SP plus CDDP and triple combination treatment enabled validation of these effective therapeutic strategies. Therefore, we hypothesize that the effects of triple combination therapy on cervical cancer cells occur via induction of TP53 stability by three different mechanisms. First, SP prevents proteosomal degradation of TP53 by inhibiting the E6 oncogene. Second, CDDP treatment results in TP53 activation of DNA damage–dependent mechanisms. Third, PTX induces TP53 activation independently of DNA damage (Figure 7).
Figure 7.

Illustration describing the role of HPV E6/E7 oncogenes and HPV E6/E7 siRNA with cisplatin (CDDP) plus paclitaxel (PTX) therapy on HPV-infected cervical cancer cell fates. HPV-E6 and E7 bind to TP53 and RB (tumor suppressors proteins) and degrade the protein, respectively, leading to repression of p21 (p21WAF1/Cip1) and facilitating free E2Fs through the activation of cyclin/CDK complexes. As a result of triple combination therapy, inactivation of TP53 and RB/E2F pathway is prevented, and TP53, p21, and hypophosphorylated RB (pRB) protein level increases. Overall, high level of TP53 results in cell cycle arrest and cell proliferation inhibition. Arrows indicate a positive effect, while flat lines indicate inhibition.
Along with the stabilization of TP53 and RB/E2F signaling, multiple upstream and downstream target mechanisms have crucial roles in cell fate determination. TP53 is a redox active transcription factor which induces reactive oxygen species (ROS) generation and suppression of antioxidative defense mechanism contributing to TP53-mediated apoptosis. Furthermore, ROS generated as a result of treatment of DNA-damaging agents could also act as an upstream activator of TP53 [51], [52]. Recently, it has been reported that higher cellular ROS level in HPV-positive cells showed reduced cell viability after chemotherapy [53]. It is likely that restored TP53 by E6/E7 SP treatment may play a significant role in ROS-mediated apoptosis in concurrence with CDDP and PTX treatment, contributing to improved responsiveness to therapy. Thus, cellular ROS level could be considered a key factor in determining therapeutic strategies for cervical cancer. In addition, HPV E6/E7 oncogenes influence myriad of upstream transcription factors (e.g., TP53 and E2F) for a large set of host miRNA genes (e.g., miR-34, miR-106b~25 cluster and miR-15/16 cluster) to control the cell cycle progression and apoptosis which lead to cell proliferation and tumorigenesis [54], [55]. Furthermore, HPV E6/E7 oncoproteins directly contribute to cellular miRNAs expression via miRNA processing machinery, specifically through dysregulation of DROSHA-regulated miRNAs, thereby contributing to altered molecular and cellular functions [56]. Hence, restoration of TP53 and RB/E2F signaling by HPV E6/E7 SP could play a pivotal role in the regulation of cellular microRNAs and affect the cell fate determination. In fact, the relationship between HPV status, ROS level, and miRNA biogenesis in response to multiple combination therapy remains an interesting filed for ongoing research.
In summary, our in vitro and in vivo results suggest that simultaneous inhibition of the E6/E7 oncogenes by E6/E7 siRNA greatly enhances the efficacy of chemotherapeutic agents by stimulating TP53 dynamics and repressing E2F activity in cervical cancer cells. In the future, studies are required to optimize the delivery of E6/E7 siRNA. We therefore propose that development of future E6/E7 siRNA nanoparticles as chemosensitizing agents for CDDP plus PTX therapy or with other chemotherapeutic agents may be a promising therapeutic strategy for treating patients with cervical carcinomas.
The following are the supplementary data related to this article.
Supplementary figures (S1 - S6)
Supplementary materials and methods
Supplementary tables (S1 - S5)
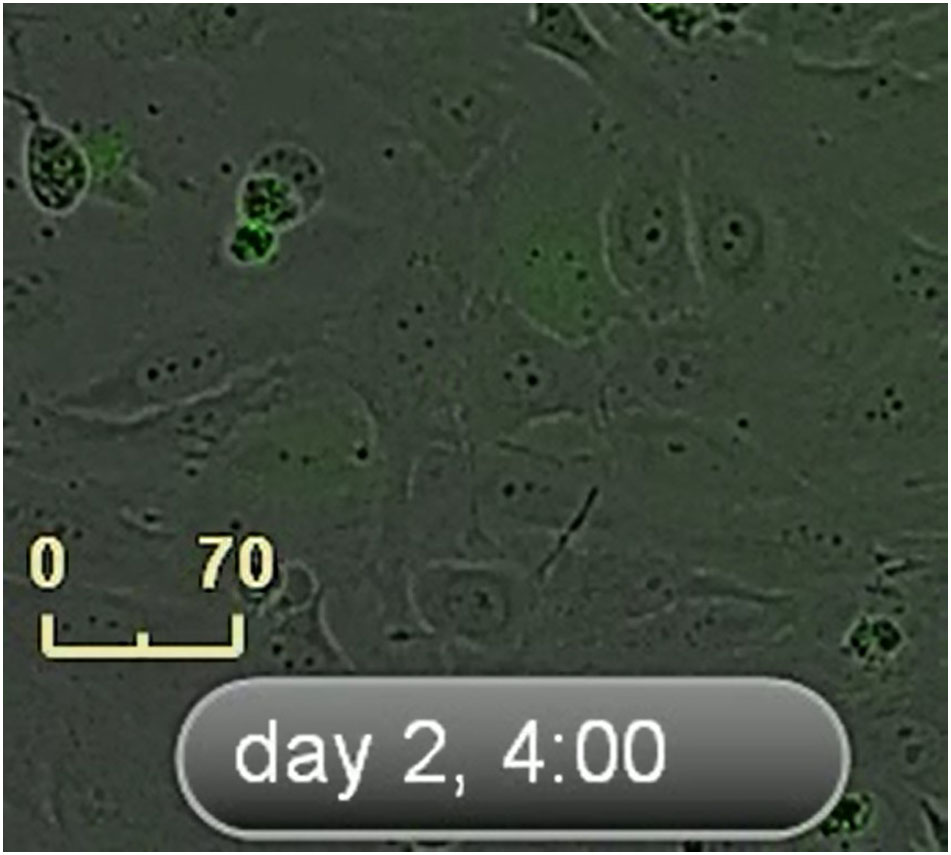
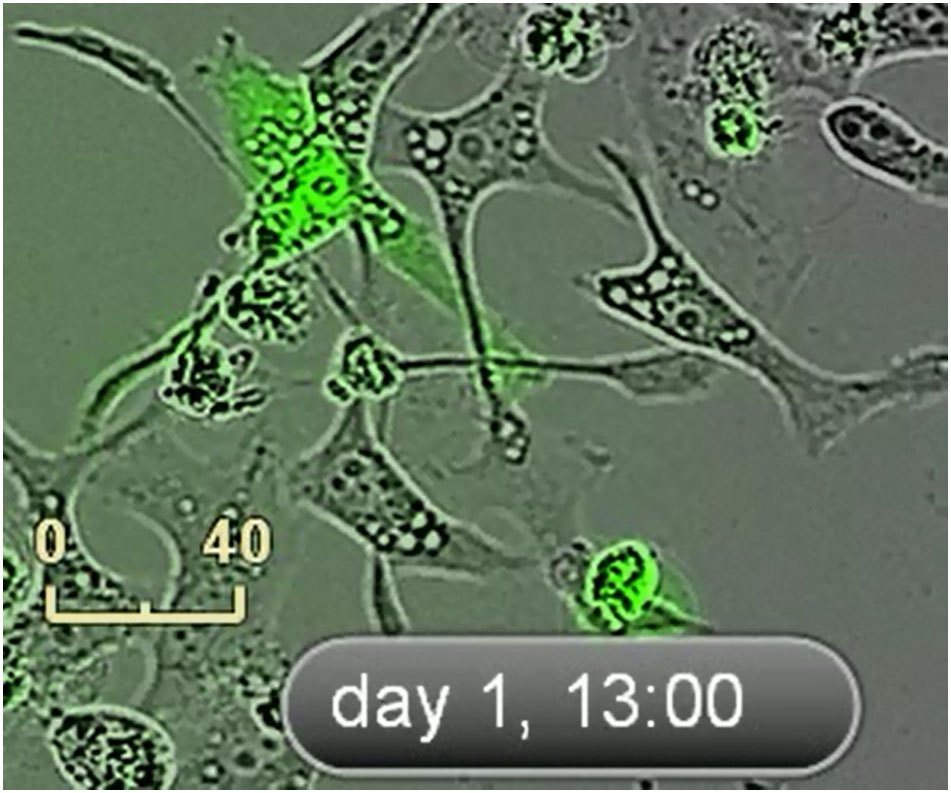
An IncuCyte system was used to take nine images of every well every 1 hour. Time-lapse microscopy images of live TP53-RE-GFP reporter HeLa cells were treated with single therapy of 10 μM of CDDP (scale bar: 70 μm), 20 nM of SP, and combination therapy of SP plus CDDP. Representative IncuCyte images of live cell video recordings made during 3 days. The movie starts immediately after transfection. Scale bar: 40 μm.
After 12 hours of post HPV E6/E7 siRNA pool treatment on dual (E2F-RE-RFP and TP53-RE-GFP) reporter cells was imaged in live-cells confocal microscopy. The movie starts after 18 hours of transfection and ended at 25 hours. Scale bar: 30 μm. Each individual frame was imaged every 20 minutes.
Disclosure of Potential Conflict of Interest
Young Kee Shin and Yoon-La Choi own stock in Abion, Inc. Hun Soon Jung owns stock options in Abion Inc. No potential conflicts of interests were disclosed by the other authors.
Funding
This work was supported by the National Research Foundation of Korea grant for the Global Core Research Center (GCRC) funded by the Korean government (MSIP) No. 2011-0030001 (Young Kee Shin) and the National Research Foundation of Korea grant NRF-2013R1A1A2063951 (Sungyoul Hong).
Authors' Contributions
N. R., H. S. J., and Y. K. S. designed the studies. N. R., H. S. J., S. H., and Y. K. S. collected the data. J. S. C., Y. L. C., and Y. K. S. analyzed and interpreted the data. S. H. B. and D. S. Y. analyzed the modeling data. N. R., H. S. J., C. C., S. H. B., and Y. K. S. wrote and revised the manuscript. Y. K. S. and Y. K. O. provided material supports, and Y. K. S. supervised the study.
Acknowledgments
Acknowledgements
We are very grateful to Professor Zhi-Ming Zheng (National Cancer Institute, National Institutes of Health, Frederick, MD 21702) for his critical review and discussions and to Dr. Ryong Nam Kim (Tumor Microenvironment Global Core Research Center, Seoul National University, Seoul) and Dr. Sang Ho Park (ABION Inc., Seoul) for their comments and discussions.
References
- 1.Doorbar J, Quint W, Banks L, Bravo IG, Stoler M, Broker TR, Stanley MA. The biology and life-cycle of human papillomaviruses. Vaccine. 2012;30(Suppl. 5):F55–70. doi: 10.1016/j.vaccine.2012.06.083. [DOI] [PubMed] [Google Scholar]
- 2.Guan P, Howell-Jones R, Li N, Bruni L, de Sanjose S, Franceschi S, Clifford GM. Human papillomavirus types in 115,789 HPV-positive women: a meta-analysis from cervical infection to cancer. Int J Cancer. 2012;131:2349–2359. doi: 10.1002/ijc.27485. [DOI] [PubMed] [Google Scholar]
- 3.Moody CA, Laimins LA. Human papillomavirus oncoproteins: pathways to transformation. Nat Rev Cancer. 2010;10:550–560. doi: 10.1038/nrc2886. [DOI] [PubMed] [Google Scholar]
- 4.Werness BA, Levine AJ, Howley PM. Association of human papillomavirus types 16 and 18 e6 proteins with p53. Science. 1990;248:76–79. doi: 10.1126/science.2157286. [DOI] [PubMed] [Google Scholar]
- 5.Scheffner M, Werness BA, Huibregtse JM, Levine AJ, Howley PM. The e6 oncoprotein encoded by human papillomavirus types 16 and 18 promotes the degradation of p53. Cell. 1990;63:1129–1136. doi: 10.1016/0092-8674(90)90409-8. [DOI] [PubMed] [Google Scholar]
- 6.Munger K, Baldwin A, Edwards KM, Hayakawa H, Nguyen CL, Owens M, Grace M, Huh K. Mechanisms of human papillomavirus–induced oncogenesis. J Virol. 2004;78:11451–11460. doi: 10.1128/JVI.78.21.11451-11460.2004. [DOI] [PMC free article] [PubMed] [Google Scholar]
- 7.Trimarchi JM, Lees JA. Sibling rivalry in the e2f family. Nat Rev Mol Cell Biol. 2002;3:11–20. doi: 10.1038/nrm714. [DOI] [PubMed] [Google Scholar]
- 8.Vousden KH, Lane DP. P53 in health and disease. Nat Rev Mol Cell Biol. 2007;8:275–283. doi: 10.1038/nrm2147. [DOI] [PubMed] [Google Scholar]
- 9.Muller PA, Vousden KH. P53 mutations in cancer. Nat Cell Biol. 2013;15:2–8. doi: 10.1038/ncb2641. [DOI] [PubMed] [Google Scholar]
- 10.Polager S, Ginsberg D. P53 and e2f: partners in life and death. Nat Rev Cancer. 2009;9:738–748. doi: 10.1038/nrc2718. [DOI] [PubMed] [Google Scholar]
- 11.Aylon Y, Oren M. Living with p53, dying of p53. Cell. 2007;130:597–600. doi: 10.1016/j.cell.2007.08.005. [DOI] [PubMed] [Google Scholar]
- 12.Horn HF, Vousden KH. Coping with stress: multiple ways to activate p53. Oncogene. 2007;26:1306–1316. doi: 10.1038/sj.onc.1210263. [DOI] [PubMed] [Google Scholar]
- 13.Vousden KH, Lu X. Live or let die: the cell's response to p53. Nat Rev Cancer. 2002;2:594–604. doi: 10.1038/nrc864. [DOI] [PubMed] [Google Scholar]
- 14.Batchelor E, Loewer A, Mock C, Lahav G. Stimulus-dependent dynamics of p53 in single cells. Mol Syst Biol. 2011;7:488. doi: 10.1038/msb.2011.20. [DOI] [PMC free article] [PubMed] [Google Scholar]
- 15.Liu B, Bhatt D, Oltvai ZN, Greenberger JS, Bahar I. Significance of p53 dynamics in regulating apoptosis in response to ionizing radiation, and polypharmacological strategies. Sci Rep. 2014;4:6245. doi: 10.1038/srep06245. http://dx.doi.org/0.1038/srep06245. [DOI] [PMC free article] [PubMed] [Google Scholar]
- 16.Lahav G, Rosenfeld N, Sigal A, Geva-Zatorsky N, Levine AJ, Elowitz MB, Alon U. Dynamics of the p53-mdm2 feedback loop in individual cells. Nat Genet. 2004;36:147–150. doi: 10.1038/ng1293. [DOI] [PubMed] [Google Scholar]
- 17.Batchelor E, Mock CS, Bhan I, Loewer A, Lahav G. Recurrent initiation: a mechanism for triggering p53 pulses in response to DNA damage. Mol Cell. 2008;30:277–289. doi: 10.1016/j.molcel.2008.03.016. [DOI] [PMC free article] [PubMed] [Google Scholar]
- 18.Loewer A, Batchelor E, Gaglia G, Lahav G. Basal dynamics of p53 reveal transcriptionally attenuated pulses in cycling cells. Cell. 2010;142:89–100. doi: 10.1016/j.cell.2010.05.031. [DOI] [PMC free article] [PubMed] [Google Scholar]
- 19.Chen X, Chen J, Gan S, Guan H, Zhou Y, Ouyang Q, Shi J. DNA damage strength modulates a bimodal switch of p53 dynamics for cell-fate control. BMC Biol. 2013;11:73. doi: 10.1186/1741-7007-11-73. [DOI] [PMC free article] [PubMed] [Google Scholar]
- 20.Purvis JE, Karhohs KW, Mock C, Batchelor E, Loewer A, Lahav G. P53 dynamics control cell fate. Science. 2012;336:1440–1444. doi: 10.1126/science.1218351. [DOI] [PMC free article] [PubMed] [Google Scholar]
- 21.Wesierska-Gadek J, Schloffer D, Kotala V, Horky M. Escape of p53 protein from e6-mediated degradation in HeLa cells after cisplatin therapy. Int J Cancer. 2002;101:128–136. doi: 10.1002/ijc.10580. [DOI] [PubMed] [Google Scholar]
- 22.Wong JV, Dong P, Nevins JR, Mathey-Prevot B, You L. Network calisthenics: control of e2f dynamics in cell cycle entry. Cell Cycle. 2011;10:3086–3094. doi: 10.4161/cc.10.18.17350. [DOI] [PMC free article] [PubMed] [Google Scholar]
- 23.Iyengar R, Zhao S, Chung SW, Mager DE, Gallo JM. Merging systems biology with pharmacodynamics. Sci Transl Med. 2012;4:126ps127. doi: 10.1126/scitranslmed.3003563. [DOI] [PMC free article] [PubMed] [Google Scholar]
- 24.Jung HS, Erkin OC, Kwon MJ, Kim SH, Jung JI, Oh YK, Her SW, Ju W, Choi YL, Song SY. The synergistic therapeutic effect of cisplatin with human papillomavirus e6/e7 short interfering RNA on cervical cancer cell lines in vitro and in vivo. Int J Cancer. 2012;130:1925–1936. doi: 10.1002/ijc.26197. [DOI] [PubMed] [Google Scholar]
- 25.Jung HS, Rajasekaran N, Song SY, Kim YD, Hong S, Choi HJ, Kim YS, Choi JS, Choi YL, Shin YK. Human papillomavirus e6/e7-specific siRNA potentiates the effect of radiotherapy for cervical cancer in vitro and in vivo. Int J Mol Sci. 2015;16:12243–12260. doi: 10.3390/ijms160612243. [DOI] [PMC free article] [PubMed] [Google Scholar]
- 26.Jia L, Lee HS, Wu CF, Kundu J, Park SG, Kim RN, Wang LH, Erkin OC, Choi JS, Chae SW. Smad4 suppresses AURKA-induced metastatic phenotypes via degradation of AURKA in a TGFbeta-independent manner. Mol Cancer Res. 2014;12:1779–1795. doi: 10.1158/1541-7786.MCR-14-0191. [DOI] [PubMed] [Google Scholar]
- 27.Moore DH, Blessing JA, McQuellon RP, Thaler HT, Cella D, Benda J, Miller DS, Olt G, King S, Boggess JF. Phase III study of cisplatin with or without paclitaxel in stage IVB, recurrent, or persistent squamous cell carcinoma of the cervix: a gynecologic oncology group study. J Clin Oncol. 2004;22:3113–3119. doi: 10.1200/JCO.2004.04.170. [DOI] [PubMed] [Google Scholar]
- 28.Monk BJ, Sill MW, McMeekin DS, Cohn DE, Ramondetta LM, Boardman CH, Benda J, Cella D. Phase III trial of four cisplatin-containing doublet combinations in stage IVB, recurrent, or persistent cervical carcinoma: a gynecologic oncology group study. J Clin Oncol. 2009;27:4649–4655. doi: 10.1200/JCO.2009.21.8909. [DOI] [PMC free article] [PubMed] [Google Scholar]
- 29.Reagan-Shaw S, Nihal M, Ahmad N. Dose translation from animal to human studies revisited. FASEB J. 2008;22:659–661. doi: 10.1096/fj.07-9574LSF. [DOI] [PubMed] [Google Scholar]
- 30.Chou TC, Talalay P. Quantitative analysis of dose-effect relationships: the combined effects of multiple drugs or enzyme inhibitors. Adv Enzyme Regul. 1984;22:27–55. doi: 10.1016/0065-2571(84)90007-4. [DOI] [PubMed] [Google Scholar]
- 31.Banin S, Moyal L, Shieh S, Taya Y, Anderson CW, Chessa L, Smorodinsky NI, Prives C, Reiss Y, Shiloh Y. Enhanced phosphorylation of p53 by ATM in response to DNA damage. Science. 1998;281:1674–1677. doi: 10.1126/science.281.5383.1674. [DOI] [PubMed] [Google Scholar]
- 32.Klibanov SA, O'Hagan HM, Ljungman M. Accumulation of soluble and nucleolar-associated p53 proteins following cellular stress. J Cell Sci. 2001;114:1867–1873. doi: 10.1242/jcs.114.10.1867. [DOI] [PubMed] [Google Scholar]
- 33.el-Deiry WS, Tokino T, Velculescu VE, Levy DB, Parsons R, Trent JM, Lin D, Mercer WE, Kinzler KW, Vogelstein B. Waf1, a potential mediator of p53 tumor suppression. Cell. 1993;75:817–825. doi: 10.1016/0092-8674(93)90500-p. [DOI] [PubMed] [Google Scholar]
- 34.Nevins JR. Toward an understanding of the functional complexity of the e2f and retinoblastoma families. Cell Growth Differ. 1998;9:585–593. [PubMed] [Google Scholar]
- 35.Ohtsubo M, Roberts JM. Cyclin-dependent regulation of g1 in mammalian fibroblasts. Science. 1993;259:1908–1912. doi: 10.1126/science.8384376. [DOI] [PubMed] [Google Scholar]
- 36.Riley T, Sontag E, Chen P, Levine A. Transcriptional control of human p53-regulated genes. Nat Rev Mol Cell Biol. 2008;9:402–412. doi: 10.1038/nrm2395. [DOI] [PubMed] [Google Scholar]
- 37.Cohen AA, Geva-Zatorsky N, Eden E, Frenkel-Morgenstern M, Issaeva I, Sigal A, Milo R, Cohen-Saidon C, Liron Y, Kam Z. Dynamic proteomics of individual cancer cells in response to a drug. Science. 2008;322:1511–1516. doi: 10.1126/science.1160165. [DOI] [PubMed] [Google Scholar]
- 38.Chellappan S, Kraus VB, Kroger B, Munger K, Howley PM, Phelps WC, Nevins JR. Adenovirus e1a, simian virus 40 tumor antigen, and human papillomavirus e7 protein share the capacity to disrupt the interaction between transcription factor e2f and the retinoblastoma gene product. Proc Natl Acad Sci U S A. 1992;89:4549–4553. doi: 10.1073/pnas.89.10.4549. [DOI] [PMC free article] [PubMed] [Google Scholar]
- 39.Siddik ZH. Biochemical and molecular mechanisms of cisplatin resistance. Cancer Treat Res. 2002;112:263–284. doi: 10.1007/978-1-4615-1173-1_13. [DOI] [PubMed] [Google Scholar]
- 40.Go RS, Adjei AA. Review of the comparative pharmacology and clinical activity of cisplatin and carboplatin. J Clin Oncol. 1999;17:409–422. doi: 10.1200/JCO.1999.17.1.409. [DOI] [PubMed] [Google Scholar]
- 41.Davidson BL, McCray PB., Jr. Current prospects for rna interference-based therapies. Nat Rev Genet. 2011;12:329–340. doi: 10.1038/nrg2968. [DOI] [PMC free article] [PubMed] [Google Scholar]
- 42.Jung HS, Rajasekaran N, Ju W, Shin YK. Human papillomavirus: current and future RNAi therapeutic strategies for cervical cancer. J Clin Med. 2015;4:1126–1155. doi: 10.3390/jcm4051126. [DOI] [PMC free article] [PubMed] [Google Scholar]
- 43.Bumcrot D, Manoharan M, Koteliansky V, Sah DW. RNAi therapeutics: a potential new class of pharmaceutical drugs. Nat Chem Biol. 2006;2:711–719. doi: 10.1038/nchembio839. [DOI] [PMC free article] [PubMed] [Google Scholar]
- 44.He G, Siddik ZH, Huang Z, Wang R, Koomen J, Kobayashi R, Khokhar AR, Kuang J. Induction of p21 by p53 following DNA damage inhibits both CDK4 and CDK2 activities. Oncogene. 2005;24:2929–2943. doi: 10.1038/sj.onc.1208474. [DOI] [PubMed] [Google Scholar]
- 45.Zhang XP, Liu F, Wang W. Coordination between cell cycle progression and cell fate decision by the p53 and e2f1 pathways in response to DNA damage. J Biol Chem. 2010;285:31571–31580. doi: 10.1074/jbc.M110.134650. [DOI] [PMC free article] [PubMed] [Google Scholar]
- 46.Butz K, Geisen C, Ullmann A, Spitkovsky D, Hoppe-Seyler F. Cellular responses of HPV-positive cancer cells to genotoxic anti-cancer agents: repression of e6/e7-oncogene expression and induction of apoptosis. Int J Cancer. 1996;68:506–513. doi: 10.1002/(SICI)1097-0215(19961115)68:4<506::AID-IJC17>3.0.CO;2-2. [DOI] [PubMed] [Google Scholar]
- 47.Tanida S, Mizoshita T, Ozeki K, Tsukamoto H, Kamiya T, Kataoka H, Sakamuro D, Joh T. Mechanisms of cisplatin-induced apoptosis and of cisplatin sensitivity: potential of bin1 to act as a potent predictor of cisplatin sensitivity in gastric cancer treatment. Int J Surg Oncol. 2012;2012:862879. doi: 10.1155/2012/862879. 8 pages. [DOI] [PMC free article] [PubMed] [Google Scholar]
- 48.Fiorica J, Holloway R, Ndubisi B, Orr J, Grendys E, Boothby R, DeCesare S, LaPolla J, Hoffman M, Patel J. Phase ii trial of topotecan and cisplatin in persistent or recurrent squamous and nonsquamous carcinomas of the cervix. Gynecol Oncol. 2002;85:89–94. doi: 10.1006/gyno.2001.6557. [DOI] [PubMed] [Google Scholar]
- 49.Cossar LH, Schache AG, Risk JM, Sacco JJ, Jones NJ, Lord R. Modulating the DNA damage response to improve treatment response in cervical cancer. Clin Oncol. 2017;29(9):626–634. doi: 10.1016/j.clon.2017.03.002. [DOI] [PubMed] [Google Scholar]
- 50.Rosen VM, Guerra I, McCormack M, Nogueira-Rodrigues A, Sasse A, Munk VC, Shang A. Systematic review and network meta-analysis of bevacizumab plus first-line topotecan-paclitaxel or cisplatin-paclitaxel versus non-bevacizumab-containing therapies in persistent, recurrent, or metastatic cervical cancer. Int J Gynecol Cancer. 2017;27:1237–1246. doi: 10.1097/IGC.0000000000001000. [DOI] [PMC free article] [PubMed] [Google Scholar]
- 51.Liu B, Chen Y, St Clair DK. Ros and p53: a versatile partnership. Free Radic Biol Med. 2008;44:1529–1535. doi: 10.1016/j.freeradbiomed.2008.01.011. [DOI] [PMC free article] [PubMed] [Google Scholar]
- 52.Johnson TM, Yu ZX, Ferrans VJ, Lowenstein RA, Finkel T. Reactive oxygen species are downstream mediators of p53-dependent apoptosis. Proc Natl Acad Sci U S A. 1996;93:11848–11852. doi: 10.1073/pnas.93.21.11848. [DOI] [PMC free article] [PubMed] [Google Scholar]
- 53.Filippova M, Filippov V, Williams VM, Zhang K, Kokoza A, Bashkirova S, Duerksen-Hughes P. Cellular levels of oxidative stress affect the response of cervical cancer cells to chemotherapeutic agents. Biomed Res Int. 2014;2014:574659. doi: 10.1155/2014/574659. 14 pages. [DOI] [PMC free article] [PubMed] [Google Scholar]
- 54.Zheng ZM, Wang X. Regulation of cellular miRNA expression by human papillomaviruses. Biochim Biophys Acta. 1809;2011:668–677. doi: 10.1016/j.bbagrm.2011.05.005. [DOI] [PMC free article] [PubMed] [Google Scholar]
- 55.Harden ME, Prasad N, Griffiths A, Munger K. Modulation of microRNA-mRNA target pairs by human papillomavirus 16 oncoproteins. MBio. 2017;8(1):e02170-16. doi: 10.1128/mBio.02170-16. 14 pages. [DOI] [PMC free article] [PubMed] [Google Scholar]
- 56.Harden ME, Munger K. Perturbation of Drosha and dicer expression by human papillomavirus 16 oncoproteins. Virology. 2017;507:192–198. doi: 10.1016/j.virol.2017.04.022. [DOI] [PMC free article] [PubMed] [Google Scholar]
Associated Data
This section collects any data citations, data availability statements, or supplementary materials included in this article.
Supplementary Materials
Supplementary figures (S1 - S6)
Supplementary materials and methods
Supplementary tables (S1 - S5)
An IncuCyte system was used to take nine images of every well every 1 hour. Time-lapse microscopy images of live TP53-RE-GFP reporter HeLa cells were treated with single therapy of 10 μM of CDDP (scale bar: 70 μm), 20 nM of SP, and combination therapy of SP plus CDDP. Representative IncuCyte images of live cell video recordings made during 3 days. The movie starts immediately after transfection. Scale bar: 40 μm.
After 12 hours of post HPV E6/E7 siRNA pool treatment on dual (E2F-RE-RFP and TP53-RE-GFP) reporter cells was imaged in live-cells confocal microscopy. The movie starts after 18 hours of transfection and ended at 25 hours. Scale bar: 30 μm. Each individual frame was imaged every 20 minutes.