

Summary
Target of rapamycin complex 1 (TORC1) integrates nutrient signals to control cell growth and organismal homeostasis across eukaryotes1–4. The evolutionarily conserved GATOR complex regulates TORC1 signaling through Rag GTPases with GATOR1 displaying GTPase activating protein (GAP) activity towards RagA/B and GATOR2 proposed as an inhibitor of GATOR15,6. Furthermore, the metazoan-specific Sestrin proteins function as guanine nucleotide dissociation inhibitors (GDIs) for RagA/B, and interact with GATOR2 with unknown functions7–9. Here we show that SZT2, a metazoan-specific protein mutated in epilepsy10–13, recruits a fraction of mammalian GATOR1 and GATOR2 to form SZT2-Orchestrated GATOR (SOG) complex with an essential role in GATOR- and Sestrin-dependent nutrient sensing and mTORC1 regulation. SZT2 interaction with GATOR1 and GATOR2 was cooperative, and an integral SOG was required for its localization on the lysosome. SZT2 deficiency resulted in constitutive mTORC1 signaling in cells under nutrient deprivation conditions and neonatal lethality in mice associated with failed mTORC1 inactivation during fasting. mTORC1 hyperactivation in SZT2-deficient cells could be partially corrected by overexpression of the GATOR1 component DEPDC5, and by a lysosome-targeted GATOR2 component WDR59 or a lysosome-targeted Sestrin2. These findings demonstrate a central role of SZT2 in dictating GATOR-dependent nutrient sensing by promoting lysosomal localization of SOG, and reveal an unexpected function of lysosome-located GATOR2 in suppressing mTORC1 signaling via Sestrin recruitment.
Nutrients promote mTORC1 signaling by recruitment of mTORC1 to the lysosome via Rag GTPases14–19. GATOR1, composed of DEPDC5, NPRL2 and NPRL3, is a GAP for RagA/B, and GATOR2, made of WDR59, WDR24, MIOS, SEC13 and SEH1L, might be an antagonist of GATOR15. Sestrins are GDIs for RagA/B7 and bind to GATOR28,9 in an amino acid-sensitive manner20. While all GATOR orthologs are present in yeast as components of the SEA complex21–24, GATOR1 and GATOR2 are loosely associated in mammalian cells5, implying additional component(s) may exist in metazoans to modulate GATOR1 and GATOR2 interaction.
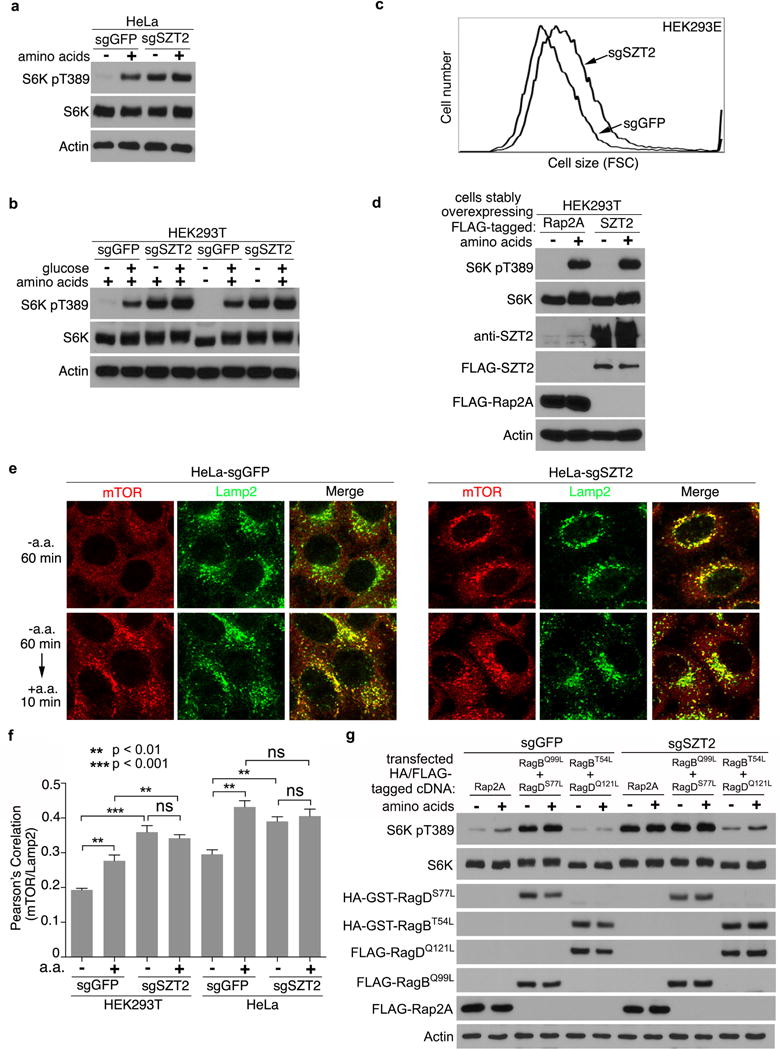
Mutations of the metazoan-specific SZT2 (Seizure threshold 2) gene caused epilepsy10–13, a disease frequently associated with mTORC1 hyperactivation25. We identified SZT2 as a component of the Sestrin2 interactome (see below and data not shown). Single-guide RNA-mediated deletion of SZT2 rendered mTORC1 signaling insensitive to amino acid deprivation, as revealed by phosphorylation of S6K, S6, and 4E-BP1 (Fig. 1a and Extended Data Fig. 1a). Furthermore, neither glucose deprivation nor combined depletion of amino acids and glucose could inactivate mTORC1 in SZT2-deficient cells, while serum starvation could do so (Fig. 1b and Extended Data Fig. 1b). SZT2-deficient cells had bigger size than control cells, but SZT2 overexpression could not inhibit mTORC1 activation (Extended Data Fig. 1c, d), demonstrating that SZT2 is necessary but not sufficient to suppress the nutrient arm of mTORC1 signaling. Indeed, SZT2 deficiency resulted in constitutive mTORC1 localization on the lysosome irrespective of the nutrient status (Fig. 1c and Extended Data Fig. 1e, f). Overexpression of dominant negative mutants of Rag GTPases or depletion of RagA/B blunted mTORC1 activation in SZT2-deficient cells (Fig. 1d and Extended Data Fig. 1g), revealing that SZT2 functions upstream of Rag GTPases to control mTORC1 signaling.
Figure 1. SZT2 is essential for mTORC1 inactivation upon nutrient deprivation and functions upstream of Rag GTPases.
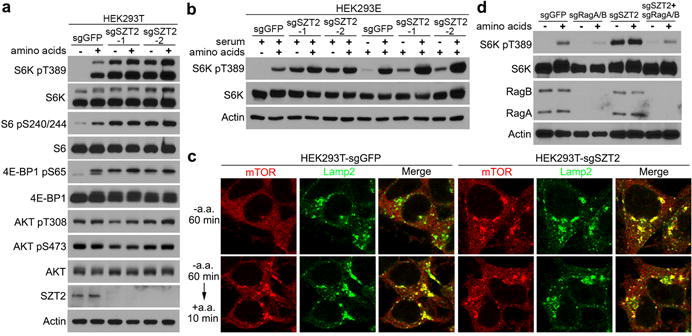
a, b and d, Control (sgGFP) or SZT2-deficient (sgSZT2) cells were deprived of amino acids (a, b) or serum (b) for 1 h and stimulated with amino acids (a, b) or serum (b) for 10 min when indicated. Total cell lysates were analyzed by immunoblotting. c, Cells were treated as in (a). The localization of mTOR and Lamp2 was determined by immunostaining. See Extended Data Fig. 1f for statistical analyses. Data (a, b, d) are representatives of three independent experiments.
Mass spectrometry experiments uncovered GATOR components as SZT2-interacting proteins (Extended Data Fig. 2a). To interrogate such interactions, a FLAG tag was knocked into the SZT2 locus in HEK293T cells (Extended Data Fig. 2, b – e). With FLAG-tagged red fluorescent protein (RFP) and DEPDC5 as controls, we found that FLAG-SZT2 pulled down NPRL3 and NPRL2 as well as MIOS and WDR24 but not Rag GTPases (Fig. 2a). Consistent with previous findings that GATOR1 and GATOR2 exist largely as independent complexes5, endogenous WDR24 co-immunoprecipitated efficiently with WDR59 and MIOS but not NPRL2 or NPRL3, whereas NPRL3 pulled down NPRL2 but not WDR59, WDR24 or MIOS. Nonetheless, SZT2 co-immunoprecipitated with both GATOR1 and GATOR2 (Fig. 2b). Although Sestrin2 was undetectable in the immunoprecipitate of SZT2, Sestrin2 pulled down GATOR2, GATOR1 and SZT2 (Fig. 2b).
Figure 2. SZT2 connects GATOR1 and GATOR2 to form SOG.
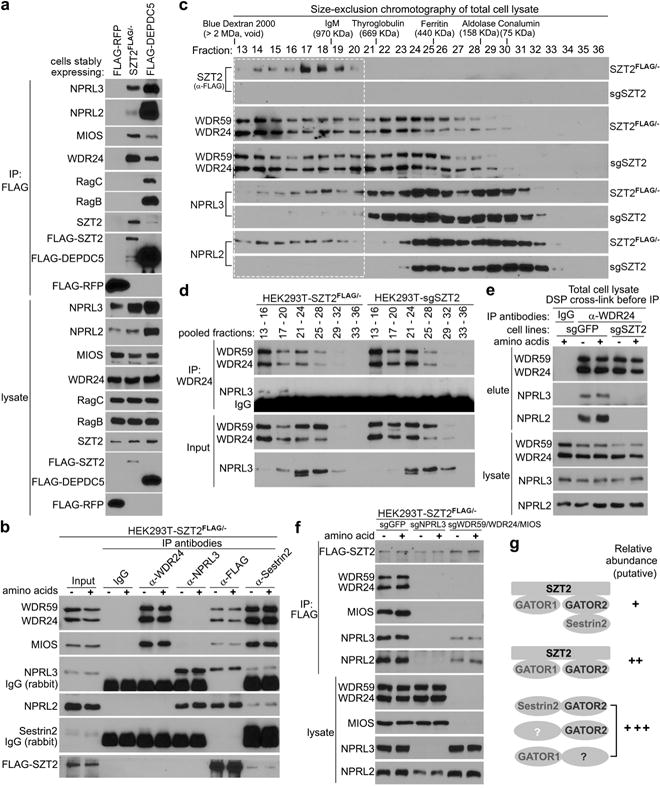
a, Anti-FLAG immunoprecipitates and total cell lysates were analyzed by immunoblotting. b and f, Cells were deprived of amino acids for 1 h and stimulated with amino acids for 20 min when indicated. Immunoprecipitates and cell lysates were analyzed by immunoblotting. c, Size-exclusion chromatography of cell lysates were analyzed by immunoblotting. The dashed box indicates SZT2-containing fractions. d, Anti-WDR24 immunoprecipitation of pooled fractions from (c) and inputs were analyzed by immunoblotting. e, Cells were treated as in (b), and anti-WDR24 immunoprecipitation was performed after in-cell crosslink and analyzed as in (b). Data (a – f) are representatives of two independent experiments. g, SOG and other GATOR-containing protein complexes and their relative abundance in cells according to b – d.
Size-exclusion chromatography (SEC) experiments revealed that GATOR components were broadly distributed, but SZT2 was enriched in fractions with a peak molecular weight around 1.06 MDa (Fig. 2c), which is close to the size of a predicted trimeric SZT2-GATOR1-GATOR2 complex (~ 1.03 MDa). Indeed, the purified SZT2 complex contained both GATOR1 and GATOR2 components (Extended Data Fig. 2f, g). Furthermore, WDR24 pulled down NPRL3 only in SZT2-containing SEC fractions (Fig. 2c, d), and SZT2 deficiency depleted NPRL2 and NPRL3 from these fractions (Fig. 2c). In a sucrose density gradient centrifugation assay, co-sedimentation of GATOR1 and GATOR2 components at high sucrose density was also diminished in SZT2-deficient cells (Extended Data Fig. 2h). Nonetheless, GATOR2 mobility on SEC did not substantially change upon SZT2 loss (Fig. 2c), implying additional GATOR2-containing high molecular weight complexes.
SZT2-dependent GATOR1-GATOR2 interaction was validated by crosslinking-assisted immunoprecipitation with total cell lysate as an input (Fig. 2e). Furthermore, SZT2-GATOR2 interaction was lost in the absence of NPRL3, and SZT2-GATOR1 interaction was substantially diminished in the absence of WDR59, WDR24 and MIOS (Fig. 2f), suggesting cooperative binding among SZT2, GATOR1 and GATOR2. Collectively, these observations reveal multiple GATOR-containing complexes (Fig. 2g), and SZT2 unites a pool of GATOR1 and GATOR2 to form SOG.
SZT2-GATOR interaction was not modulated by amino acids, and the stable SOG complex endured washes with 1.5 M sodium chloride (Fig. 2b, e, f and Extended Data Fig. 3a, b). SZT2 did not bind to the mTORC1-modulating amino acids leucine, arginine or glutamine, and SZT2 deficiency did not perturb Sestrin2 binding to leucine (Extended Data Fig. 3c, d)20. Furthermore, Sestrin2 interaction with GATOR2 was unperturbed in the absence of SZT2, and Sestrin2 overexpression did not affect SZT2, GATOR1 and GATOR2 interaction (Extended Data Fig. 3e, f). Thus, SZT2 does not appear to be an amino acid sensor and Sestrin2 unlikely regulates mTORC1 signaling by disrupting SOG.
SZT2 is a 3432-amino acid protein with no discernible homology to other proteins. A C-terminal deletion mutant of SZT2 (1 – 2334) retained GATOR1 binding activity, but could not rectify mTORC1 signaling in SZT2-deficient cells (Extended Data Fig. 4a, b, f). Deletion of a small portion (a.a. 1083 – 1189) within the GATOR1-binding region (a.a. 935 – 1734) created a SZT2 mutant, SZT2 (Δ1083–1189), that had minimal GATOR1 binding but preserved GATOR2 interaction (Extended Data Fig. 4c, d). However, neither expression of SZT2 (Δ1083–1189) nor co-expression of SZT2 (1 – 2334) and SZT2 (Δ1083–1189) could rescue mTORC1 hyperactivation in SZT2-deficient cells (Extended Data Fig. 4e), suggesting that an intact SOG is required for SZT2 control of mTORC1 signaling.
SZT2 was colocalized with the lysosome markers Lamp1 and Lamp2 and the late endosome/lysosome maker Rab7, but not with the early endosome marker EEA1 or the peroxisome marker PMP7026 (Fig. 3a and Extended Data Fig. 5a, c – f). In addition, a pool of WDR59 was colocalized with SZT2 on the lysosome (Extended Data Fig. 5b, c, f). Lysosomal localization of SZT2 was disrupted in NPRL3-deficient cells, and reduced in WDR59-, WDR24- and MIOS-deficient cells (Fig. 3, a – d). Furthermore, lysosomal localization of WDR59 was abolished in the absence of SZT2, NPRL3 or DEPDC5 (Fig. 3, e – h and Extended Data Fig. 5, g – i), and co-sedimentation of NPRL3 and NPRL2 with Lamp1 was diminished in SZT2-deficient cells (Extended Data Fig. 2h). However, lysosomal localization of SOG was not modulated by amino acids or the mTORC1 inhibitor rapamycin (Fig. 3, Extended Data Fig. 5, c – g, j and data not shown). These observations demonstrate that the integrity of SOG is crucial for its localization on the lysosome.
Figure 3. An integral SOG complex is critical for its lysosomal localization.
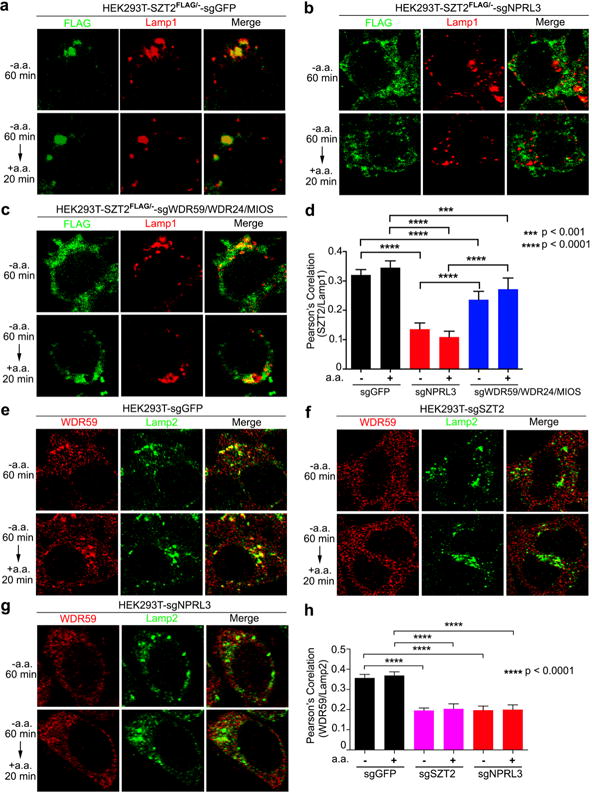
a – c and e – g, Cells were deprived of amino acids for 1 h and stimulated with amino acids for 20 min when indicated. The localization of SZT2 and Lamp1 (a – c), or WDR59 and Lamp2 (e – g) was determined by immunostaining. d and h, Quantification of colocalization between SZT2 and Lamp1 (d), or WDR59 and Lamp2 (h). Data represent mean ± SD. 100 cells were analyzed under each condition with two-tailed unpaired t-test.
To explore how SZT2 orchestrates GATOR to control mTORC1 signaling, we performed functional rescue experiments. Overexpression of DEPDC5, but not Sestrin2, partially inhibited mTORC1 activation in SZT2-deficient cells (Fig. 4a), suggesting that SZT2 represses mTORC1 in part through GATOR1 and Sestrin2 requires SZT2 to function. Depletion of WDR24, MIOS or WDR59, or deletion of both WDR24 and MIOS led to diminished mTORC1 signaling in control cells but not in SZT2-deficient cells (Extended Data Fig. 6a, b). However, mTORC1 signaling was partially rectified in SZT2-deficient cells when WDR24, WDR59 and MIOS were deleted altogether (Fig. 4b and Extended Data Fig. 6c), which was reminiscent of redundant functions of their orthologs in yeast6. Furthermore, depletion of SEH1L inhibited mTORC1 signaling in control cells, and partially suppressed mTORC1 activation in SZT2-deficient cells (Extended Data Fig. 6d). These observations reveal that GATOR2 can promote mTORC1 signaling via SZT2-independent mechanisms, but its optimal function requires SZT2.
Figure 4. Lysosome-targeted WDR59 or Sestrin2 inhibits mTORC1 signaling in the absence of SZT2 or GATOR1.
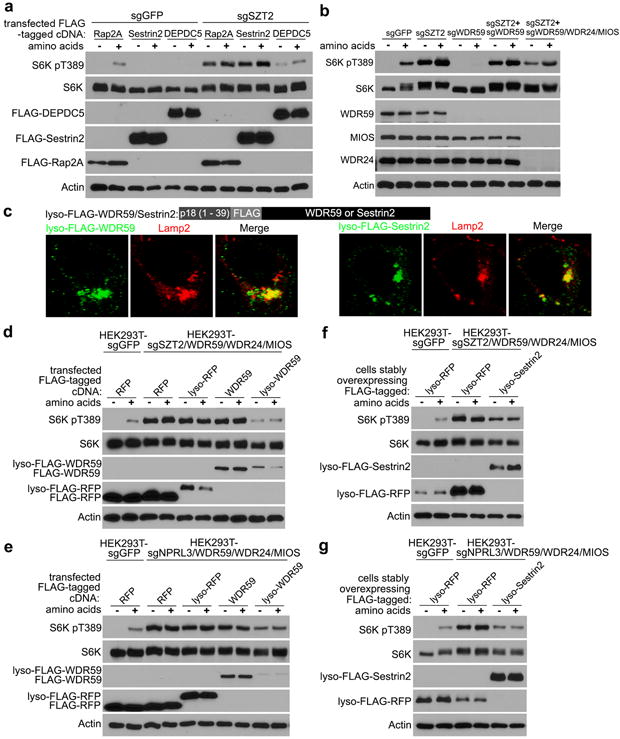
a, Cells, transfected with the indicated constructs and selected with puromycin, were deprived of amino acids for 1 h and stimulated with amino acids for 10 min when indicated. Total cell lysates were analyzed by immunoblotting. b, Cells were deprived of amino acids for 1 h and stimulated with amino acids for 10 min when indicated, and analyzed as in (a). c, SZT2/WDR59/WDR24/MIOS-deficient HEK293T cells were transfected with lyso-FLAG-WDR59/Sestrin2. The localization of lyso-FLAG-WDR59/Sestrin2 was determined by immunostaining. d, e, Cells were transfected with the indicated constructs and selected with puromycin, and analyzed as in (a). f and g, Cells stably expressing the indicated proteins were analyzed as in (b). Data (a – g) are representatives of two independent experiments.
To investigate whether GATOR2 mislocalization in SZT2-deficient cells might affect mTORC1 signaling, we targeted GATOR2 components back to the lysosome (Fig. 4c and data not shown). While expression of neither wild-type nor lysosome-targeted WDR59, WDR24 or MIOS substantially affected mTORC1 signaling in control cells (Extended Data Fig. 7a, b), expression of lyso-WDR59, and to a lesser extent lyso-WDR24 or lyso-MIOS inhibited mTORC1 signaling in SZT2-deficient cells (Extended Data Fig. 7c, d, 8a, b). Such an unexpected inhibitory function of lysosomal WDR59 was corroborated by the observation that WDR59 deficiency resulted in partial resistance to nutrient starvation-triggered mTORC1 inactivation in human HEK293T cells and mouse embryonic fibroblasts (MEFs) (Extended Data Fig. 7, e – g).
Depletion of endogenous WDR59 potentiated lyso-WDR59-triggered mTORC1 inhibition in SZT2-deficient cells (Extended Data Fig. 7h), and lyso-WDR59 almost completely suppressed mTORC1 signaling when endogenous WDR59, WDR24 and MIOS were deleted (Fig. 4d). In addition, lyso-WDR59 inhibited mTORC1 in GATOR1-deficient cells but not in cells expressing a constitutively active form of RagB or a lysosome-targeted Raptor (Fig. 4e and Extended Data Fig. 8, a – d), implying that lysosomal WDR59 functions downstream of or in parallel with GATOR1, but upstream of Rag GTPases, to repress mTORC1 signaling. To investigate whether lyso-WDR59 might suppress mTORC1 through Sestrin recruitment, we expressed a form of lysosome-targeted Sestrin2, and found that it inhibited mTORC1 signaling in SZT2- or GATOR1-deficient cells in the absence or presence of GATOR2 (Fig. 4f, g and Extended Data Fig. 8e). These findings imply a surprising role of the SOG-associated GATOR2 in mTORC1 repression via recruitment of Sestrins to the lysosome.
To investigate the in vivo function of SZT2, we used a mouse strain with a gene-trap mutation of the Szt2 gene10. Although Szt2−/− mice were born at an expected Mendelian ratio, they could not be recovered at weaning age (Fig. 5a, b and Extended Data Fig. 9a, b). Indeed, Szt2−/− neonates all succumbed to death upon fasting, which was associated with enhanced mTORC1 signaling in multiple organs (Fig. 5, c – e and Extended Data Fig. 9, c – e), and was reminiscent of the phenotypes developed in RagAGTP/GTP mice and Sestrin-deficient mice7,27. In Szt2−/− MEFs, mTORC1 could not be repressed by deprivation of amino acids or amino acids plus glucose (Extended Data Fig. 9f, g, h), and was constitutively localized on the lysosome (Extended Data Fig. 9i). In contrast, serum starvation inhibited mTORC1 activation (Extended Data Fig. 9j), supporting a specific function of Szt2 in nutrient-dependent mTORC1 signaling.
Figure 5. Szt2 deficiency results in neonatal lethality and nutrient-independent mTORC1 signaling in mice.
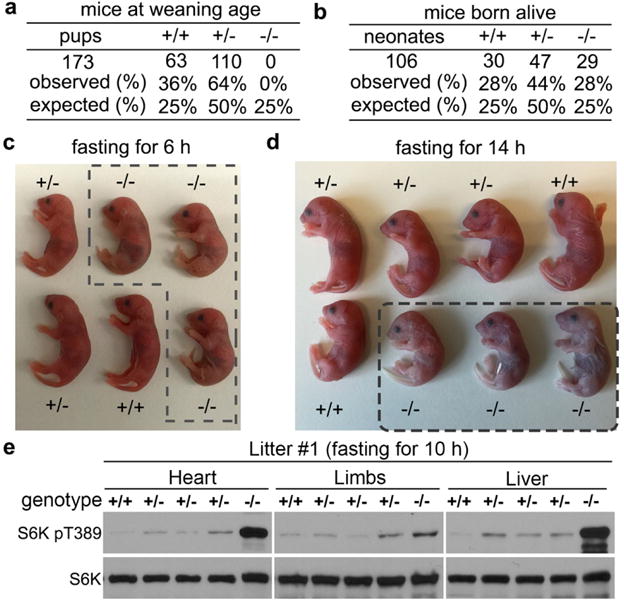
a, b, Pups (a) or neonates (b) from Szt2+/− parents were enumerated at the weaning age (3 weeks) (a) or at birth (b). The numbers of pups/neonates as well as the observed and expected frequencies are shown. c, Neonates of the indicated genotypes were fasted for 6 h. Szt2−/− mice are boxed with the dashed lines. d, Neonates of the indicated genotypes were fasted for 14 h. All Szt2−/− mice (boxed with dashed lines) died at the end of fasting, while mice with the other genotypes survived. e, Neonates were fasted for 10 h. Total cell lysates prepared from the indicated organs were analyzed by immunoblotting. Data are representatives of two independent experiments.
The identification of SZT2 as a scaffold molecule that unites a portion of GATOR1 and GATOR2 to form lysosomal SOG provides novel insights into the nutrient sensing pathway in multicellular eukaryotes (Extended Data Fig. 10). SZT2 deficiency results in GATOR mislocalization, revealing a critical role of SZT2 in supporting GATOR1 GAP function. Furthermore, SZT2 and GATOR1 act as anchors of SOG to recruit GATOR2 to the lysosome with a role in mTORC1 suppression via recruitment of the Sestrin family of GDIs. A dual function of GATOR2 in mTORC1 activation and repression implies that GATOR2 may have been adapted to promote robust nutrient sensing in metazoans.
METHODS
No statistical methods were used to predetermine sample size. The experiments were not randomized and the investigators were not blinded to allocation during experiments and outcome assessment.
Mice, MEFs and Cell Lines
Szt2+/− mice (B6.129P2-Szt2Gt(XH662)Byg/FrkJ.) were obtained from Jackson Laboratory (Stock Number: 010916). E19.5 pregnant females from timed breeding were monitored closely. Immediately after the delivery of first pup, Caesarean section was performed and fetuses were obtained. Successfully resuscitated neonates were numbered and placed in a humidified chamber at 30 °C. After fasting, liver, heart and limbs were harvested and immediately put into cell lysis buffer and snap frozen by dry ice and stored at −80 °C. Total cell lysates were prepared after genotyping, and mTORC1 signaling in different organs were determined by immunoblotting. Primary Szt2+/+ and Szt2−/− MEFs were prepared from day E14.5 embryos, primary Wdr59+/+ and Wdr59−/− MEFs were prepared from E7 embryos (unpublished data), and all experiments were performed with MEFs that had less than 4 passages. All mice were maintained in a specific pathogen-free facility and animal experimentation was conducted in accordance with institutional guidelines.
HEK293 cells and HeLa cells were from ATCC. Cells were maintained with DMEM (25 mM glucose) supplemented with 10% FBS, 100 u/ml penicillin and 100 mg/ml streptomycin. Cell lines were authenticated and mycoplasma negative.
Generation of Knockout and Knockin Cell Lines
To generate gene knockout cell lines, guide RNAs were cloned into LentiCrisprV2 (Addgene #52961). Cells were transfected with plasmids targeting specific genes and selected with puromycin for 3 days. Cells survived the selection were plated in 96-well plates using limited dilution method with approximately one cell per well. After two weeks, single cell clones were expanded and screened by immunoblotting for target protein depletion.
To generate the knockin allele of SZT2, a guide RNA targeting the first coding exon of SZT2 (sgSZT2ATG) was cloned into LentiCrisprV2. To insert a FLAG tag into this site via homologous recombination, we generated a double-stranded DNA with FLAG coding sequence followed by a GG linker that was flanked on either side by 40 base pairs of sequence surrounding the SZT2 start codon. Silent mutations were also included to generate mismatch with the gRNA to prevent retargeting of the modified locus. 100 ng double-stranded DNA along with 2 μg LentiCripsrV2-sgSZT2ATG was transfected into one million HEK293T cells. Cells were selected with puromycin for 3 days. Cells survived the selection were plated in 96-well plates using limited dilution method. After two weeks, single cell clones were expanded and screened by immunoblotting with a FLAG antibody. Positive clones were further validated by sequencing of the targeted genomic loci.
The following primers were used to clone sgRNA into LentiCrisprV2:
sgSZT2-1F caccgCTCTCACCGCAGTAATATTC
sgSZT2-1R aaacGAATATTACTGCGGTGAGAGc
sgSZT2-2F caccgGCACCCACGTGTCATGCTCC
sgSZT2-2R aaacGGAGCATGACACGTGGGTGCc
sgSZT2-3F caccgGAAGAGTGGCACTCCGCTCT
sgSZT2-3R aaacAGAGCGGAGTGCCACTCTTCc
sgSZT2ATG-F caccgCTCCGGCTCCGGGCGCTCCG
sgSZT2ATG-R aaacCGGAGCGCCCGGAGCCGGAGc
sgRRAGA-F caccgGGATGGCCTCCAGACACGAC
sgRRAGA-R aaacGTCGTGTCTGGAGGCCATCCc
sgRRAGB-F caccgTTGTCCTTAGGTGCTGTTGA
sgRRAGB-R aaacTCAACAGCACCTAAGGACAAc
sgWDR24-1F caccgCACGAACTGTTCCTCCTCGA
sgWDR24-1R aaacTCGAGGAGGAACAGTTCGTGc
sgWDR24-2F caccgCGTCCCGCACGCTCTCCGAC
sgWDR24-2R aaacGTCGGAGAGCGTGCGGGACGc
sgMIOS-1F caccgGAAAGGAACGGATGTAGACG
sgMIOS-1R aaacCGTCTACATCCGTTCCTTTCc
sgMIOS-2F caccgTTGAACTCCCTTGTACAAGA
sgMIOS-2R aaacTCTTGTACAAGGGAGTTCAAc
sgWDR59-1F caccgGCGATGGAGCAGCGAAAACG
sgWDR59-1R aaacCGTTTTCGCTGCTCCATCGCc
sgWDR59-2F caccgCCAGCCATGACGGCGATGTG
sgWDR59-2R aaacCACATCGCCGTCATGGCTGGc
sgWDR59-3F caccgACTTGTAAAGGTCTACTCGT
sgWDR59-3R aaacACGAGTAGACCTTTACAAGTc
sgSEH1L-1F caccgGAATCAAATGATAAACTGCG
sgSEH1L-1R aaacCGCAGTTTATCATTTGATTCc
sgSEH1L-2F caccgTTAGCAACCTGTTCCGCAGA
sgSEH1L-2R aaacTCTGCGGAACAGGTTGCTAAc
sgSEH1L-3F caccgATTGGCATTGTACTGCTAGC
sgSEH1L-3R aaacGCTAGCAGTACAATGCCAATc
sgGFP-F caccgGGGCGAGGAGCTGTTCACCG
sgGFP-R aaacCGGTGAACAGCTCCTCGCCCc
sgNPRL3-1F caccgCAGCCCCATCAGCGTGATTC
sgNPRL3-1R aaacGAATCACGCTGATGGGGCTGc
sgNPRL3-2F caccgCGCCACCGTGCTGCAGCACG
sgNPRL3-2R aaacCGTGCTGCAGCACGGTGGCGc
sgNPRL3-3F caccgACCTCAAGGAAGCTTATGAC
sgNPRL3-3R aaacGTCATAAGCTTCCTTGAGGTc
sgDEPDC5-1F caccgGACTTGACCTGCAAAAGCAG
sgDEPDC5-1R aaacCTGCTTTTGCAGGTCAAGTCc
sgDEPDC5-2F caccgTGTTAATGTCGTAGACCCTA
sgDEPDC5-2R aaacTAGGGTCTACGACATTAACAc
Cloning and Establishment of Stable Cell Lines
The cDNA of full length SZT2 was cloned from HEK293T cells. The cloned SZT2 encodes a 3432-amino acid protein similar to the predicted SZT2 protein isoform X3 (XP_006710564.1) in the NCBI database except that the amino acid 1938 in the cloned SZT2 is a threonine rather than isoleucine. This residue is a serine in mouse Szt2 protein, and the cloned SZT2 was able to rescue the mTORC1 signaling phenotype in SZT2-deficient cells, demonstrating that the cloned SZT2 is a functional protein. To establish SZT2 expressing stable cell lines, SZT2 was subcloned into the lentiviral vector pLJM1 at SalI and EcoRI sites with a FLAG tag fused to the N-terminus. Lentiviruses were produced in HEK293T cells, and used to infect target cells that were subsequently selected with puromycin. SZT2 was also cloned into pCMV-HA and pCMV-FLAG vectors for transient transfection experiments.
To generate Lyso-RFP/WDR59/WDR24/MIOS/Sestrin2, we modified the pLJM1 vector by insertion of the lysosomal targeting motif of p18/LAMTOR1 (MGCCYSSENEDSDQDREERKLLLDPSSPPTKALNGAEPN, cloned from pRK5-HA-p18) upstream of the SalI site. This lysosomal targeting sequence has been used to target TSC2 to lysosome28. The AgeI site upstream of SalI site was eliminated by site-directed mutagenesis, and a new AgeI site was included downstream of SalI site to facilitate the cloning of cDNAs. RFP and Sestrin2 were cloned into this modified pLJM1 vector (pLJM1-lyso-FLAG) with SalI and EcoRI, WDR59 and MIOS with SalI and AgeI, and WDR24 with SalI and EcoRV.
The following plasmids were obtained from Addgene: pLJM1-FLAG-Rap2A (#19311), pLJM1-FLAG-RagB-Q99L (#19315), pLJM1-FLAG-RagD-Q121L (#19318), pRK5-HA-GST-RagB-T54L (#19302), pRK5-HA-GST-RagD-S77L (#19308), PRK5-HA-MIOS (#46329), pRK5-HA-WDR59 (#46328), pRK5-HA-WDR24 (#46335), pLJM1-Flag-DEPDC5 (#46336). The integrity of all constructs and the presence of targeted mutations were verified by sequencing.
Antibodies
Antibodies against pS6K (T389) (#9205), S6K (#9202), pS6 (S240/244) (#2215), S6 (#2217), pAkt (T308) (#13038), pAkt (S473) (#4060), AKT (4691), p4E-BP1 (S65) (#9456), 4E-BP1 (#9644), RagA (#4357), RagB (#8150), RagC (#9480), Sestrin2 (#8487), MIOS (#13557), EEA1 (#3288, used for immunofluorescence (IF)), Lamp1 (#9091, used for IF) and Rab7 (#9367, used for IF) were purchased from Cell Signaling Technology. Lamp2 mouse monoclonal antibody (H4B4, for human cells) and Lamp2 rat-monoclonal antibody (GL2A7, for mouse cells) for IF were obtained from Abcam. Anti-FLAG (F1804, used for IF), anti-HA (3F10), and anti-PMP70 (SAB4200181, used for IF) were obtained from Sigma. WDR24 (20778-1-AP, used for IP) and Sestrin2 (10795-1-AP, used for IP) antibody was purchased from Proteintech. Antibodies against SZT2 (sc-242153), NPRL2 (sc-376986), SEC13 (sc-514308) and WDR59 (sc-137927, only used in immunoblotting of WDR59 in MEFs) were obtained from Santa Cruz. SEH1L (ab187307) antibody was form Abcam. The rabbit WDR59 monoclonal antibody used in IF experiments (1:100, validated in this study with knockout cells, Extended Data Fig. 5b) and immunoblotting experiments (1:1000) in HEK293T was kindly provided by Jianxin Xie from Cell Signaling Technology. This antibody only recognized WDR59 from human cells, but not MEFs. Anti-NPRL3 (NBP1-88447, used for IP) was obtained from Novus Biologicals.
Amino Acid, Glucose, and Serum Starvation and Re-stimulation
HEK293T, HEK293E, HeLa and MEFs were maintained in DMEM supplemented with 10% fetal bovine serum (FBS). Cells were plated in 12-well or 6-well plates one day before experiments. On the next day, cells were rinsed once with amino acid- and/or glucose-free DMEM, incubated with amino acid- and/or glucose-free DMEM supplemented with 10% dialyzed FBS (dFBS, Invitrogen) for the indicated time, and stimulated with amino acid and glucose-replete DMEM for 10 – 20 min. For serum starvation, cells were incubated with DMEM without FBS for 24 h. After the treatment, cells were lysed, and protein extracts were prepared for immunoblotting. Amino acids- and glucose-deficient DMEM medium were from the Media Core Facility of MSKCC, which had the same ingredients as DMEM from Invitrogen (Cat# 11965092) except amino acids or glucose were absent.
Cell Lysis and Immunoprecipitation
For protein extracts used in immunoblotting, cells were lysed in 1X Cell Lysis Buffer (CST) supplemented with one tablet of EDTA-free protease inhibitor (Roche) per 50 ml and one tablet of PhosSTOP (Roche) per 10 ml. For protein extracts used in immunoprecipitation experiments, cells were lysed with the CHAPS or Triton X-100 lysis buffer (40 mM HEPES [pH 7.4], 0.3% CHAPS or 1% Triton X-100, 10 mM β-glycerol phosphate, 10 mM pyrophosphate and 2.5 mM MgCl2) supplemented with the EDTA-free protease inhibitor and PhosSTOP. The soluble fractions of cell lysates were isolated by centrifugation at 14,000 rpm for 6 min. The anti-FLAG or anti-HA beads (Sigma) were washed 3 times with the lysis buffer. 20 μl of 50% slurry of the beads was added and incubated with the lysates for 1 – 3 h at 4 °C. The beads were washed 3 times with the lysis buffer containing 150 mM NaCl. For immunoprecipitation of endogenous protein complexes with antibodies (described above), the antibodies (2 μl per sample) were incubated with lysate for 2 h at 4 °C, and 30 μl of 50% slurry of pre-cleared protein-G beads was added and incubated for another hour at 4 °C. The beads were washed 3 times with the lysis buffer containing 500 mM NaCl, and once with lysis buffer containing 150 mM NaCl. Immunoprecipitated proteins were denatured by the addition of 30 – 60 μl of sample buffer and boiling for 5 min, resolved by SDS-PAGE, and analyzed by immunoblotting.
To detect the interaction between GATOR1 and GATOR2 in total cell lysate, DSP crosslinker was used to enhance the sensitivity of the assay. Cells were rinsed once with PBS before subject to crosslinking with DSP. 20 mg DSP was dissolved in 1 ml DMSO to a final concentration of 50 mM (100× stock solution), and then diluted into 100 ml of PBS with 1 mM MgCl2 and 0.1mM CaCl2. Cells were incubated with the 1X crossing linking DSP solution for 20 min at room temperature. After incubation, cells were rinsed once with PBS, and incubated with 20 mM Tris/PBS for 5 min to quench the excessive DSP. Subsequently, cells were rinsed twice with PBS and lysed with 1% Triton X-100 lysis. Anti-FLAG M2 immunoprecipitation was performed as described above.
Immunofluorescence
HEK293T, HeLa, and MEFs were plated on Poly-D-Lysine Cellware 12-mm Coverslips (BD Biosciences). On the next day, cells were either amino acid-starved, or starved and followed by amino acid re-stimulation. At the end of treatment, cells were rinsed once with PBS, and fixed for 15 min with 4% paraformaldehyde in PBS at room temperature, and all following steps were also carried out at room temperature. The slides were rinsed twice with PBS, and the cells were permeabilized with 0.1% Triton X-100 in PBS for 5 min. After rinsing twice with PBS, the slides were incubated with primary antibodies in 5% normal donkey serum for 1 – 3 h at room temperature, rinsed four times with PBS, and incubated with secondary antibodies produced in donkey (diluted 1:1000 in 5% normal donkey serum) for 1 h at room temperature in the dark. Slides were washed four times with PBS, mounted on glass coverslips using ProLong Gold (Invitrogen), and imaged on a Leica-Upright Point-scanning confocal microscope with a 63× oil lens. For each sample, at least 10 different fields were scanned. Quantification were from 100 ~ 150 cells per sample.
Due to the low abundance of SZT2 protein, the signal of anti-FLAG staining in SZT2FLAG/− cells was undetectable with conventional immunofluorescence staining protocol described above (data not shown), we instead used the Tyramide SuperBoost Kit (Invitrogen, B40941) to amplify the signal. Briefly, cells were grown and treated as described above. After fixation and permealization, cells were incubated with 3% hydrogen peroxide solution for 1 h to quench the endogenous HRP activity. Cells were then block with 10% goat serum for 1 h, and incubated with anti-FLAG M2 antibody (Sigma, F1804, 1:200 dilution) for 2 h. Cells were washed 3 times (10 min each) with PBS (2 ml per wash), and incubated with poly-HRP-conjugated goat-anti-mouse secondary antibody for 1 h. Cells were washed with PBS and incubated with tyramide working solution for 3 min to label target protein. Then cells were counterstained with other proteins with standard protocol described above.
In Extended Data Fig. 5c, 5d, 5e, anti-FLAG and anti-Lamp2, as well as anti-FALG and anti-PMP70, were all mouse monoclonal antibodies. The colocalization between FLAG-SZT2 and Lamp2 was not due to signal from mouse anti-FLAG staining (which was labeled first), because 1) the anti-FLAG staining in HEK293T-SZT2FLAG/− cells was undetectable with conventional immunofluorescence staining protocol, 2) PMP70 (mouse antibody) did not colocalize with FLAG-SZT2 (mouse antibody), and 3) the localization of FLAG-SZT2 on lysosome was confirmed with rabbit anti-Lamp1 staining (Fig. 3 and Extended Data Fig. 5a).
Size-Exclusion Chromatography (SEC)
Near-confluent cells grown in 15-cm dishes were collected by scratching, washed once with ice-cold PBS, and lysed with 4 packed cell volume (PCV) of 1% Triton X-100 lysis buffer (1% Triton X-100, 50 mM Hepes [pH = 7.4], 150 mM NaCl, 2.5 mM MgCl2, 10% glycerol and 1X EDTA-free protease inhibitor cocktail) on ice for 10 min. Lysates were spun at 20, 000 g for 20 min at 4 °C, and supernatants were filtered through a 0.22 μM Spin-X Centrifuge Tube Filter (Costar, 8160). 300 μl (3 mg) cleared supernatants were loaded on a Superose 6 Increase 10/300 GL Column (GE Healthcare, 29-0915-96) connected to a AKTA purifier (GE Healthcare), which was pre-equilibrated with 2 bed volume (48 ml) of column buffer (50 mM Hepes [pH = 7.4], 150 mM NaCl). The flow rate was 0.5 ml/min, and 0.5 ml fractions were collected. The column was calibrated with a High Molecular Weight Gel Filtration Calibration Kit (GE Healthcare, 28-4038-42) that contains: Blue Dextran 2000 (to determine void volume), Ovalbumin (44 KDa), Conalbumin (75 KDa), Aldolase (158 KDa), Ferritin (440 KDa) and Thyroglobulin (669 KDa). Rat IgM (970 KDa, Jackson Immunoresearch, 009-00-012) was also included. The Kav value was calculated as: (elution volume – void volume)/(column volume – void volume). Ovalbumin (44 KDa) was not linear with other standard proteins on this column with our protocol and therefore was not included for calibration (Extended Data Fig. 2f). Cleaning-in-place of column was performed after every 10 runs with 1 bed volume of 0.5 M sodium hydroxide, and the column was recalibrated after cleaning.
For immunoprecipitation with pooled fractions, every 4 fractions were pooled (from fraction #13). For each pool, protease inhibitor mixture was added to 1X, Triton X-100 was added to a final concentration of 1%. 2 μl of anti-WDR24 (Proteintech, 20778-1-AP) antibody were added and incubated for 2 h with rotation, then 20 μl (packed volume) of protein G beads were added for another 1 h. Beads were washed 3 times with lysis buffer containing 500 mM NaCl, once with lysis buffer with 150 mM NaCl, and boiled with 50 μl of 1 X SDS sampling buffer for 5 min at 95 °C. Samples were subject to SDS-PAGE and immunoblotting analysis.
Sucrose Density Gradient Centrifugation
Near-confluent cells grown in 15-cm dishes were collected by scratching, washed once with ice-cold PBS, and resuspended in 1 ml of homogenization buffer (10 mM Hepes [pH 7.4], 0.25 M/9% sucrose and 1X EDTA-free protease inhibitor) and incubated on ice for 10 min. Cells were broken by 20 strokes of Dounce Tissue Grinder with type-B pestle (KIMBLE, K885300-0002), and MgCl2 and KCl were added at a final concentration of 1 mM and 100 mM, respectively. Unbroken cells were removed by centrifugation at 1, 000 g for 10 min at 4 °C, and the supernatant (1 ml) was layered on the top of a 9 ml sucrose density gradient of 0.4 M/13% − 2.25 M/60% buffered in 10 mM HEPES [pH 7.4], which was poured using a gradient maker. The gradient was centrifuged at 100,000 g for 4.5 h at 4 °C with an SW41 rotor using Optima L-100 XP Ultracentrifuge (Beckman Coulter). Fractions were manually collected in 0.4 ml aliquots from the top of the gradient and subject to SDS-PAGE and immunoblotting analysis.
Purification of SOG Complex
HEK293T-SZT2FLAG/− cells were adapted to suspension growth in Freestyle 293 Expression Medium (Gibico, 12-338-026) in 2.8 L flasks on an orbital shaker (120 rpm) placed in a humidified incubator with 8% CO2. All following steps were either on ice or at 4 °C, and all buffers were pre-chilled on ice. About 20 billion cells from 6 L suspension culture were collected, washed once with ice-cold PBS, and lysed with 5 packed cell volume (PCV) of 1% Triton X-100 lysis buffer (1% Triton X-100, 50 mM Hepes [pH = 7.4], 150 mM NaCl, 2.5 mM MgCl2, 10% glycerol and 1X EDTA-free protease inhibitor cocktail) on ice for 10 min. Lysate was spun at 20,000 g for 10 min, the supernatant was further spun at 100,000 g for 1 h. The supernatant (S100) was filtered through 0.45 μM membrane and incubated with 100 μl (packed volume) of anti-FLAG M2 beads for 1 h with gentle rotation. The beads were washed 3 times with wash buffer (0.1% Triton X-100, 50 mM Hepes [pH = 7.4], 150 mM NaCl, 2.5 mM MgCl2, 10% glycerol) containing 2.5 mM ATP, then once with wash buffer. Bound proteins were elute with wash buffer containing 0.5 mg/ml FLAG peptide (Sigma, F3290) for 30 min with gentle rotation. Elute was filter through a 0.22 μM spin filter and directly loaded on the Superose 6 Increase 10/300 GL column for SEC, peak fractions containing SZT2 were pooled and concentrated to 50 μl with a centrifugal filter with 50 KDa cut-off (Millipore, UCF205024). Then 25 μl 3 X SDS sampling buffer were added to the sample and boiled for 5 min at 95 °C, of which 60 μl was used for SDS-PAGE and silver staining with a SilverQuest Silver Staining Kit (Invitrogen, LC6070), and the rest were subject to immunoblotting analysis of SOG components.
Recombinant Proteins Expression, Purification and Amino Acid Binding Assay
Six million HEK293T cells or HEK293T-sgSZT2 cells were plated in a 15 cm plate 24 hours before transfection. 20 μg of pCMV-FLAG-SZT2, pCDNA3.1-FLAG-RFP, or pCDNA3.1-FLAG-Sestrin2 were transfected using Lipofectamine 2000 (Invitrogen). Forty-eight hours after transfection, cells were lysed with 1% Triton X-100 lysis buffer (40 mM HEPES [pH 7.4], 1% Trinton X-100, 10 mM β-glycerol phosphate, 10 mM pyrophosphate and 2.5 mM MgCl2) supplemented with EDTA-free protease inhibitor and PhosSTOP. 50 μl of 50% slurry of anti-FLAG M2 beads was added to the cleared lysates and incubated for 3 h at 4 °C with rotation. The beads were washed 3 times with the lysis buffer containing 500 mM NaCl, and once with binding buffer (0.1% Triton, 40 mM HEPES [pH 7.4], 10 mM NaCl, 150 mM KCl, 2.5 mM MgCl2). The beads were equally split into 7 aliquots (50 μl of each) for experiments. One aliquot was eluted with 50 μl of 100 mM glycine [pH 2.5] to check the purity of immunoprecipitates. The other 6 aliquots of beads were incubated with 2 μl (2 μCi) of 3H-labelled leucine, arginine or glutamine on ice for 1 hour in the presence or absence of 10 mM non-labeled leucine, arginine or glutamine respectively. Tubes were flicked every five minutes. After incubation, the beads were spun down (3, 000 g × 1 min), and washed 3 times with wash buffer (0.1% Triton, 40mM HEPES [pH 7.4], 150 mM NaCl). The beads were then resuspended in 900 μl wash buffer and equally split into 3 separate scintillation tubes for quantification by a TriCarb scintillation counter (PerkinElmer).
Mass Spectrometry Analyses
HEK293T cells stably expressing FLAG-tagged Rap2A or SZT2 were lysed, and anti-FLAG immunoprecipitations were performed as described above. Proteins were eluted by 50 mM glycine (pH=2.5), resolved on 4 – 20% SDS-PAGE and stained by Brilliant Blue G250 (Sigma). In-gel trypsin digestion and mass spectrometry analysis were done by the Microbiochemistry and Proteomics Core at MSKCC.
RT-PCR and qPCR
Total RNA was extracted with RNeasy kit (QIAGEN), and reverse transcribed with Superscript III (Invitrogen). mRNA levels were normalized to β-Actin. The primers used were: Actb-F: GGCACCACACCTTCTACAATG; Actb-R: GTGGTGGTGAAGCTGTAGCC; Wdr59-F: GAAGTGCTGAAGTTTGTGTCC; Wdr59-R: AGGTGAAGCCTTTGCAGATG; Szt2-1F: TGACAATGGAAGGTGGCTATG; Szt2-1R: CCGTCTGGTTAATGCTCTGTAG; Szt2-2F: CAGATGAGTTAGTGCGGGTTC; Szt2-2R: AAGGTGAGTAAGTTCTGGCG; ACTB-F: ACCTTCTACAATGAGCTGCG; ACTB-R: CCTGGATAGCAACGTACATGG; DEPDC5-F: TGCACCAGTATGAAGTCAGC; DEPDC5-R: GTTACTTGGGAGGCAGAGG.
Statistical Analysis
Statistical tests were performed with Prism (GraphPad). A value of p < 0.05 were considered statistically significant. All error bars represent standard error (SD).
Extended Data
Extended Data Figure 1. SZT2 is essential for mTORC1 inactivation upon nutrient deprivation.
a, b, Control, SZT2-deficient HeLa cells (a) or HEK293T (b) cells were deprived of amino acids and/or glucose for 1 h and stimulated with amino acids and/or glucose for 10 min when indicated. Total cell lysates were analyzed by immunoblotting. c, The size of control and SZT2-deficient HEK293E cells were determined by flow cytometry. d, HEK293T cells stably overexpressing FLAG-Rap2A or FLAG-SZT2 cells were analyzed as in (a). e, Control or SZT2-deficient HeLa cells were deprived of amino acids for 1 h and stimulated with amino acids for 10 min when indicated. The localization of mTOR and Lamp2 was determined by immunostaining. f, Quantification of the colocalization between mTOR and Lamp2. Data represent mean ± SD. 100 cells were analyzed from each condition with two-tailed unpaired t-test. ns, not significant. g, Control or SZT2-deficient HEK293T cells were transfected with the indicated constructs and selected with puromycin. Cells were deprived of amino acids for 1 h, and stimulated with amino acids for 10 min when indicated. Total cell lysates were analyzed by immunoblotting. Data (a – e, g) are representatives of three independent experiments.
Extended Data Figure 2. SZT2 forms a complex with GATOR.
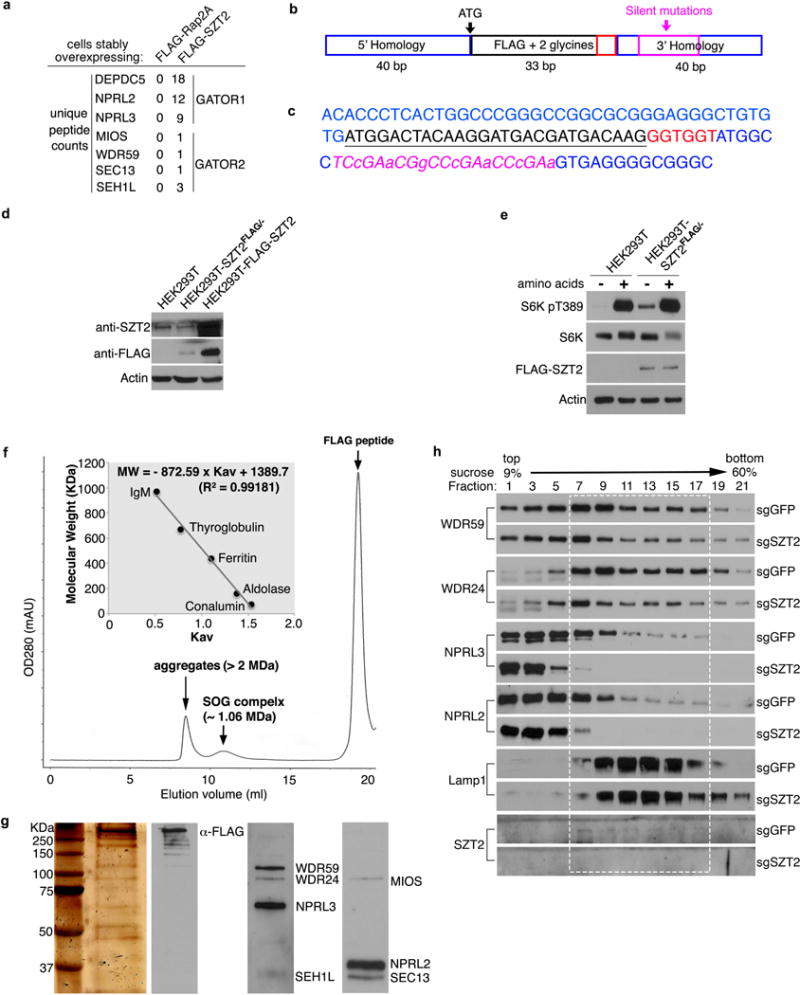
a, Mass spectrometry analysis of SZT2-interacting proteins in HEK293T cells stably overexpressing FLAG-Rap2A or FLAG-SZT2. Specific recovery of the GATOR complex components is shown. b, c, A diagram of the template (b) and sequence (c) used to introduce a FLAG tag into the SZT2 locus. d, Total cell lysates from HEK293T cells, HEK293T cells stably expressing FLAG-SZT2, or SZT2FLAG/− cells were analyzed by immunoblotting. e, Control or SZT2FLAG/− cells were deprived of amino acids for 1 h and stimulated with amino acids for 10 min when indicated. Total cell lysates were analyzed by immunoblotting. f, Size-exclusion chromatography of the SZT2-Orchestrated GATOR (SOG) complex purified from SZT2FLAG/− cells on a Superose 6 Increase 10/300 GL column. The insert shows the calibration of the column, and the equation used for calculating the size of SOG. g, Peak fraction of SOG from (f) was analyzed by silver staining and immunoblotting. h, Sucrose density gradient centrifugation analysis of the sedimentation pattern of GATOR components from control or SZT2-deficient HEK293T cells. Dashed box indicates fractions containing Lamp1, SZT2, WDR59, WDR24, NPRL3 and NPRL2. Data (a, d – h) are representatives of three independent experiments.
Extended Data Figure 3. The integrity of SOG is not regulated by amino acids or Sestrin2.
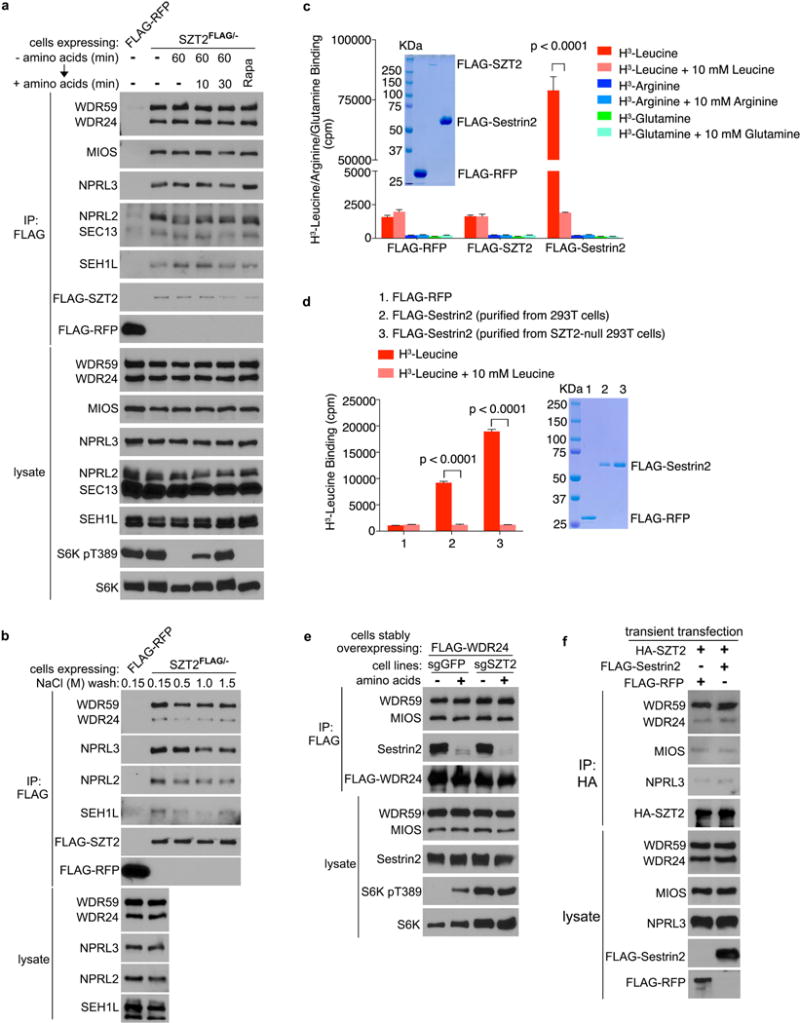
a, SZT2FLAG/− cells were either untreated, deprived of amino acids for 60 min, deprived of amino acids for 60 min and stimulated with amino acids for 10 or 30 min, or treated with rapamycin for 60 min. Anti-FLAG immunoprecipitates and total cell lysates were analyzed by immunoblotting. HEK293T cells stably overexpressing FLAG-RFP were used as a control. b, Anti-FLAG immunoprecipitates prepared from SZT2FLAG/− cells were washed 3 times with buffer containing sodium chloride, and analyzed by immunoblotting. HEK293T cells stably overexpressing FLAG-RFP were used as a control. c, The leucine/arginine/glutamine-binding activity of FLAG-RFP/SZT2/Sestrin2 was determined. Data represent mean ± SD (n=3, two-tailed unpaired t-test). d, The leucine-binding activity of FLAG-Sestrin2 expressed and purified from control or SZT2-deficient HEK293T cells. Data represent mean ± SD (n=3, two-tailed unpaired t-test). e, Control or SZT2-deficient HEK293T cells stably overexpressing FLAG-WDR24 were deprived of amino acids for 1 h and stimulated with amino acids for 10 min when indicated. Anti-FLAG immunoprecipitates and total cell lysates were analyzed by immunoblotting. f, HEK293T cells were transfected with the indicated constructs. Anti-HA immunoprecipitates and total cell lysates were analyzed by immunoblotting. HA, haemagglutinin. Data (a, b, e, f) are representatives of two independent experiments.
Extended Data Figure 4. An integral SOG complex is essential for mTORC1 regulation.
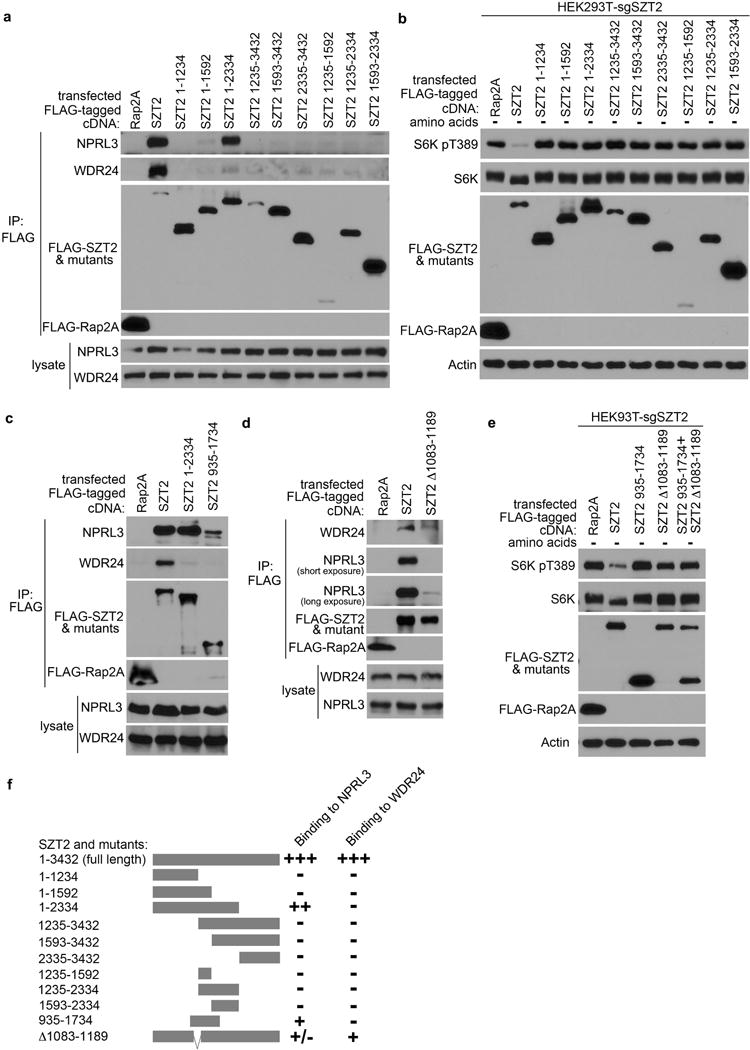
a, HEK293T cells were transfected with the indicated constructs. Anti-FLAG immunoprecipitates and total cell lysates were analyzed by immunoblotting. b, SZT2-deficient HEK293T cells were transfected with the indicated constructs, selected with puromycin, and deprived of amino acids for 1 h. Total cell lysates were analyzed by immunoblotting. c, d, HEK293T cells were transfected with the indicated constructs. Anti-FLAG immunoprecipitates and total cell lysates were analyzed by immunoblotting. e, SZT2-deficient HEK293T cells were transfected with the indicated constructs, selected with puromycin, and deprived of amino acids for 1 h. Total cell lysates were analyzed by immunoblotting. Data (a – e) are representatives of three independent experiments. f, A diagram of SZT2 protein and its truncation mutants, and a summary of their NPRL3 and WDR24 binding capacity.
Extended Data Figure 5. SZT2 is localized on the lysosome, which together with GATOR1 controls lysosomal localization of WDR59.

a, HEK293T or SZT2FLAG/− cells were immunostained with anti-FLAG together with anti-Lamp1. b, Control or WDR59-deficient HEK293T cells were immunostained with anti-WDR59 together with anti-Lamp2. c – e, SZT2FLAG/− cells were deprived of amino acids for 1 h and stimulated with amino acids for 20 min when indicated. Cells were immunostained with anti-FALG (c – e), together with anti-Lamp2 plus anti-WDR59 (c), or anti-Lamp2 plus anti-EEA1 (d), or anti-Rab7 plus anti-PMP70 (e). f, Quantification of the co-localization among SZT2, PMP70, EEA1, Rab7, Lamp2 and WDR59. Data represent mean ± SD with 100 cells analyzed under each condition. g, DEPDC5-deficient HEK293T cells were deprived of amino acids for 1 h and stimulated with amino acids for 20 min when indicated. The localization of WDR59 and Lamp2 was determined by immunostaining. h, Control, SZT2-deficient, DEPDC5-deficient, and NPRL3-deficient cells were deprived of amino acids for 1 h and stimulated with amino acids for 20 min when indicated. Total cell lysates were analyzed by immunoblotting. i, mRNA levels of DEPDC5 in control and DEPDC5-deficient HEK293T cells were measured by qPCR and normalized to that of β-actin. AU, arbitrary unit. j, Control or SZT2-deficient HEK293T were treated with rapamycin (100 nM), deprived of amino acids for 1 h and stimulated with amino acids for 20 min when indicated. The localization of WDR59 and Lamp2 was determined by immunostaining. Data (a, b, g – j) are representatives of three independent experiments.
Extended Data Figure 6. The roles of GATOR2 components in SZT2 regulation of mTORC1 signaling.
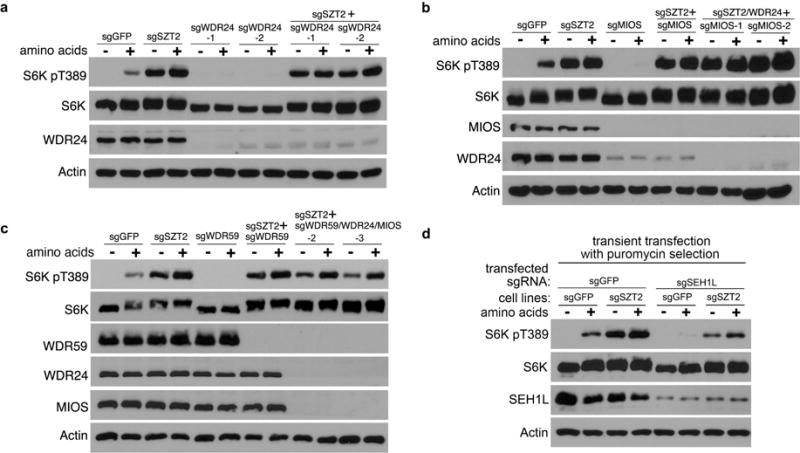
a – c, Cells were deprived of amino acids for 1 h and stimulated with amino acids for 10 min when indicated. Total cell lysates were analyzed by immunoblotting. d, Control or SZT2-deficient cells were transfected with LentiCrisprV2 plasmids targeting GFP or SEH1L, selected with puromycin, and analyzed as in (a). Data (a – d) are representatives of three independent experiments.
Extended Data Figure 7. Lysosome-targeted WDR59 suppresses mTORC1 signaling in SZT2-deficient cells.
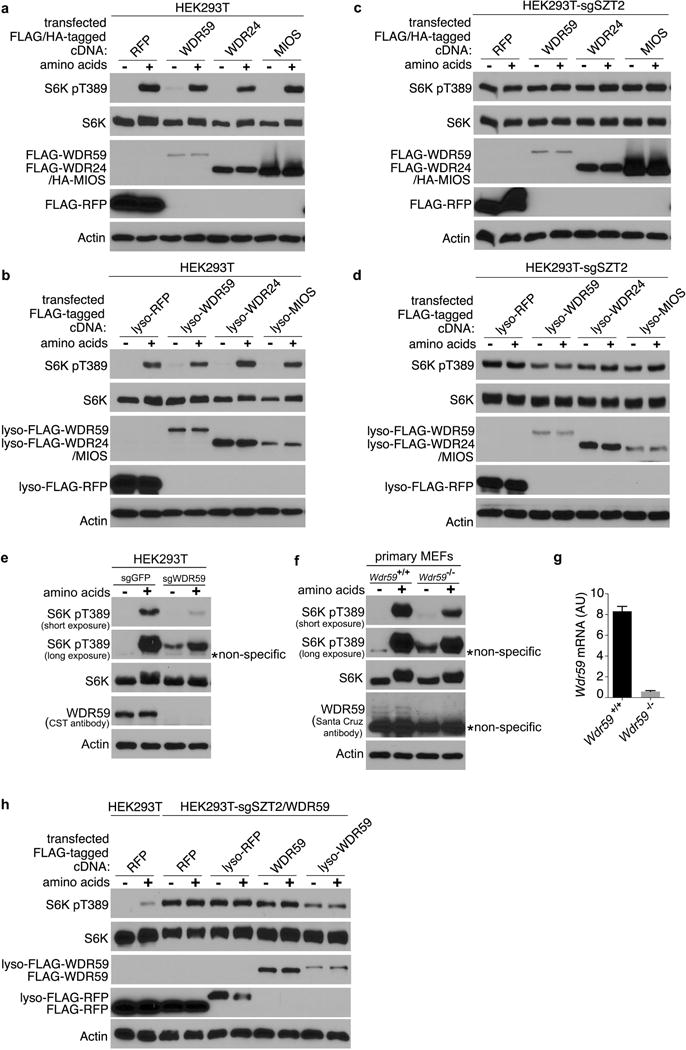
a – d, h, Control (a, b), SZT2-deficient (c, d), or SZT2/WDR59-deficient (h) HEK293T cells were transfected with the indicated constructs, and selected with puromycin. These cells were deprived of amino acids for 1 h and stimulated with amino acids for 20 min when indicated. Total cell lysates were analyzed by immunoblotting. e, Control or WDR59-deficient HEK293T cells were analyzed as in (a). f, Primary Wdr59+/+ or Wdr59−/− MEFs were analyzed as in (a). g, mRNA levels of Wdr59 in Wdr59+/+ and Wdr59−/− MEFs were measured by qPCR and normalized to that of β-actin. AU, arbitrary unites. HA, haemagglutinin. Data (a – h) are representatives of three independent experiments.
Extended Data Figure 8. Lysosome-targeted WDR59 or Sestrin2 suppresses mTORC1 signaling in GATOR1-deficient cells.
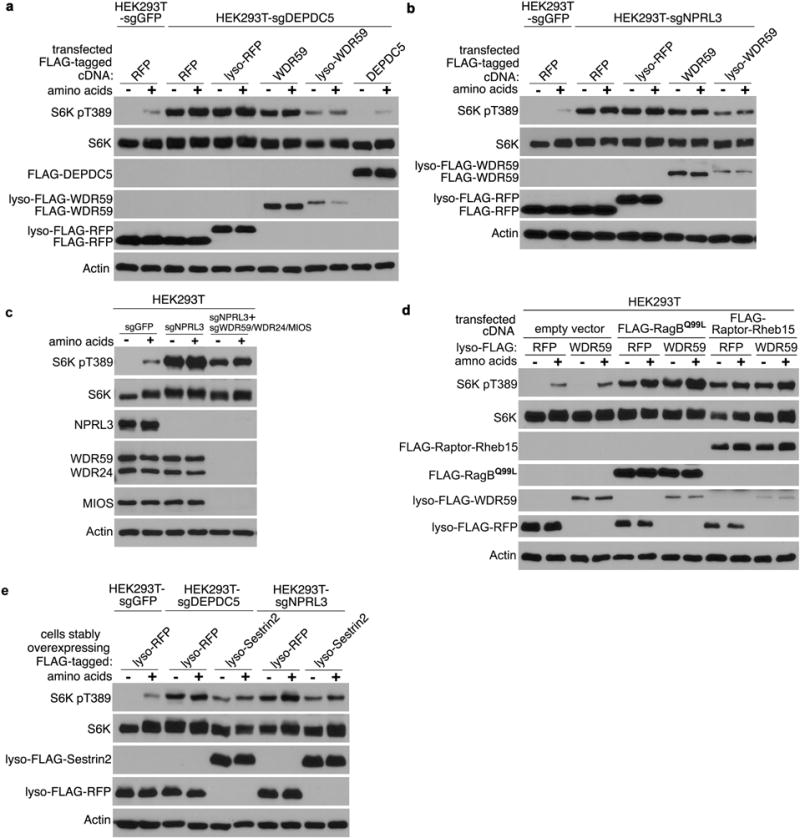
a, b and d, Cells were transfected with the indicated constructs, and selected with puromycin. Cells were deprived of amino acids for 1 h and stimulated with amino acids for 20 min when indicated. Total cell lysates were analyzed by immunoblotting. c and e, Cells were deprived of amino acids for 1 h and stimulated with amino acids for 20 min when indicated. Total cell lysates were analyzed by immunoblotting. Data (a – e) are representatives of three independent experiments.
Extended Data Figure 9. Szt2 is essential for mTORC1 inactivation under nutrient deprivation conditions in mice and MEFs.
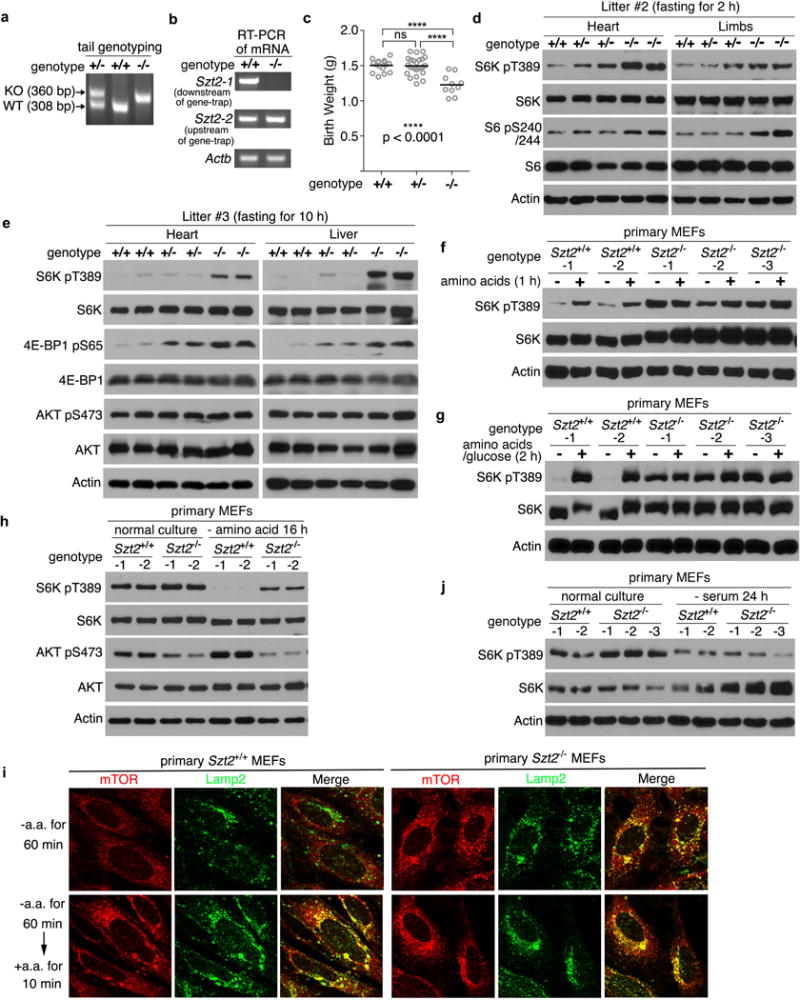
a, PCR genotyping of Szt2+/+, Szt2+/−, and Szt2−/− mice. The expected sizes of wild-type (WT) or Szt2 mutant (KO) alleles are indicated by arrows. b, RT-PCR analysis of mRNA of Szt2 in Szt2+/+ and Szt2−/− MEFs. Primer pair 1 (Szt2-1) detects a region downstream of the gene-trap, and primer pair 2 (Szt2-2) detects a region upstream of the gene-trap. c, The birth weight of neonates from the indicated genotypes are shown. Data represent mean ± SD, n =10 ~ 25, two-tailed unpaired t-test. ns, not significant. d, e, Neonates were fasted for 2 h (d) or 10 h (e). Total cell lysates prepared from the indicated organs were analyzed by immunoblotting. f, g, Szt2+/+ and Szt2−/− MEFs (< 4 passages) were deprived of amino acids for 1 h (f), or amino acid plus glucose for 2h (g) and stimulated with amino acids (f), or amino acid plus glucose (g) for 10 min when indicated. Total cell lysates were analyzed by immunoblotting. h, Szt2+/+ and Szt2−/− MEFs (< 4 passages) were cultured in complete medium or starved with amino acids for 16 h and analyzed as in (f). i, Szt2+/+ and Szt2−/− MEFs (< 4 passages) were deprived of amino acids for 1 h and stimulated with amino acids for 10 min when indicated. The localization of mTOR and Lamp2 was determined by immunostaining. j, Szt2+/+ and Szt2−/− MEFs (< 4 passages) were cultured in complete medium or serum-starved for 24 h and analyzed as in (f). Data (f – j) are representatives of two independent experiments.
Extended Data Figure 10. SZT2-GATOR-Sestrin2 in nutrient sensing and mTORC1 signaling.
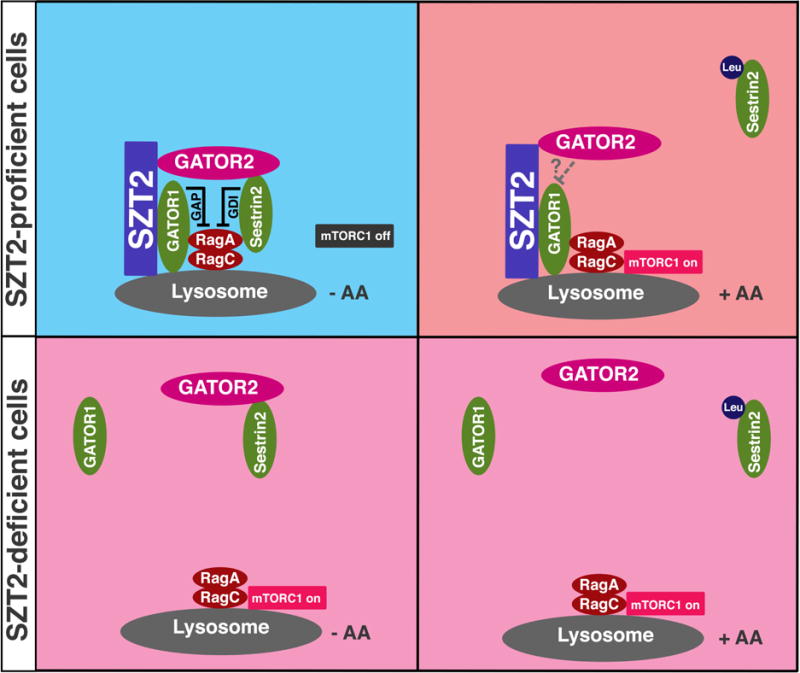
We propose that the SZT2-Orchestrated GATOR (SOG) complex sets a platform for nutrient sensing and mTORC1 regulation in metazoans. In this model, GATOR1 not only functions as a GAP that inactivates RagA and RagB (not depicted), but also recruits GATOR2 to the lysosome via SZT2. Under nutrient deprivation conditions, Sestrin2 is further recruited to the lysosome, and represses RagA/B through its GDI activity. Upon nutrient stimulation, the GAP activity of GATOR1 may be repressed by GATOR2 via unknown mechanisms, while the leucine-bound Sestrin2 dissociates from GATOR2. In line with the general mode of GDI regulation, leucine could be considered as a GDI-dissociation factor (GDF) for Sestrin2. In SZT2-deficient cells, GATOR1, GATOR2 and likely Sestrin2 dissociate from the lysosome resulting in constitutive RagA/B activation and mTORC1 signaling, but the leucine-regulated Sestrin2 interaction with GATOR2 is not affected. AA, amino acids; Leu, leucine.
Supplementary Material
Acknowledgments
We thank Dr. Hediye Erdjument-Bromage at the Microchemistry and Proteomics Core for help with the mass spectrometry experiments, and Jianxin Xie for WDR59 antibody. This work was supported by a Leukemia & Lymphoma Society Scholar Award (M.O.L.), a Functional Genomics Initiative Grant from Memorial Sloan Kettering Cancer Center (M.O.L), a Faculty Scholar grant from the Howard Hughes Medical Institute (M.O.L.), and the Memorial Sloan Kettering Cancer Center Support Grant/Core Grant (P30 CA008748).
Footnotes
Competing Financial Interests
The authors declare no competing financial interests.
Author Contributions
M.P. and M.O.L. conceived the project. M.P. designed and performed most experiments with input from M.O.L. N.Y. performed experiments. M.P. and M.O.L. analyzed the data. M.P. wrote and M.O.L. edited the manuscript.
Data Availability Statement
We’ll make materials, data, code, and associated protocols promptly available to readers without undue qualifications.
References
- 1.Laplante M, Sabatini DM. mTOR signaling in growth control and disease. Cell. 2012;149:274–293. doi: 10.1016/j.cell.2012.03.017. [DOI] [PMC free article] [PubMed] [Google Scholar]
- 2.Jewell JL, Guan KL. Nutrient signaling to mTOR and cell growth. Trends Biochem Sci. 2013;38:233–242. doi: 10.1016/j.tibs.2013.01.004. [DOI] [PMC free article] [PubMed] [Google Scholar]
- 3.Shimobayashi M, Hall MN. Making new contacts: the mTOR network in metabolism and signalling crosstalk. Nat Rev Mol Cell Biol. 2014;15:155–162. doi: 10.1038/nrm3757. [DOI] [PubMed] [Google Scholar]
- 4.Kim SG, Buel GR, Blenis J. Nutrient regulation of the mTOR complex 1 signaling pathway. Mol Cells. 2013;35:463–473. doi: 10.1007/s10059-013-0138-2. [DOI] [PMC free article] [PubMed] [Google Scholar]
- 5.Bar-Peled L, et al. A Tumor Suppressor Complex with GAP Activity for the Rag GTPases That Signal Amino Acid Sufficiency to mTORC1. Science. 2013;340:1100–1106. doi: 10.1126/science.1232044. [DOI] [PMC free article] [PubMed] [Google Scholar]
- 6.Panchaud N, Peli-Gulli MP, De Virgilio C. Amino Acid Deprivation Inhibits TORC1 Through a GTPase-Activating Protein Complex for the Rag Family GTPase Gtr1. Science Signaling. 2013;6:ra42. doi: 10.1126/scisignal.2004112. [DOI] [PubMed] [Google Scholar]
- 7.Peng M, Yin N, Li MO. Sestrins Function as Guanine Nucleotide Dissociation Inhibitors for Rag GTPases to Control mTORC1 Signaling. Cell. 2014;159:122–133. doi: 10.1016/j.cell.2014.08.038. [DOI] [PMC free article] [PubMed] [Google Scholar]
- 8.Chantranupong L, et al. The Sestrins interact with GATOR2 to negatively regulate the amino-acid-sensing pathway upstream of mTORC1. Cell Rep. 2014;9:1–8. doi: 10.1016/j.celrep.2014.09.014. [DOI] [PMC free article] [PubMed] [Google Scholar]
- 9.Parmigiani A, et al. Sestrins inhibit mTORC1 kinase activation through the GATOR complex. Cell Rep. 2014;9:1281–1291. doi: 10.1016/j.celrep.2014.10.019. [DOI] [PMC free article] [PubMed] [Google Scholar]
- 10.Frankel WN, Yang Y, Mahaffey CL, Beyer BJ, O’Brien TP. Szt2, a novel gene for seizure threshold in mice. Genes Brain Behav. 2009;8:568–576. doi: 10.1111/j.1601-183X.2009.00509.x. [DOI] [PMC free article] [PubMed] [Google Scholar]
- 11.Falcone M, et al. An amino acid deletion inSZT2 in a family with non-syndromic intellectual disability. PLoS One. 2013;8:e82810. doi: 10.1371/journal.pone.0082810. [DOI] [PMC free article] [PubMed] [Google Scholar]
- 12.Basel-Vanagaite L, et al. Biallelic SZT2 mutations cause infantile encephalopathy with epilepsy and dysmorphic corpus callosum. Am J Hum Genet. 2013;93:524–529. doi: 10.1016/j.ajhg.2013.07.005. [DOI] [PMC free article] [PubMed] [Google Scholar]
- 13.Venkatesan C, Angle B, Millichap JJ. Early-life epileptic encephalopathy secondary to SZT2 pathogenic recessive variants. Epileptic Disorders. 2016;18:195–200. doi: 10.1684/epd.2016.0828. [DOI] [PubMed] [Google Scholar]
- 14.Saito K, Araki Y, Kontani K, Nishina H, Katada T. Novel role of the small GTPase Rheb: its implication in endocytic pathway independent of the activation of mammalian target of rapamycin. J Biochem. 2005;137:423–430. doi: 10.1093/jb/mvi046. [DOI] [PubMed] [Google Scholar]
- 15.Sancak Y, et al. Ragulator-Rag complex targets mTORC1 to the lysosomal surface and is necessary for its activation by amino acids. Cell. 2010;141:290–303. doi: 10.1016/j.cell.2010.02.024. [DOI] [PMC free article] [PubMed] [Google Scholar]
- 16.Betz C, Hall MN. Where is mTOR and what is it doing there? Journal of Cell Biology. 2013;203:563–574. doi: 10.1083/jcb.201306041. [DOI] [PMC free article] [PubMed] [Google Scholar]
- 17.Sekiguchi T, Hirose E, Nakashima N, Ii M, Nishimoto T. Novel G proteins, Rag C and Rag D, interact with GTP-binding proteins, Rag A and Rag B. J Biol Chem. 2001;276:7246–7257. doi: 10.1074/jbc.M004389200. [DOI] [PubMed] [Google Scholar]
- 18.Sancak Y, et al. The Rag GTPases bind raptor and mediate amino acid signaling to mTORC1. Science. 2008;320:1496–1501. doi: 10.1126/science.1157535. [DOI] [PMC free article] [PubMed] [Google Scholar]
- 19.Kim E, Goraksha-Hicks P, Li L, Neufeld TP, Guan KL. Regulation of TORC1 by Rag GTPases in nutrient response. Nat Cell Biol. 2008;10:935–945. doi: 10.1038/ncb1753. [DOI] [PMC free article] [PubMed] [Google Scholar]
- 20.Wolfson RL, et al. METABOLISM Sestrin2 is a leucine sensor for the mTORC1 pathway. Science. 2016;351:43–48. doi: 10.1126/science.aab2674. [DOI] [PMC free article] [PubMed] [Google Scholar]
- 21.Panchaud N, Peli-Gulli MP, De Virgilio C. SEACing the GAP that nEGOCiates TORC1 activation Evolutionary conservation of Rag GTPase regulation. Cell Cycle. 2013;12:2948–2952. doi: 10.4161/cc.26000. [DOI] [PMC free article] [PubMed] [Google Scholar]
- 22.Algret R, et al. Molecular architecture and function of the SEA complex, a modulator of the TORC1 pathway. Mol Cell Proteomics. 2014;13:2855–2870. doi: 10.1074/mcp.M114.039388. [DOI] [PMC free article] [PubMed] [Google Scholar]
- 23.Dokudovskaya S, Rout MP. SEA you later alli-GATOR - a dynamic regulator of the TORC1 stress response pathway. J Cell Sci. 2015;128:2219–28. doi: 10.1242/jcs.168922. [DOI] [PMC free article] [PubMed] [Google Scholar]
- 24.Dokudovskaya S, et al. A conserved coatomer-related complex containing Sec13 and Seh1 dynamically associates with the vacuole in Saccharomyces cerevisiae. Mol Cell Proteomics. 2011;10006478:M110. doi: 10.1074/mcp.M110.006478. [DOI] [PMC free article] [PubMed] [Google Scholar]
- 25.Wong M. A critical review of mTOR inhibitors and epilepsy: from basic science to clinical trials. Expert Rev Neurother. 2013;13:657–669. doi: 10.1586/ern.13.48. [DOI] [PMC free article] [PubMed] [Google Scholar]
- 26.Toutzaris D, et al. A novel giant peroxisomal superoxide dismutase motif-containing protein. Free Radic Biol Med. 2010;48:811–820. doi: 10.1016/j.freeradbiomed.2009.12.023. [DOI] [PubMed] [Google Scholar]
- 27.Efeyan A, et al. Regulation of mTORC1 by the Rag GTPases is necessary for neonatal autophagy and survival. Nature. 2013;493:679–683. doi: 10.1038/nature11745. [DOI] [PMC free article] [PubMed] [Google Scholar]
- 28.Menon S, et al. Spatial Control of the TSC Complex Integrates Insulin and Nutrient Regulation of mTORC1 at the Lysosome. Cell. 2014;156:771–785. doi: 10.1016/j.cell.2013.11.049. [DOI] [PMC free article] [PubMed] [Google Scholar]
Associated Data
This section collects any data citations, data availability statements, or supplementary materials included in this article.