

Abstract
Objective
This study investigated the possible impact of simulated hearing loss on speech perception in Spanish-English bilingual children. To avoid confound between individual differences in hearing-loss configuration and linguistic experience, threshold-elevating noise simulating a mild-to-moderate sloping hearing loss was used with normal-hearing listeners. The hypotheses were that: (1) bilingual children can perform similarly to English-speaking monolingual peers in quiet; (2) for both bilingual and monolingual children, noise and simulated hearing loss would have detrimental impacts consistent with their acoustic characteristics (i.e., consonants with high-frequency cues remain highly intelligible in speech-shaped noise, but suffer from simulated hearing loss more than other consonants); (3) differences in phonology and acquisition order between Spanish and English would have additional negative influence on bilingual children's recognition of some English consonants.
Design
Listeners were 11 English-dominant, Spanish-English bilingual children (6-12 years old) and 12 English-speaking, monolingual age peers. All had normal hearing and age-appropriate non-verbal intelligence and expressive English vocabulary. Listeners performed a listen-and-repeat speech perception task. Targets were 13 American-English consonants embedded in vowel-consonant-vowel (VCV) syllables. VCVs were presented in quiet and in speech-shaped noise at signal-to-noise ratios (SNRs) of -5, 0, 5 dB (normal-hearing condition). For the simulated hearing-loss condition, threshold-elevating noise modeling a mild-to-moderate sloping sensorineural hearing loss profile was added to the normal-hearing stimuli for 0, 5 dB SNR, and quiet. Responses were scored for consonant correct. Individual listeners' performance was summarized for average across 13 consonants (overall) and for individual consonants.
Results
Groups were compared for the effects of background noise and simulated hearing loss. As predicted, group performed similarly in quiet. The simulated hearing loss had a considerable detrimental impact on both groups, even in the absence of speech-shaped noise. Contrary to our prediction, no group difference was observed at any SNR in either condition. However, although non-significant, the greater within-group variance for the bilingual children in the normal-hearing condition indicated a wider “normal” range than for the monolingual children. Interestingly, although it did not contribute to the group difference, bilingual children's overall consonant recognition in both conditions improved with age, whereas such a developmental trend for monolingual children was observed only in the simulated hearing-loss condition, suggesting possible effects of experience. As for the recognition of individual consonants, the influence of background noise or simulated hearing loss was similar between groups and was consistent with the prediction based on their acoustic characteristics.
Conclusions
The results demonstrated that school-age, English-dominant, Spanish-English bilingual children can recognize English consonants in a background of speech-shaped noise with similar average accuracy as English-speaking monolingual age peers. The general impact of simulated hearing loss was also similar between bilingual and monolingual children. Thus, our hypothesis that bilingual children's English consonant recognition would suffer from background noise or simulated hearing loss more than the monolingual peers was rejected. However, the present results raise several issues that warrant further investigation, including the possible difference in the “normal” range for bilingual and monolingual children, influence of experience, impact of actual hearing loss on bilingual children, and stimulus quality.
Keywords: Consonant recognition, noise, simulated sensorineural hearing loss, Spanish-English bilingual, children
Introduction
In the U.S., between 2000 and 2012, while the number of students whose dominant language was not English receiving services under the Individuals with Disabilities Education Act remained the same, the figure for Latino students with disabilities increased by half a million (National Center for Education Statistics [NCES] 2013). Between 1976 and 2013, the percent of students received services for hearing loss remained approximately 1.3% (NCES 2014). The prevalence of hearing loss in the Latino population has been estimated to be at least similar to or higher than the non-Latino population in the U.S (Lee et al. 1996; Nash et al. 2011; Pape et al. 2014; Cruickshanks et al. 2015). Therefore, considering the overall increase of Latino population, the number of Latino children with hearing loss should also have increased. However, in 2015, among the 12,970 ASHA-certified audiologists, only 266 (2%) self-identified as bilingual service providers in Spanish (ASHA 2016a, b). These statistics imply that, despite the research evidence, audiologic assessments using speech materials with Spanish-speaking bilingual speakers are almost always conducted by English-speaking monolingual audiologists regardless of the bilingual speaker's proficiency in English. Of the 63 million 5-19 year-old children in the U.S., 9.9 million speak Spanish at home. Of these Spanish-speaking children, approximately 79% report that they speak English very well in contrast to 46% for individuals 20 years and over (U.S. Census Bureau 2013). These statistics suggest that the English-only testing practice may be more prevalent with bilingual children than adults simply because they speak English as well as English-speaking monolingual peers.
The present study was designed to provide evidence on bilingual children's speech perception performance in English and examined whether English-dominant bilingual children's speech perception in English show substantial differences from that of English-speaking monolingual peers. The goals were to determine whether a considerable gap is observed between bilingual and monolingual children despite normal hearing and high proficiency in English, and whether the impact of hearing loss is more detrimental for bilingual children than for monolingual children if their hearing loss configurations were similar. To achieve these goals, the present study compared consonant perception in English-dominant bilingual children from Spanish-speaking homes to that of English-speaking monolingual peers. Consonants were chosen as targets because consonant recognition reflects difficulty with word recognition in noise more than vowel recognition for both monolingual and bilingual children (García et al. 2016), suggesting the greater susceptibility of consonants to distortion by noise. English-dominant bilingual children were chosen to obtain results representing the majority of immigrant children growing up in the U.S. Because the present study was the first step in the investigation on hearing loss and bilingualism, to avoid confound between the individual differences associated with hearing-loss configurations and linguistic experience, instead of recruiting participants with hearing loss, a simulated hearing loss modeled on the configuration reported to be most common in children (Pittman & Stelmachowicz 2003) was used even though the generalizability of the results would be limited.
Both a noisy listening environment and hearing loss are known to have unfavorable effects on English-speaking monolingual children's consonant recognition (Danhauer et al. 1986; Johnson et al. 1997; Nishi et al. 2010; Leibold & Buss 2013). Furthermore, the differences in phonetic inventories and acquisition sequence between Spanish and English may have additional negative influence on the consonant recognition in bilingual children compared to their monolingual peers.
American English has 24 consonants /b d g p t k f θ s ʃ h v ð z ʒ ʧ ʤ m n ŋ l ɹ w j/ and 16 vowels /i ɪ ɛ æ ʌ ə ɑ ɔ ʊ u eɪ aɪ aʊ oʊ ɔɪ ju/ (Ladefoged 1993). In contrast, Spanish has 18 consonants /b d g p t k f s x ʧ m n ɲ l r ɾ w j/ and five vowels /i e a o u/ with dialectal variability; Spanish learners of English tend to substitute eight of the nine English consonants /v θ ð z ʤ ʃ ʒ h ŋ/ that have no Spanish equivalents with “similar” Spanish consonants (e.g., /b/ for /v/, /f/ or /s/ for /θ/, /d/ for /ð/, /s/ for /z/, /ʧ/ for /ʤ ʃ ʒ/, etc.; cross-linguistic substitutions/Spanish accent) (Kenworthy 1987; Whitley 2002). Consonants common to both languages (/b p d t g k m n ʧ s j w/) also differ in detailed acoustic cues (e.g., voicing distinction between /b/-/p/, /d/-/t/, /g/-/k/ contrasts; denti-alveolar for Spanish /t d/ vs. alveolar for English /t d/). Another source of difference is allophonic variation (e.g., /d/-/t/ neutralization to a flap /ɾ/ in intervocalic position in English vs. /d/ to /ð/ spirantization in Spanish) (Whitley 2002). As a result of allophonic variation, even though 10 English consonants (/v θ ð z ʃ ʒ h ʤ ŋ ɹ/) are not phonemic in most dialects of Spanish including Mexican Spanish (Gildersleeve-Neumann et al. 2008), they may occur as allophones of shared consonants. However, bilingual speakers from early childhood appear to have age-appropriate phonological skills in both languages regardless of dominant language (Goldstein et al. 2005), suggesting that simple inventory comparisons would not predict possible substitutions or perceptual errors in speakers who are bilingual since early childhood.
Three subgroups have been identified for English and Spanish consonants based on the ages of production mastery. They are called: early 8 (/m b j n w d p h/), middle 8 (/t ŋ k g f v ʧ ʤ/), and late 8 (/ʃ θ s z ð l ɹ ʒ/) for English (Shriberg 1993); early 6 (/p d n t j w/), middle 6 (/k g × m f ɲ/), and late 6 (/ʧ b l r ɾ s/) for Spanish (Goldstein et al. 2005). Consistent production is expected by age three for early-developing sounds, age 5.5 for middle-developing sounds, and by age 7.5 for the late-developing sounds. This suggests that /m b/ are acquired later in Spanish than in English, whereas /t/ is acquired earlier in Spanish than in English. While the physiological/articulatory development determines the general order of typical acquisition common across languages (e.g., nasal and stop sounds before fricative/affricate sounds), phonological constraints and frequency of occurrence particular to a language are known to be associated with the language-specific order of phoneme production development (Edwards & Beckman 2008).
The brief comparison of phonetic inventories above illustrates the complex nature of bilingual phonetic inventory and speech development. The authors are unaware of any comprehensive study on consonant recognition for bilingual children. However, sequential bilingual preschoolers' voicing perception and production in the second language are known to become native-like after an average of 18-19 months of exposure to the second language through formal instruction (McCarthy et al. 2014). Similarly, Goldstein et al. (2005) observed no difference in phonological skills among predominantly Spanish-speaking, predominantly English-speaking, and balanced 5-year-old Spanish-English bilingual children. In addition, they found these bilingual children made no cross-linguistic substitutions in English. These findings show that after relatively short exposure to the second language, children can acquire native-like phonetic distinctions in the second language, and that unlike bilingual speakers who acquire the second language after the onset of puberty, language dominance may not be a meaningful predictor for speech production skills in children who are bilingual since early childhood. Assuming accurate speech perception is a prerequisite for development of speech production, these findings also suggest that bilingual children quickly master to perceive phonetic distinctions in the second language. However, note that the previous studies examined bilingual children's speech perception in quiet only and did not consider whether the bilingual children could perceive speech in noisy environments as accurately as in quiet. In noise, differences in phonological acquisition order and subtle phonetic differences between Spanish and English may exacerbate bilingual children's speech perception performance more than that of monolingual children.
English-speaking monolingual children's consonant recognition remains less accurate than that of adults until early teen-age years in both quiet and various challenging listening environments (Neuman & Hochberg 1983, Danhauer et al. 1986, Johnson 2000, Nishi et al. 2010, Leibold & Buss 2013). In particular, Nishi et al. (2010) reported that in the background of speech-shaped noise, the majority of consonant errors observed for both adults and children were single-feature confusions (e.g., /b/-/p/ confusion for voicing, /b/-/v/ confusion for manner, /b/-/d/ confusion for place, etc.). They also showed that the mastery of accurate perception of front stop consonants (/b p/) is delayed compared to other consonants, even though these consonants are among the early 8 consonants, suggesting that a gap between speech perception and production development in English-speaking monolingual children. Similar gaps may be present for bilingual children.
Lastly, as for the impact of hearing loss, Johnson et al. (1997) reported that even in quiet, consonant recognition by English-speaking children with minimal high-frequency hearing loss was 15.7% poorer than their normal-hearing peers'. A greatest difference (43%) was observed in the perception of sibilance followed by the perception of place of articulation (16%). The frequency of spectral peaks of frication noise provides the main cues for sibilant consonants /s z ʃ/. For /s z/, the peaks tend to be higher than the fourth formant range, and for /ʃ/, the peaks are slightly lower and above the third formant range. The main cue for the place of articulation is the frequency and the rate of change in the first and second formants (formant transitions) between the consonant closure and an adjacent vowel (Stevens 1998). Therefore, the results of Johnson et al. (1997) suggest that English-speaking children with minimal high-frequency hearing loss have difficulty with perceiving the acoustic cues consistent with their hearing-loss configurations and the cues associated with relatively rapid spectral shifts in the low-frequency region. These general impacts of high-frequency hearing loss are expected to be similar across languages, but it is unclear how Spanish-English differences in phonetic detail and allophonic variation interact with the reduced cue access due to hearing loss or background noise. Interestingly, when Johnson et al. introduced noise (13 dB signal-to-noise ratio [SNR]), the gap between the children with and without hearing loss did not increase substantially (3.4%), suggesting that the detrimental impact of hearing loss – even when minimal – can be greater than that of noise. Still, it is unclear whether the impact of noise remains small at lower SNRs.
Regarding the impact of bilingualism and the influence of linguistic experience, Schmidtke (2016) posited that bilingual listeners who may not show obvious disadvantage in quiet may show poorer speech perception performance than monolingual peers in challenging listening environments because: (1) a bilingual speaker's experience with one of the languages is by default less than that of a monolingual speaker's due to their split exposure between two languages; (2) the more encounter a listener has with certain speech input varying in speaking style, dialect, gender, age, etc., the stronger the memory trace of the item becomes, which in turn facilitates more robust processing of the item in challenging listening environments.
The present study examined the combined impact of different levels of background noise (-5, 0, and 5 dB SNR) and hearing loss (mild-to-moderate sloping) on English consonant recognition in English-dominant bilingual children. Simulated hearing loss was used with listeners with normal hearing to avoid confound between individual differences in hearing loss configuration and linguistic experience. We hypothesized that: (1) little difference would be observed between bilingual and monolingual children because of the “native/near-native” English proficiency of bilingual children in the present study; (2) for both groups of children, noise and simulated hearing loss would have detrimental impacts consistent with their acoustic characteristics (i.e., greater low-frequency than high-frequency impact for speech-shaped noise; greater high-frequency than low-frequency impact for simulated hearing loss); (3) differences between Spanish and English (phonological and order of acquisition) would have additional negative influence on bilingual children's recognition of some English consonants in noise performance. Results were analyzed for average percent-correct across 13 consonants (overall performance) and for individual consonants at each background noise level with and without simulated hearing loss.
Materials and Methods
Participants
Twenty-three typically-developing, 6- to 12-year-old children (12 monolingual English [7 female, 5 male] speakers and 11 Spanish-English bilingual [6 female, 5 male] speakers) from the Omaha area participated as listeners. These listeners also participated in the study by García et al. (2016). The lower band of the age range was chosen so that the youngest bilingual children had had at least one year of exposure to spoken English through formal instruction by the time of participation, and to ensure the majority of children could consistently produce target consonants. This age range is also consistent with the minimal cross-linguistic effects on bilingual children's speech production (Goldstein et al. 2005). The higher band was chosen based on the previous reports that consonant recognition in the background of speech-shaped noise by English-speaking monolingual children is adult-like for children 11 years and older (Nishi et al. 2010, Leibold & Buss 2013).
Table 1 presents a summary of bilingual children's language and family background along with articulation errors. All bilingual children had parents of Mexican origin, were born in the U.S., and were raised in Spanish-speaking homes. All had been informally exposed to English in infancy and toddlerhood through older siblings, community, and media, and had begun formal instruction in English after entering pre-school (4-5 years of age)1. All except for three children who attended dual language programs, received their entire formal instruction in English. In dual language programs in the Omaha area, students receive a minimum of 50% of their instruction in Spanish. As part of another study (García et al. 2016), these bilingual children were tested on the recognition of English consonant-vowel-consonant and Spanish consonant-vowel-consonant-vowel real words from the Computer Assisted Speech Perception Assessment (Boothroyd 2008). On average, these bilingual listeners' Spanish and English word recognition scores were similar at 5 dB SNR (Spanish = 68%, English = 64%). However, at lower SNRs, word recognition scores were higher for English (27%, 55%, and 68% for -10, -5, and 0 dB SNR, respectively) than for Spanish (7%, 25%, and 55% for -10, -5, and 0 dB SNR, respectively), suggesting that the dominant language of these bilingual children was English.
Table 1.
Bilingual children's language, family background, and articulation errors.
| Age_ID | Background Information for Parents | Language Use | Articulation Errors | |||||||||||
|---|---|---|---|---|---|---|---|---|---|---|---|---|---|---|
|
|
|
|||||||||||||
| Age of Learning Onset | Years of US Residence | Final Education | Occupation | Home | School | Social | ||||||||
|
|
|
|||||||||||||
| Mo | Fa | Mo | Fa | Mo | Fa | Mo | Fa | Mo | Fa | Sib | ||||
| 6_1 | No Eng. | 22 | 10 | 18 | HS | HS | SaH | MP | S | S | E | E | SE | /s/ → /z/ /j/ → /l/ /v/ → /b/ /r/ → /w/ /θ/ → /f/ |
| 6_2 | No Eng. | 20 | 10 | 10 | ES | HS | SaH | MP | S | S | E | E | S | /v/ → /b/ /s/ → /z/ /θ/ → /f/ /z/ → /s/ |
| 7_1 | 25 | 30 | 11 | 11 | B | ES | SaH | Const | S | S | E | E | S | /s/ → /z/ |
| 7_2 | 21 | 22 | 13 | 13 | ES | MS | SaH | Const | SE | SE | E | SE | SE | |
| 7_3 | 18 | 18 | 12 | 12 | HS | HS | SaH | Const | SE | SE | E | E | SE | /z/ → /s/ /ð/ → /d/ |
| 8_1 | Inf. | 18 | 31 | 18 | HS | ES | SaH | Carp | E | S | SE | E | E | /s/ → /z/ |
| 8_2 | 18 | 22 | 22 | - | HS | MS | SaH | TD | S | S | E | E | E | /v/ → /b/ /v/ → /f/ |
| 9_1 | 37 | No Eng. | 9 | 9 | HS | ES | SaH | Const | S | S | E | SE | S | |
| 10_1 | Inf. | 18 | 31 | 18 | HS | HS | SaH | Carp | S | S | E | E | SE | /s/ → /z/ |
| 11_1 | No Eng. | 22 | 10 | 22 | HS | HS | SaH | MP | S | S | E | E | SE | |
| 12_1 | 21 | 22 | 13 | 13 | ES | HS | SaH | Const | S | S | E | SE | SE | |
Abbreviations. No Eng: Does not speak English, Inf.: Infancy, Mo: Mother, Fa: Father, Si: Siblings, US: United States, ES: Elementary school, MS: Middle school, HS: High school, B: Bachelors, Infancy: started to learn English before age 1. SaH: Stay-at-Home parent, MP: Meatpacking, Const: Construction, TD: Truck Driver, Carp: Carpenter, S: Spanish, E: English, SE: Spanish and English, -: Information not available.
Note. None of the articulation errors were Spanish-accented.
Monolingual children were from homes where only English was spoken. Their parents had higher final education (associate or higher) than parents of bilingual children and engaged in professional, technical, and managerial occupations. Five children were home-schooled by their mothers.
All participants had normal hearing (≤ 20 dB HL bilaterally at octave frequencies from 0.25 to 8 kHz). All had age-appropriate articulation in Standard American English (Goldman-Fristoe Test of Articulation [GFTA-2], Goldman & Fristoe 2000), expressive vocabulary in English (Expressive Vocabulary Test [EVT-2], Williams 2007), and nonverbal intelligence (Test of Nonverbal Intelligence [TONI-4], Brown et al. 2010). One 7-year-old monolingual child had bidirectional /s/-/z/ articulation errors that would interfere scoring. Figure 1 presents EVT-2 and TONI-4 scores for monolingual and bilingual children. With the exception of one monolingual child, who had a very high score on the EVT-2, all participants scored within the age norm on both measures.
Figure 1.

TONI-4 and EVT-2 standard scores for bilingual (circles) and monolingual (squares) children. Each data point represents a listener.
Stimulus Materials
Experimental stimuli consisted of 39 vowel-consonant-vowel (VCV) syllables containing 13 American English consonants /b d g p t k v z f s ʃ m n/ symmetrically framed by one of the three point vowels in American English /i a u/ (e.g., /ɑkɑ/, /isi/, /udu/) that are similar to Spanish vowels /i a u/ (Whitley 2002). The 13 consonants were chosen such that the youngest participants, regardless of language background, could articulate them (Goldstein et al. 2005, Sander 1972). For this reason, /θ ð ʧ ʤ l ɹ/ were not included. The majority of VCVs are non-words, thus use of VCVs was expected to minimize the difference due to lexical access across ages and between bilingual and monolingual groups.
An adult female speaker (Midwestern dialect) digitally recorded (24 bit, 44.1 kHz sampling rate) VCVs in a sound-attenuated room. A head-worn microphone (Shure BETA 53) was placed approximately 2.5 cm away from the right corner of the speaker's mouth and routed to a mixer (Shure SCM268). All VCVs were recorded in a carrier sentence, “I got ___.” The speaker read a randomized list of sentences five times at her normal speaking rate with a falling intonation. She placed similar stress on initial and final vowels and maintained the distinction between /d/ and /t/ in VCVs. Target VCVs were excised from the sentence frame, and then equalized for root-mean-square (RMS) amplitude. Each excised token had a 5-ms lead before and after the VCV. Equalized files were reviewed by the second author for quality (i.e., unambiguous consonant identity with no unwanted noise). After removing tokens of undesired quality, remaining VCVs were mixed with speech-shaped noise (ANSI S3.5-1997) to produce four SNRs for the normal-hearing condition (-5, 0, 5 dB SNR, and quiet). These SNRs were chosen to replicate previous results and to ensure that a sizable performance decline in the background of speech-shaped noise would be observed. Specifically, Nishi et al. (2010) and Leibold and Buss (2013) reported that consonant recognition performance of 6- to 7-year-old children and 5- to 7-year-old children was slightly poorer than 80% at 0 dB SNR, suggesting that poorer performance would be expected at a lower SNR for English-speaking monolingual children. This estimate is also consistent with the results of Leibold and Buss (2013). In their study, 5- to 7-year-old children's consonant recognition at -5 dB SNR in the speech-shaped noise condition was slightly higher than 60%.
To ensure high intelligibility, all tokens for the normal-hearing condition were presented to four English-speaking monolingual adult pilot listeners with normal hearing for an open-set identification of the target consonants. Two tokens for each VCV whose intelligibility was perfect in quiet and gradually declined with lowering SNR were chosen as stimuli.
For the simulated hearing-loss condition, threshold-elevating noise (Desloge et al. 2012)2 was added to the stimuli for the normal-hearing condition (0, 5 dB SNR, and quiet). Note that stimulus materials for the quiet in the simulated hearing-loss condition did not contain speech-shaped noise. Stimulus materials for -5 dB SNR were not included because pilot results with adult listeners with normal hearing showed floor performance. Due to the summation of noises, the actual SNRs may be lower in the simulated hearing-loss condition. However, for simplicity, the stimuli with both speech-shaped and hearing-loss noises are referred to by the levels of speech-shaped noise throughout this paper.
The simulation method used in the present study had been shown to mimic the characteristics of sensorineural hearing loss (i.e., elevated thresholds, reduced dynamic range, and loudness recruitment) in adult listeners with normal hearing (Desloge et al. 2012). Desloge et al. have reported that, on average, the simulated thresholds in the adult listeners with normal hearing approximated the actual thresholds of listeners with hearing loss with small RMS differences (2.2 dB for average absolute thresholds and 5.6 dB for the notched-noise masked thresholds, respectively). Briefly, to create the threshold-elevating noise, Gaussian noise was spectrally shaped to create frequency-dependent threshold shifts at six octave frequencies from 0.25 to 8 kHz. When this noise was added to each stimulus, 150 ms ramps were appended at the onset and offset of each stimulus to avoid sudden amplitude change, thus the stimuli in the simulated hearing-loss condition were 300 ms longer than those in the normal-hearing condition. The target threshold shifts at the six octave frequencies (.25, .5, 1, 2, 4, and 8 kHz) were 19, 22, 35, 47, 46, and 51 dB HL, respectively3. This sloping hearing-loss profile represents the average of data for 11 ears with mild-to-moderate hearing loss from Pittman and Stelmachowicz (2003) excluding any octave thresholds greater than 70 dB HL. Sloping hearing loss was the most common (33%) hearing loss profile among the 227 children included in their study. The desired threshold shifts at the six octave frequencies were validated with two adult listeners with normal hearing4. The average difference between the target and the observed simulated thresholds across the six frequencies was -3.6 dB. Note that the desired and observed threshold shifts were relative to a listener's audiometric threshold.
Figure 2 illustrates the influence of speech-shaped noise and threshold-elevating noise (simulating mild-to-moderate sloping hearing loss) on the spectral properties of a stimulus (/ɑsɑ/, black solid line). As can be seen, the spectra of /ɑsɑ/ are characterized by six peaks – the fundamental frequency (below 0.5 kHz), the first four formants of vowel /ɑ/ (between 0.5 and 5 kHz), and a broad, high-frequency peak (above 5 kHz) for /s/. As the blue dashed line shows, the speech-shaped noise masked the speech spectra in the lower frequencies (i.e., vowel formants, nasal, labial, and voiced consonants) more than it masked the high-frequency speech cues (i.e., alveolar and fricative consonants). In contrast, as the red dashed line shows, the hearing-loss noise had a greater masking power in the high-frequency region than in the low-frequency region. Therefore, for /ɑsɑ/, when the speech-shaped noise is added (blue solid line), most cues for the vowel /ɑ/ may be masked but the cues for /s/ remain accessible even at 0 dB SNR. However, when the hearing-loss noise is added, even when speech-shaped noise was not present (red solid line), only some vowel cues and low-frequency consonant cues are available. The available cues are severely limited when speech-shaped and hearing-loss noises are combined (green solid line). This comparison of the effects of speech-shaped and hearing-loss noises on speech signal shows that the impact of hearing-loss noise would be greater than that of speech-shaped noise at all SNRs (cf. Johnson et al. 1997). In addition, even when the primary consonant cues are masked by the hearing-loss noise, the remaining low-frequency information that provides secondary cues, such as formant transitions, voicing, and duration may help identifying the target consonant. However, the cue-weighting patterns are known to be language-specific and develops with experience (e.g., Mayo et al. 2003, Nittrouer 2002, Underbakke et al. 1988). Therefore, bilingual children, especially the younger ones, may not be able to take advantage of the secondary cues in the simulated hearing-loss condition, whereas monolingual children may be able to use such subtle cues to identify the target consonants correctly.
Figure 2.

Spectra of speech (/ɑsɑ/; black solid line) in quiet, simulated hearing-loss noise (HL noise; red dashed line), speech-shaped noise for 0 dB SNR (SS noise; blue dashed line), /ɑsɑ/ plus SS noise (blue solid line), /ɑsɑ/ plus HL noise (red solid line), and /ɑsɑ/ plus SS and HL noises (green solid line).
In total, 546 stimulus files (39 VCVs × 2 tokens × 4 SNRs = 312 for the speech-shaped noise condition and 39 VCVs × 2 tokens × 3 SNRs = 234 for the simulated hearing-loss condition) were created for this study.
Apparatus
The listening task was administered in a sound-attenuated booth. Stimulus materials were presented through a loud speaker (M-Audio Studiophile BX8a Deluxe) located directly in front of the listener. The presentation level was calibrated to 65 dBA for speech stimuli in quiet, at 75 cm from the participant's forehead. During the experimental task, audio and video recordings of listeners' responses were made for subsequent reliability checks using the head-mounted microphone (Shure BETA 53) and a video camera (Canon Vixia HF R21). Custom software controlled stimulus presentation, audio recording of responses, and on-line scoring of responses during the listening task.
Procedure
All participants were tested in two 2-hour sessions. In the first session, after obtaining consent for participation, pure-tone audiometric screening was performed with TDH-49 earphones in a sound-attenuated booth. Then (in an adjoining room), an age-normed test of articulation for Standard American English speech sounds, GFTA-2, was administered to identify articulation errors that could confound scoring of the verbal responses during the listening task. To assess age-appropriate nonverbal intelligence and expressive vocabulary in English, TONI-4 and EVT-2 were administered either in the first or second session as time allowed.
Prior to the experimental task, two short blocks were administered to familiarize listeners with listening to speech in noise at various SNRs. In the first familiarization block, two lists of 10 sentences (e.g., List 1A and 1B) from the Bamford-Kowal-Bench Speech-in-Noise Test (BKB-SIN, Etymōtic Research 2005) were used. In a BKB-SIN list, SNR decreases from 21 dB to -6 dB in 3-dB step, allowing listeners to be gradually familiarized with listening to meaningful utterances in multi-talker babble. Use of meaningful speech in the first block allowed the tester to become familiar with a child's articulatory patterns which was also documented with GFTA-2 while ensuring that the child understood the task. In the second familiarization block, the 13 VCVs recorded by a female speaker (not the test stimulus speaker), mixed with speech-shaped noise (0, 5 dB SNR and quiet) were presented to familiarize participants with the actual task in the main study. These VCVs included the same 13 consonants and three vowels as in the experimental task. Tokens with hearing-loss simulation or -5 dB SNR were not used in familiarization. The familiarization VCVs were presented in the descending order of SNR (i.e., quiet, 5 dB SNR, then 0 dB SNR) as with the BKB-SIN sentences. Throughout the familiarization, participants were encouraged to provide responses other than “I don't know,” even if they had to guess. Positive reinforcement was given for responses regardless of correctness.
For the main experimental task, participants were reminded to repeat exactly what they heard and were further informed that the noise level was going to vary from one trial to the next. After each response, the participant was presented with a picture unrelated to the stimuli (e.g., cartoon characters, cute animals, etc.) via computer screen to maintain their engagement in the task and reduce boredom. To avoid fatigue, the 546 total experimental stimuli were divided into two blocks of 273 tokens equally representing the seven condition × SNR combinations. Each participant completed one block per session. Within a block, the 273 tokens were randomly presented. The order of blocks was counterbalanced across participants.
During the experimental task, the tester (a graduate-level audiology student who had acquired both Spanish and English simultaneously as a child) transcribed the consonant in the participant's response by clicking on one of 19 alternatives (13 targets plus “l,” “r,” “dh [/ð/],” “th [/θ/],” “dg [/ʤ/ or /ʒ/],” and “ch [/ʧ/]”) on a computer screen. Vowel errors were disregarded. In instances where the participant's responses were outside the 19 options (e.g., consonant clusters, omissions, or multi-syllabic responses), the tester typed the whole response in a box provided on the screen using pre-specified phonetic coding. If the tester was uncertain of a response, the participant was asked to repeat it. When participants' responses included the articulation errors documented in GFTA-2, the experimenter sought for clarification by asking a question using a minimal pair contrast (e.g., Did you mean /b/ as in “Boy” or /v/ as in “Victor”?). The tester then indicated their confidence of transcription by selecting “Sure” or “Not Sure” in the testing program and continued with the next trial. Only the responses for which the tester had no hesitation regarding the transcription were rated “Sure.” Ninety-four responses including consonant clusters, omissions (i.e., vowel-only responses), or cases where target-response relationship could not be determined (e.g., /mudliv/ for a response to /idi/) were transcribed but regarded as incorrect responses.
For reliability, a second tester (a Spanish-English bilingual who learned English as an adult and was trained in phonetic transcription), blindly reviewed a subset of the recordings that included 10% of responses rated “Sure” (1,227 cases) and all the responses rated “Not Sure” (288 cases) by the first tester5. For 294 cases where the testers did not agree (95 “Sure” and 199 “Not Sure” cases), the two testers reviewed the audio recording a second time. Of the “Sure” and “Not Sure” cases, 61% and 66% were for bilingual children's responses, respectively. Of the 294 cases, four cases required the testers to review the video recording. Agreement was not reached in two of these four cases because the audio did not contain the response and the video was not informative. Including the above two cases, the testers did not reach agreement for a total of 50 cases (43 bilingual, 7 monolingual). These 50 cases were excluded from further analyses.
Results
Results were evaluated in two series of analyses. The first series of analyses examined whether there was a general difference between bilingual and monolingual children's percent-correct consonant recognition due to simulated hearing loss and background noise level. The second series of analyses evaluated whether the impact of simulated hearing loss on the recognition of individual consonants was similar between bilingual and monolingual children. For statistical analyses, percent-correct scores were converted into rationalized arcsine units (RAU; Studebaker 1985). Effects with p-values lower than 0.05 were considered significant. For multiple comparisons following a significant F-test on a repeated measure, Bonferroni corrections were applied to maintain the maximum familywise error rate at 0.05.
Overall Performance
Figure 3 illustrates the overall percent-correct consonant recognition scores for bilingual and monolingual children at four SNRs in two conditions. Table 2 presents averages and standard deviations corresponding to the results in Figure 3.
Figure 3.

Percent-correct consonant recognition for bilingual children (circles) and monolingual children (triangles) at four noise levels in normal-hearing and simulated hearing-loss conditions. Each data point represents a listener. Darker fills represent younger children.
Table 2.
Average percent-correct consonant recognition for bilingual and monolingual children at four SNRs in normal-hearing and simulated hearing-loss conditions. Numbers in the parentheses are standard deviations.
| Normal-Hearing Condition | Simulated Hearing-Loss Condition | ||||||||
|---|---|---|---|---|---|---|---|---|---|
|
|
|
||||||||
| -5 dB (SD) | 0 dB (SD) | 5 dB (SD) | Quiet (SD) | Average | 0 dB (SD) | 5 dB (SD) | Quiet (SD) | Average | |
| Monolingual | 52.11 (4.50) | 71.15 (4.15) | 88.46 (2.89) | 98.72 (1.45) | 77.61 (2.54) | 28.24 (3.80) | 31.94 (3.61) | 41.56 (5.90) | 33.91 (2.71) |
| Bilingual | 46.26 (10.31) | 66.01 (7.46) | 83.68 (6.93) | 98.48 (1.60) | 73.61 (5.36) | 26.29 (5.30) | 30.77 (3.92) | 38.55 (5.65) | 31.87 (3.84) |
As can be seen, bilingual and monolingual children's overall consonant recognition overlapped considerably at each SNR in each condition. Notice that for both bilingual and monolingual children, average percent-correct consonant recognition scores in quiet dropped by approximately 60% when simulated hearing loss was introduced, illustrating the detrimental impact of simulated hearing loss. As a result, individual listeners' percent-correct scores had little overlap across listening conditions at each SNR. Also a trend of age-related performance improvement was observed in the normal-hearing condition, consistent with the age-related change reported in the previous studies (Leibold & Buss 2013, Nishi et al. 2010). Therefore, although developmental trend was not the original focus of the present study, listener age was entered as a continuous predictor to account for performance variance due to development.
First, an analysis of variance (ANOVA) was conducted to evaluate whether performance in normal-hearing and simulated hearing-loss conditions were different. SNR was not considered in this analysis. Individual listeners' scores for the normal-hearing and simulated hearing-loss conditions were dependent variables, group was a between-subjects variable, condition was a within-subjects variable, and age was a continuous predictor. Results confirmed the visual inspection of Figure 3 and showed that listener performance was significantly better in the normal-hearing condition (76%) than in the simulated hearing-loss condition (33%) [F1, 19 = 164.072, p < .001, ]6. Based on these results, data for normal-hearing and hearing-loss conditions were analyzed separately in the subsequent analyses.
Normal-Hearing Condition
To determine whether bilingual and monolingual children's consonant recognition differed when speech-shaped noise was present, an SNR × group ANOVA with age as a continuous predictor was performed on the results for the normal-hearing condition. Neither Hartley's Fmax test at each SNR nor Mauchly's W across SNRs were significant, suggesting that both between-group homogeneity of variance and sphericity across SNRs can be assumed. Results of ANOVA revealed significant main effects of group [F1, 19=8.600, p = .009, ], age [F1, 19=41.244, p < .001, ] and SNR [F3, 57 = 33.700, p < .001, ]. Pairwise comparisons on the effect of SNR with Bonferroni correction suggested that consonants recognition improved as the background noise level was reduced (p < .001 for all comparisons). The SNR × age interaction [F3, 57 = .298, p = .827, ] was not significant. Therefore, together with the post-hoc results for the significant main effect of SNR, these results for interaction suggest that decrease in SNR did not have a greater detrimental effect on younger children than on older children. Interactions involving group as a factor [group × age: F1, 19 = 4.495, p = .047, ; SNR × group: F3, 57 = 5.308, p = .003, ; SNR × group × age: F3, 57 = 4.701, p = .005, ] were significant, warranting further analyses to determine whether age and SNR had different influence on bilingual and monolingual children.
Interestingly, despite the significant main effect of group, orthogonal comparisons on the SNR × group interaction with Bonferroni correction revealed no difference between bilingual and monolingual children at any of the four SNRs (-5 dB SNR: p = .504; 0 dB SNR: p = .709; 5 dB SNR: p = .282; quiet: p = 1.000). This indicates that the significant SNR × group interaction was driven by the non-orthogonal comparisons. Therefore, together with the non-significant SNR × age interaction, this absence of group difference across SNRs suggests that the significant SNR × group × age interaction has little relevance to the focus of the present study, i.e., difference in consonant recognition in noise performance due to language background. Although this appears to contradict the significant main effect of group, considering that the group difference between bilingual (73.6%) and monolingual (77.6%) children in average scores across SNRs was small, it is reasonable to conclude that speech perception in noise performance for bilingual and monolingual children is similar on average. However, although statistically non-significant (i.e., Hartley's Fmax test), larger within-group variances in noise for the bilingual group (see Table 2) together with the significant age effect suggest that consonant recognition in noise performance for younger bilingual children tend to be poorer than that of monolingual peers (see also Figure 3).
Lastly, as a post-hoc analysis for the significant group × age interaction, the magnitude of the age effect on bilingual and monolingual children was evaluated by comparing the slopes of multiple regression obtained for each group. Individual listeners' average percent correct scores at four SNRs were dependent variables, and listener age was the independent variable in this analysis. Results revealed that the bilingual children's consonant recognition improved with age [b = .764, t9 = 4.018, p = .003], but no such trend was observed for the monolingual children [b = .284, t10 = .987, p = .347]. This result suggests that bilingual children's English consonant recognition in noise ability is still developing between 6 and 12 years old while monolingual children's consonant recognition in noise performance was asymptote by 6 years old.
The above results for the overall performance in the normal-hearing condition show that, on average, 6-12 year-old bilingual children with normal hearing recognized English consonants in quiet and in the background of speech-shaped noise as accurately as their monolingual peers did. Results also show that although the impact of change in background noise level was similar across ages, during the 6-12 year-old age span examined in the present study, bilingual children's consonant recognition in noise performance improved with age whereas for monolingual children, no age-related change was observed.
Simulated Hearing-Loss Condition
Similar to the normal-hearing condition, neither Hartley's Fmax test at each SNR nor Mauchly's W across SNRs were significant for the simulated hearing-loss condition, suggesting that both between-group homogeneity of variance and sphericity across SNRs can be assumed. Results of SNR × group ANOVA controlling for age revealed that only the main effect of age [F1, 19 = 6.238, p = .022, ] was significant, suggesting that consonant recognition improved with age for both bilingual and monolingual children. The absence of statistical significance for any of other effects, in particular for SNR effect, suggests that the detrimental effect of simulated hearing loss was responsible for most of the performance change and severely restricted the possible range for additional performance decline due to speech-shaped noise. In fact, the performance decline from the normal-hearing condition to simulated hearing-loss condition was 41% at 0 dB SNR, 55% at 5 dB SNR, and 59% in quiet. The performance change from quiet to 0 dB SNR in the normal-hearing condition were 32% (bilingual) and 28% (monolingual), whereas the comparable changes in the hearing-loss condition were only 12% and 13%, respectively. This restricted range may also have minimized the possible gap between bilingual and monolingual children.
Together with the visual comparison between the conditions (see Figure 3), these results suggest that although it was in the mild-to-moderate range, the simulated hearing loss used in the present study had a considerable, yet similar detrimental impact on bilingual and monolingual children's overall consonant recognition performance. The absence of group difference was unexpected, but it could be a byproduct of the massive performance decline caused by the simulated hearing loss. The significant performance improvement with age was observed for both groups. This result suggests that the reduced access to the high-frequency cues introduced by simulated hearing loss brought out the possible effect of linguistic experience in the monolingual children that speech-shaped noise in the normal-hearing condition alone did not reveal.
Recognition of Individual Consonants
Even though the overall consonant recognition was similar between the groups, gaps may be observed in the recognition of individual consonants. To address this issue, data from the three background noise levels (0, 5 dB SNR, and quiet) common between two conditions were analyzed to compare the recognition of individual consonants between bilingual and monolingual children. Figure 4 illustrates how bilingual (circle) and monolingual (triangle) groups' average percent-correct recognition of individual consonants varied as a function of background noise level in the normal-hearing (open symbols) and simulated hearing-loss (filled symbols) conditions.
Figure 4.
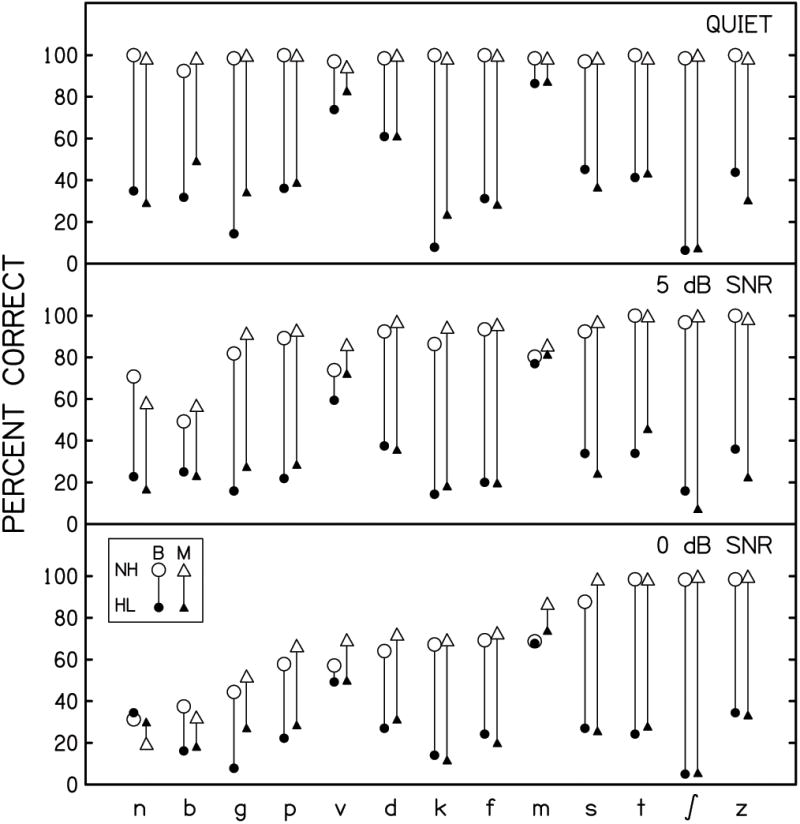
Percent-correct recognition of individual consonants for bilingual (B; circle) and monolingual (M; triangle) children at three SNR shared between the normal-hearing (NH; open symbol) and simulated hearing-loss (HL; filled symbol) conditions. Influence of simulated hearing loss is represented by the length of the line connecting the symbols for the two conditions. Each data point represents a group average. Consonants are arranged according to the averages across groups at 0 dB SNR in the normal-hearing condition.
As predicted from the acoustic characteristics of speech-shaped and simulated hearing-loss noises (see Figure 2), sibilants /ʃ s z/ and a high-frequency voiceless stop /t/ were little affected by the speech-shaped noise, and their recognition remained more accurate than the other consonants across SNRs in the normal-hearing condition. In contrast, when the simulated hearing loss was added, the correct recognition of these consonants dropped by more than 50% even when speech-shaped noise was not present (quiet). Interestingly, the detrimental impact of simulated hearing loss was considerably smaller for two consonants /v m/ across three SNRs. Some consonants revealed slightly greater group differences, but in general, no striking difference was observed between bilingual and monolingual children.
To statistically evaluate the above observations, a group × condition × SNR × consonant ANOVA controlling for listener age was conducted on results from the common SNRs (0, 5 dB SNR, and quiet) between normal-hearing and simulated hearing-loss conditions7. In this analysis, group was a between-subjects variable; condition, SNR, and consonant were within-subjects variables.
First, a non-significant Hartley's Fmax test at each SNR indicated that between-group homogeneity of variance can be assumed. As for within-subjects variances, Mauchly's W was significant for condition × consonant interaction [W77 = .0005, p = .004]. Therefore, the degrees of freedom associated with this interaction were adjusted with the Huynh-Feldt (ε = .781) correction. Statistical results associated with consonant are summarized in Table 3.
Table 3.
Summary of the group × condition × SNR × consonant ANOVA controlling for listener age. Only the effects associated with the consonant factor are presented here. For cases where sphericity assumption was not met, degrees of freedom (dfs) were adjusted by applying Huynh-Feldt (ε = .781) correction.
| Effect (* = significant effect) | dfs | F | p |
|
|
|---|---|---|---|---|---|
| * Consonant | 12, 228 | 1.913 | .034 | .091 | |
| Consonant × Group | 12, 228 | .636 | .811 | .032 | |
| * Consonant × Age | 12, 228 | 2.050 | .021 | .097 | |
| Consonant × Group × Age | 12, 228 | .564 | .870 | .029 | |
| * Condition × Consonant | 9.378, 178.180 | 2.783 | .004 | .128 | |
| Condition × Consonant × Group | 9.378, 178.180 | .897 | .533 | .045 | |
| Condition × Consonant × Age | 9.378, 178.180 | 1.150 | .329 | .057 | |
| Condition × Consonant × Group × Age | 9.378, 178.180 | .966 | .472 | .048 | |
| * SNR × Consonant | 24, 456 | 1.709 | .020 | .083 | |
| SNR × Consonant × Group | 24, 456 | .898 | .605 | .045 | |
| SNR × Consonant × Age | 24, 456 | 1.224 | .215 | .061 | |
| SNR × Consonant × Group × Age | 24, 456 | .789 | .752 | .040 | |
| * Condition × SNR × Consonant | 24, 456 | 1.769 | .014 | .085 | |
| Condition × SNR × Consonant × Group | 24, 456 | .372 | .997 | .019 | |
| Condition × SNR × Consonant × Age | 24, 456 | 1.396 | .102 | .068 | |
| Condition × SNR × Consonant × Group × Age | 24, 456 | .374 | .997 | .019 |
First, none of the interactions involving both consonant and group were significant, suggesting that bilingual and monolingual children's individual consonant recognition was similar regardless of condition or SNR. The main effect of consonant and some of the interactions involving consonant (consonant × age, condition × consonant, SNR × consonant, and condition × SNR × consonant) were significant, indicating that the recognition of individual consonants varied with listener age, condition, and SNR. Orthogonal comparisons on the condition × SNR × consonant interaction with Bonferroni correction revealed that recognition of some consonants did not drop significantly when simulated hearing loss was added. They are: /m/ (0 dB SNR, p = 1.000; 5 dB SNR, p = 1.000; quiet, p = .524), /v/ (0 dB SNR, p = 1.000; 5 dB SNR, p = 1.000), /n/ (0 dB SNR, p = 1.000), and /b/ (0 dB SNR, p = .268). Among these consonants, as can be seen in the 0 dB SNR panel in Figure 4, the reasons for absence of significant change due to simulated hearing loss appear different between /v m/ and /n b/. That is, even when simulated hearing loss was added, performance remained relatively high for /v m/ across all SNRs, suggesting that unlike other consonants, the addition of simulated hearing loss had little disruptive effect on the recognition of these consonants. In contrast, the possible ranges for further performance change due to simulated hearing loss for /n b/ at 0 dB SNR was severely limited by speech-shaped noise. In other words, the lack of significant change for /n b/ should not be interpreted as showing that the detrimental impact of simulated hearing loss was minimal. All other comparisons for the remaining consonants at the three SNRs were significant (p < .001 for all), indicating that simulated hearing loss had a considerable detrimental impact on the recognition of the majority of 13 consonants. As for the interactions involving age and consonant, only consonant × age interaction reached significance. However, this interaction was not analyzed any further because it does not concern the impact of the simulated hearing loss.
These results show that the detrimental impacts of speech-shaped noise and simulated hearing loss on individual consonants were consistent with the prediction based on acoustic characteristics. However, contrary to our prediction, there was little difference between bilingual and monolingual children for the recognition of individual consonants at three SNRs with and without simulated hearing loss.
Discussion
The purpose of this study was to investigate the possible impact of simulated hearing loss on English consonant recognition in 6-12 year-old, English-dominant, Spanish-English bilingual children who represent the majority of children growing up in Spanish-speaking homes in the U.S. The focus was on consonants due to their susceptibility to distortion by background noise and their relevance to speech perception for individuals with hearing loss. To minimize the influence of lexical access, vowel-consonant-vowel syllables were used as stimuli. To avoid confound between individual differences in hearing-loss configuration and linguistic experience, the possible effects of hearing loss was evaluated with listeners with normal hearing by using threshold-elevating noise simulating a mild-to-moderate sloping sensorineural hearing loss. This simulated hearing loss represented the most common hearing-loss profile in children (Pittman & Stelmachowicz 2003). To gauge the effects of language background, English-speaking monolingual age peers were included as a comparison group.
It was predicted that: (1) bilingual and monolingual children would perform similarly in quiet because of the “native/near-native” English proficiency of bilingual children in the present study; (2) for both groups of children, noise and simulated hearing loss would have detrimental impacts consistent with their acoustic characteristics (i.e., greater low-frequency than high-frequency impact for speech-shaped noise; greater high-frequency than low-frequency impact for simulated hearing loss); (3) differences between Spanish and English (phonological and order of acquisition) would have additional negative influence on bilingual children's recognition of some English consonants. Results were analyzed for percent-correct performance for average across 13 consonants and for individual consonants at each background noise level with and without simulated hearing loss.
As predicted, overall consonant recognition accuracy in quiet was similar between bilingual and monolingual children. In noise, on average, there was a small yet significant gap between the groups, but no statistically significant group difference was observed when the simulated hearing loss was introduced. In addition, when the groups were compared to evaluate the impact of background noise level in the normal-hearing condition, the group difference failed to reach statistical significance. The recognition of individual consonants did not reveal significant group difference either. Although the results did not bear out some of our predictions, there were important findings that were rather surprising. These findings are discussed below.
In contrast to the overall results, bilingual children's performance improved with age in both conditions but such an age effect for the monolingual children was observed in the simulated hearing-loss condition only. Although preliminary, this group difference in the developmental trend suggest that even though bilingual children as a group recognize consonants with similar accuracy as monolingual peers, younger children tend to fall short of their monolingual peers possibly due to their limited experience with English. This developmental trend for bilingual children also suggests that after the rapid acquisition of general English phonology, bilingual children go through gradual refinement of consonant categories over the years while little change occurs in monolingual children during the same age range. This difference in the age effect underscores the importance of considering age or experience when evaluating bilingual children's English consonant recognition in noise performance.
As for the significant age effect in the simulated hearing-loss condition, although concerned with bilingual speakers only, the reduced experience hypothesis in Schmidtke (2016) can be extended to explain the results for the monolingual children. In fact, when more challenge in listening was introduced by a two-talker masker in comparison to speech-shaped noise, younger children in the Leibold and Buss (2013) study showed greater susceptibility to phonetic properties of the masker than older children or adults, paralleling the present results for the monolingual children in the simulated hearing-loss condition.
The present study is the first to document a developmental trend in speech perception in noise performance for bilingual children. However, as previous studies with bilingual adults (Mayo et al. 1997, Rogers et al. 2006) have reported, bilingual-monolingual gap in the perception of meaningful speech in challenging listening environment may not close with increased experience. Future research using linguistically richer materials with a larger sample including adult bilingual speakers may help us understand the specific effects of reduced experience on bilingual speech perception in challenging listening environments.
The absence of an age effect for the monolingual group in the normal-hearing condition requires further discussion. Previous studies with similar design (Nishi et al. 2010, Leibold & Buss 2013) have reported that consonant recognition in noise in English-speaking monolingual children improves with age. However, this difference might be related to how the stimulus materials were prepared. Recall that the present study ensured unanimous identification of all tokens in quiet by adult listeners in addition to the quality check by study staff. In contrast, in the previous studies, authors/research assistants reviewed stimulus materials without preset criteria. Due to this extra step in stimulus creation, the tokens used in the present study may have provided more robust acoustic cues than those in the previous studies. If this is true, the present results suggest the possibility that young children could be more susceptible to variation in speech input that is “atypical,” but they are able to recognize consonants in noise as accurately as older children when intelligibility of stimulus materials in quiet is ensured. In turn, this high quality of stimulus materials might have minimized the gap between the bilingual and monolingual children also. The impact of the quality of stimulus materials on measures of speech perception development deserves further consideration.
The absence of group difference may be due to the choice of stimulus materials. Recall that both consonants and vowels used in the present study were common between Spanish and English. If linguistically richer materials with more “English-only” consonants appearing in “English-only” phonetic contexts are used, different results may be obtained. Further research exploring this issue is necessary to better understand the role of cross-language phonology in bilingual speech perception.
One may wonder why the well-documented effect of SNR was absent in the simulated hearing-loss condition. This could be due to the restricted range of possible performance change. That is, as can be seen in Figure 2, simulated hearing loss lowered average consonant recognition by 59% in quiet. In contrast, the impact of speech-shaped noise (as calculated as the difference between quiet and 0 dB SNR) was 30% in the normal-hearing condition. This suggests that the detrimental impact of simulated hearing loss supersedes that of speech-shaped noise because simulated hearing loss did not leave much room for consonant recognition to deteriorate further when speech-shaped noise was added (see Figure 2). Johnson et al. (1997) observed that the average consonant recognition in quiet for English-speaking children with minimal high-frequency hearing loss (48%) was poorer than that of normal-hearing peers (63.7%). When multi-talker babble (13 dB SNR) was added, the group difference reduced to 3.4% due to the smaller performance decline for the children with hearing loss (23.2%). Even though reverberation was present in all conditions in Johnson et al. study, these results are consistent with the present results, suggesting that the simulated hearing loss used in the present study successfully replicated the general impact of hearing loss on consonant recognition.
The results for individual consonants revealed no group difference in recognition accuracy. In addition, as expected, due to the disrupting effect of simulated hearing loss, the recognition of consonants with high-frequency spectral cues (/s t ʃ z/) dropped considerably even though they remained highly intelligible across all SNRs in the normal-hearing condition. In contrast, a few consonants (/m v/) resisted the detrimental effects of the simulated hearing loss used in the present study. The impact of simulated hearing loss did not reach significance for /b n/ at 0 dB SNR due to floor performance in the normal-hearing condition. Similar to the findings for overall performance, these findings for the recognition of individual consonants may not hold for other types of hearing loss, bilingual speakers with different proficiency or different first language, or different challenging listening conditions.
Finally, it is important to note that our hearing-loss simulation was only designed to model the effects of a single configuration of elevated threshold (mild-to-moderate sloping sensorineural hearing loss), and the present results may not generalize to other types and degrees of hearing loss or changes in auditory processing associated with hearing loss, such as reduced dynamic range and reduced spectral-temporal resolution. It should also be noted that the developmental trajectories observed in the present study may not be applicable to children with congenital hearing loss because the listeners in the present study could take advantage of age-appropriate speech and language skills. Children with congenital hearing loss have been reported to follow a phonological developmental rate and trajectory somewhat different from that of children with normal hearing (cf. Moeller et al. 2007). Similarly, due to their normal-hearing status, the participants in the present study did not have compensatory listening strategies that individuals with congenital hearing loss may develop with experience. Therefore, although the present results did not reveal a tangible difference between the effects of hearing loss in bilingual and monolingual children, interpretation of the present findings requires caution and should not be directly equated with possible outcomes of English consonant recognition by bilingual listeners with various configurations and degrees of hearing loss.
To summarize, the present study demonstrated that school-age, English dominant, Spanish-English bilingual children recognize American English consonants in the background of speech-shaped noise, on average, at a similar accuracy as English-speaking monolingual age peers. The general impact of simulated hearing loss was also similar between bilingual and monolingual children. However, the results also showed that younger bilingual children's performance can be poorer than the monolingual children's. The present results raise several issues that require further investigation. These issues include (1) the impact of actual hearing loss on bilingual children, and (2) the influence of proficiency, stimulus quality, and developmental trend on measures of speech perception.
Acknowledgments
This work has been supported by NIH grants P20 GM109023, T32 DC000013, T35 DC008757, and P30 DC004662. Its contents are solely the responsibility of the authors and do not necessarily represent the official views of the NIH. We would like to thank Judy Kopun, Mary Thomas, Marta Delgado, and Colleen Gibilisco for their assistance in recruiting subjects. Statistical consultation with Kendra Schmid is much appreciated. Michael Gorga, Lori Leibold, Walt Jesteadt, Elizabeth Peña, Prarthana Shivabasappa, and Ryan McCreery commented on earlier versions of this work.
Financial Disclosures/Conflict of Interest: This project was supported by NIH grants T35 DC008757, P20 GM109023, T32 DC000013, and P30 DC004662 awarded to Boys Town National Research Hospital. The content is solely the responsibility of the authors and does not necessarily represent the official views of the National Institutes of Health.
Footnotes
Portions of this study were presented at the American Auditory Society conference, Scottsdale, Arizona, March 5, 2015
While testing vocabulary in Spanish was part of the protocol initially, bilingual children remained quiet during the testing even though they could carry conversations and understand instructions in Spanish. Therefore, the Spanish testing was discontinued after testing a few children. The second author (native Spanish speaker) had informal conversation in Spanish with each child and noted that children had a stronger receptive than expressive language skills in Spanish.
Desloge et al. (2012) included multi-band expansion that provides level-dependent attenuation to avoid the resulting noise level becoming unbearably loud for severe threshold shift. We did not use this process because the desired threshold shifts were in the mild-to-moderate range.
The average thresholds based on all sloping hearing loss reported in Pittman & Stelmachowicz (2003) were implemented initially, but even English-speaking adults expressed frustration with this noise level. Therefore, only the data from sloping hearing loss with pure-tone averages in the mild-to-moderate hearing loss range were used to calculate the thresholds used here.
We decided to validate the effects of threshold-elevating noise at octave frequencies with adults only based on the results of previous studies on developmental changes in absolute-masked threshold difference. Schneider et al. (1989) reported that difference between absolute and simultaneous masking thresholds at 0.4, 1, 2, 4, and 10 kHz reach asymptotic levels by age 6-7 years. Similarly, Moore et al. (2011) reported that adult-child differences in thresholds did not increase when masker was added. Therefore, we concluded that the threshold-elevating noise would have similar effects on adults and 6-12 year-old children in the present study.
The majority (246 cases) of the 294 cases that the two testers did not agree on the transcription of responses were single-consonant responses. Most frequent disagreement cases include /v b z/, but these cases were resolved after the second review. The rest of the disagreement cases included multi-syllabic, vowel-only, consonant-cluster, and unintelligible responses.
Although the significance of the other effects (group, SNR) and interactions were tested in this analysis, they are not discussed here because the main purpose was to determine whether listener performance was significantly poorer in the simulated hearing-loss condition than in the normal-hearing condition.
For this analysis, when all listeners recognized a consonant perfectly, two listeners' RAU scores were arbitrarily chosen and were modified to 123.01 and 122.99, respectively, to avoid zero variance without changing the group average.
References
- American National Standards Institute [ANSI] Methods for Calculation of the Speech Intelligibility Index. New York, NY: Author; 1997. ANSI/ASA S3.5-1997. [Google Scholar]
- American Speech-Language-Hearing Association [ASHA] ASHA summary membership and affiliation counts, year-end 2015. 2016a Retrieved on July 8 2016 from: www.asha.org/uploadedFiles/2015-Member-Counts.pdf.
- American Speech-Language-Hearing Association [ASHA] Demographic profile of ASHA members providing bilingual services. 2016b Retrieved on July 6 2016 from: www.asha.org/uploadedFiles/Demographic-Profile-Bilingual-Spanish-Service-Members.pdf.
- Boothroyd A. Computer-Assisted Speech Perception Assessment (CASPA) 5.0. Software; San Diego, CA: 2008. [Google Scholar]
- Brown L, Sherbenou RJ, Johnsen SK. Test of Nonverbal Intelligence (4th ed) [TONI-4] Austin, TX: Pro-Ed; 2010. [Google Scholar]
- Cruickshanks KJ, Dhar S, Dinces E, Fifer RC, Gonzalez F, II, Heiss G, Hoffman HJ, Lee DJ, Newhoff M, Tocci L, Torre P, III, Tweed TS. Hearing impairment prevalence and associated risk factors in the Hispanic community health study/study of Latinos (HCHS/SOL) JAMA Otolaryngol Head Neck Surg. 2015;141:641–648. doi: 10.1001/jamaoto.2015.0889. [DOI] [PMC free article] [PubMed] [Google Scholar]
- Danhauer JL, Abdala C, Johnson C, Asp C. Perceptual features from normal-hearing and hearing-impaired children's errors on the NST. Ear Hear. 1986;7:318–322. doi: 10.1097/00003446-198610000-00005. [DOI] [PubMed] [Google Scholar]
- Desloge JG, Reed CM, Braida LD, Perez ZD, Delhorne LA. Auditory-Filter characteristics for listeners with real and simulated hearing impairment. Trends in Amp. 2012;16:19–39. doi: 10.1177/1084713812445510. [DOI] [PMC free article] [PubMed] [Google Scholar]
- Edwards J, Beckman ME. Some cross-linguistic evidence for modulation of implicational universals by language-specific frequency effects in phonological development. Lang Learn Dev. 2008;4:122–156. doi: 10.1080/15475440801922115. [DOI] [PMC free article] [PubMed] [Google Scholar]
- Etymōtic Research. BKB-SIN™ speech in noise test version 1.03 (compact disc) Elk Grove Village, IL: Etymōtic Research; 2005. [Google Scholar]
- García P, Rosado Rogers L, Nishi K. Testing speech recognition in Spanish-English bilingual children with the Computer-Assisted Speech Perception Assessment (CASPA): Initial Report. Ear Hear. 2016;37:492–494. doi: 10.1097/AUD.0000000000000279. [DOI] [PMC free article] [PubMed] [Google Scholar]
- Gildersleeve-Neumann CE, Kester ES, Davis BL, Peña ED. English speech sounds development in preschool-aged children from bilingual English-Spanish environments. Lang Sp Hear Serv Schls. 2008;39:314–328. doi: 10.1044/0161-1461(2008/030). [DOI] [PubMed] [Google Scholar]
- Goldman R, Fristoe M. Goldman-Fristoe test of articulation (2nd ed) Minneapolis, MN: Pearson; 2000. [Google Scholar]
- Goldstein BA, Fabiano L, Washington PS. Phonological skills in predominantly English-speaking, predominantly Spanish-speaking, and Spanish-English bilingual children. Lang Sp Hear Serv Schls. 2005;36:201–218. doi: 10.1044/0161-1461(2005/021). [DOI] [PubMed] [Google Scholar]
- Johnson CE. Childnre's phoneme identification in reverberation and noise. J Sp Lang Hear Res. 2000;43:144–157. doi: 10.1044/jslhr.4301.144. [DOI] [PubMed] [Google Scholar]
- Johnson CE, Stein RL, Broadway A, Markwalter TS. “Minimal” high-frequency hearing loss and school-age children. Lang Sp Hear Serv Schls. 1997;28:77–85. [Google Scholar]
- Kenworthy J. Teaching English Pronunciation. New York: Longman; 1987. [Google Scholar]
- Ladefoged P. A Course in Phonetics (3rd ed) Philadelphia: Harcourt Brace; 1993. [Google Scholar]
- Lee D, Gomez-Marin O, Lee H. Prevalence of childhood Hearing loss. The Hispanic health and nutrition examination survey and the national health and nutrition examination survey II. Am J Epidemiol. 1996;144:442–449. doi: 10.1093/oxfordjournals.aje.a008949. [DOI] [PubMed] [Google Scholar]
- Leibold LJ, Buss E. Children's identification of consonants in a speech-shaped noise or a two-talker masker. J Sp Lang Hear Res. 2013;56:1144–1155. doi: 10.1044/1092-4388(2012/12-0011). [DOI] [PMC free article] [PubMed] [Google Scholar]
- Mayo C, Florentine M, Buss S. Age of second language acquisition and perception of speech in noise. J Sp Lang Hear Res. 1997;40:686–693. doi: 10.1044/jslhr.4003.686. [DOI] [PubMed] [Google Scholar]
- Mayo C, Scobbie JM, Hewlett N, Waters D. The Influence of Phonemic Awareness Development on Acoustic Cue Weighting Strategies in Children's Speech Perception. J Sp Lang Hear Res. 2003;46:1184–1196. doi: 10.1044/1092-4388(2003/092). [DOI] [PubMed] [Google Scholar]
- McCarthy KM, Mahon M, Rosen S, Evans BG. Speech perception and production by sequential bilingual children: A longitudinal study of voice onset time acquisition. Child Development. 2014;85:1965–1980. doi: 10.1111/cdev.12275. [DOI] [PMC free article] [PubMed] [Google Scholar]
- Moeller MP, Hoover B, Putman C, Arbataitis K, Bohnenkamp G, Peterson B, Wood S, Lewis D, Pittman A, Stelmachowicz P. Vocalizations of infants with hearing loss compared with infants with normal hearing: Part I – Phonetic development. Ear Hear. 2007;28:605–627. doi: 10.1097/AUD.0b013e31812564ab. [DOI] [PubMed] [Google Scholar]
- Moore DR, Cowan JA, Riley A, Edmonton-Jones AM, Ferguson MA. Development of auditory processing in 6- to 11-year-old children. Ear Hear. 2011;32:269–285. doi: 10.1097/AUD.0b013e318201c468. [DOI] [PubMed] [Google Scholar]
- Nash SD, Cruickshanks KJ, Klein R, Klein BE, Nieto FJ, Huang GH, Pankow JS, Tweed TS. The prevalence of hearing impairment and associated risk factors: the Beaver Dam offspring study. Arch Otolaryngol Head Neck Surg. 2011;137:432–439. doi: 10.1001/archoto.2011.15. [DOI] [PMC free article] [PubMed] [Google Scholar]
- National Center for Education Statistics [NCES] Children 3 to 21 years old served under Individuals with Disabilities Education Act (IDEA), Part B, by race/ethnicity and age group: 2000–01 through 2011–12. 2013 Retrieved November 25, 2015 from https://nces.ed.gov/programs/digest/d13/tables/dt13_204.40.asp.
- National Center for Education Statistics [NCES] Children 3 to 21 years old served under Individuals with Disabilities Education Act (IDEA), Part B, by type of disability: Selected years, 1976-77 through 2012-13. 2014 Retrieved November 25, 2015 from https://nces.ed.gov/programs/digest/d14/tables/dt14_204.30.asp.
- Neuman A, Hochberg I. Children's perception of noise in reverberation. J Acoust Soc Am. 1983;73:2145–2149. doi: 10.1121/1.389538. [DOI] [PubMed] [Google Scholar]
- Nishi K, Lewis DE, Hoover BM, Choi S, Stelmachowicz PG. Children's recognition of American English consonants in noise. J Acoust Soc Am. 2010;127:3177–3188. doi: 10.1121/1.3377080. [DOI] [PMC free article] [PubMed] [Google Scholar]
- Nittrouer S. Learning to perceive speech: How fricative perception changes, and how it stays the same. J Acoust Soc Am. 2002;112:711–719. doi: 10.1121/1.1496082. [DOI] [PMC free article] [PubMed] [Google Scholar]
- Pape L, Kennedy K, Kaf W, Zahirsha Z. Immigration within the United States: Prevalence of childhood hearing loss revisited. Am J Audiol. 2014;23:238–241. doi: 10.1044/2014_AJA-13-0058. [DOI] [PubMed] [Google Scholar]
- Pittman AL, Stelmachowicz PG. Hearing loss in children and adults: Audiometric characteristics, asymmetry and progression. Ear Hear. 2003;3:198–205. doi: 10.1097/01.AUD.0000069226.22983.80. [DOI] [PMC free article] [PubMed] [Google Scholar]
- Rogers CL, Lister JJ, Febo DM, Besing JM, Abrams HB. Effects of bilingualism, noise, and reverberation on speech perception by listeners with normal hearing. Applied Linguistics. 2006;27:465–485. [Google Scholar]
- Sander E. When are speech sounds learned? J Sp Lang Hear Res. 1972;37:55–63. doi: 10.1044/jshd.3701.55. [DOI] [PubMed] [Google Scholar]
- Schmidtke J. The bilingual disadvantage in speech understanding in noise is likely a frequency effect related to reduced language exposure. Frontiers Psych. 2016;7:1–15. doi: 10.3389/fpsyg.2016.00678. [DOI] [PMC free article] [PubMed] [Google Scholar]
- Schneider BA, Trehub SE, Morrongiello BA, Thorpe LA. Developmental changes in masked thresholds. J Acoust Soc Am. 1989;86:1733–1742. doi: 10.1121/1.398604. [DOI] [PubMed] [Google Scholar]
- Shriberg L. Four new speech and voice-prosody measures for genetic research and other studies in developmental phonological disorders. J Sp Lang Hear Res. 1993;36:105–140. doi: 10.1044/jshr.3601.105. [DOI] [PubMed] [Google Scholar]
- Stevens KN. Acoustic Phonetics. Cambridge, MA: MIT Press; 1998. [Google Scholar]
- Studebaker GA. A ‘rationalized’ arcsine transform. J Sp Hear Res. 1985;28:455–462. doi: 10.1044/jshr.2803.455. [DOI] [PubMed] [Google Scholar]
- Underbakke M, Polka L, Gottfried TL, Strange W. Trading relations in the perception of /r/–/l/ by Japanese learners of English. J Acoust Soc Am. 1988;84:90–100. doi: 10.1121/1.396878. [DOI] [PubMed] [Google Scholar]
- U.S. Census Bureau. Language Use in the United States: 2011. 2013 Retrieved July 5, 2016, from https://www.census.gov/prod/2013pubs/acs-22.pdf.
- Whitley S. Spanish/English contrasts: A course in Spanish Linguistics. Washington, DC: George Town University Press; 2002. [Google Scholar]
- Williams KT. Expressive vocabulary test (2 ed) San Antonio, TX: Pearson; 2007. [Google Scholar]