

Abstract
High CD44 expression is associated with enhanced malignant potential in esophageal squamous cell carcinoma (ESCC), amongst the deadliest of all human carcinomas. Although alterations in autophagy and CD44 expression are associated with poor patient outcomes in various cancer types, the relationship between autophagy and cells with high CD44 expression remains incompletely understood. In transformed esophageal keratinocytes, CD44Low-CD24High (CD44L) cells give rise to CD44High-CD24−/Low (CD44H) cells via epithelial-mesenchymal transition (EMT) in response to transforming growth factor (TGF)-β. We couple patient samples and xenotransplantation studies with this tractable in vitro system of CD44L to CD44H cell conversion to investigate the functional role of autophagy in generation of cells with high CD44 expression. We report that high expression of the autophagy marker cleaved LC3 expression correlates with poor clinical outcome in ESCC. In ESCC xenograft tumors, pharmacological autophagy inhibition with chloroquine derivatives depletes cells with high CD44 expression while promoting oxidative stress. Autophagic flux impairment during EMT-mediated CD44L to CD44H cell conversion in vitro induces mitochondrial dysfunction, oxidative stress and cell death. During CD44H cell generation, transformed keratinocytes display evidence of mitophagy, including mitochondrial fragmentation, decreased mitochondrial content and mitochondrial translocation of Parkin, essential in mitophagy. RNA interference-mediated Parkin depletion attenuates CD44H cell generation. These data suggest that autophagy facilitates EMT-mediated CD44H generation via modulation of redox homeostasis and Parkin-dependent mitochondrial clearance. This is the first report to implicate mitophagy in regulation of tumor cells with high CD44 expression, representing a potential novel therapeutic avenue in cancers where EMT and CD44H cells have been implicated, including ESCC.
Keywords: Autophagy, mitophagy, CD44, epithelial-mesenchymal transition, oxidative stress, reactive oxygen species, transforming growth factor-β, esophageal squamous cell carcinoma, Parkin
Introduction
Tumor cells with high CD44 expression have been linked to poor patient outcomes in human cancer4, 43, 64 Enhanced self-renewal, tumor-initiating capacity and chemoresistance have been attributed to subsets of cancer cells with high CD44 expression in esophageal squamous cell carcinoma (ESCC),63 among the deadliest of human cancers. Epithelial-mesenchymal transition (EMT) may promote conversion of a subset of cancer cells defined by low CD44 expression to those with high CD44 expression.30, 36 We have shown previously that transformed esophageal and oral epithelial cells (keratinocytes) are comprised of CD44Low-CD24High (CD44L) and CD44High-CD24−/Low (CD44H) subpopulations possessing epithelial and mesenchymal properties, respectively.22 In this system, purified CD44L subpopulations display robust EMT-mediated conversion to a CD44H phenotype in response to transforming growth factor (TGF)-β.22 EMT has been documented at invasive fronts of human ESCC lesions53, 54, 62, where it is posited to facilitate tumor cell invasion, metastasis and treatment resistance.
Autophagy (macroautophagy) is a catabolic process through which cellular constituents are sequestered by autophagic vesicles (AVs) then delivered to lysosomes for hydrolytic degradation. In murine models, genetic autophagy impairment enhances tumor formation.31, 44, 61 The tumor suppressive nature of autophagy has been attributed to various mechanisms, including maintenance of genomic integrity.20, 33, 34, 50 Paradoxically, tumor cells may co-opt autophagy to cope with oncogenic, microenvironmental and therapeutic stress, thereby promoting disease progression.21 In ESCC pharmacological autophagy inhibition augments therapeutic sensitivity in vitro and in vivo,7, 59 presenting autophagy modulation as an attractive therapeutic strategy in ESCC, a disease characterized by poor prognosis, metastasis and therapeutic resistance.11, 24
Mitophagy is a selective form of autophagy through which dysfunctional mitochondria are removed from cells. Mitophagy relies upon AV formation via the activity of autophagy-related (ATG) proteins, including Microtubule-associated Protein 1 Light Chain 3 (LC3; ATG8) and Beclin1 (ATG6); however, specific mediators of mitophagy, including the E3 ubiquitin ligase Parkin (PARK2 gene product), have been identified.37 As mitochondria are the primary source of cellular reactive oxygen species (ROS), mitophagy-mediated clearance of dysfunctional mitochondria is necessary to prevent deleterious effects associated with ROS accumulation, including cell death, senescence and malignant transformation.
Here, we investigate the functional role of autophagy in generation of ESCC cells with high CD44 expression utilizing ESCC patient samples, in vivo xenotransplantation studies and an in vitro system of EMT-mediated CD44L to CD44H cell conversion. We find that autophagy activation is linked to poor prognosis in ESCC patients and supports EMT-mediated CD44H generation via modulation of oxidative stress and Parkin-dependent mitochondrial clearance. As cells with high CD44 expression are associated with cancer progression, these studies may facilitate development of novel therapeutic approaches.
Results
Cleaved LC3 expression correlates with poor clinical outcomes in ESCC
AV formation involves LC3 cleavage. We first evaluated cleaved LC3 by immunohistochemistry (IHC) in ESCC tissue microarrays representing patients who had undergone esophagectomy without prior neoadjuvant chemotherapy or radiation therapy. High cleaved LC3 expression was detected in 43 of 129 informative cases (Figure 1A) and was associated with reduced cause-specific postsurgical survival (Figure 1B). Further review of clinicopathological data revealed that high cleaved LC3 correlated significantly with lymphatic and vascular involvement, lymph node and distant metastases, and advanced disease stage (Table 1).
Figure 1. High cleaved LC3 expression correlates with poor prognosis in ESCC patients.
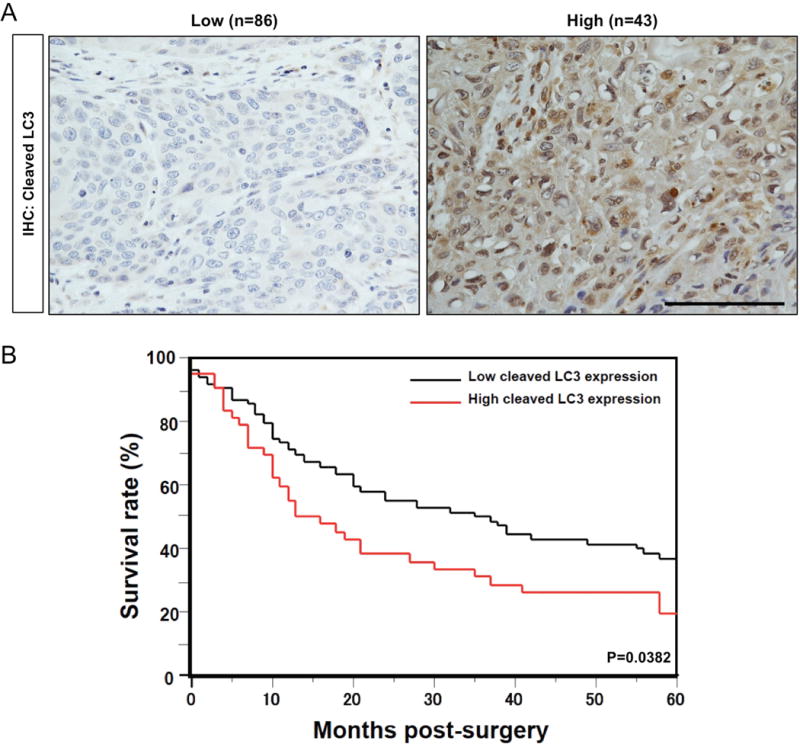
(A) Representative IHC images of cases from primary ESCC tissues on tissue microarrays classified as having low or high cleaved LC3 expression. Scale bar, 50 μm. (B) High cleaved LC3 expression predicts a poor 5-year survival rate. Overall survival curves were plotted according to the Kaplan-Meier method and p value was calculated using log rank test.
Table 1.
Relationship between cleaved LC3 expression and clinicopathological characteristics of ESCC patients
| Cleaved LC3 Expression, n (%) | ||||
|---|---|---|---|---|
|
| ||||
| Factors | Total | Low 86 (66.6) | High 43 (33.3) | p |
| Gender | ||||
| Male | 114 | 78 (68.4) | 36 (31.6) | 0.244 |
| Female | 15 | 10 (53.2) | 7 (46.7) | |
|
| ||||
| Histology | ||||
| Well | 51 | 37 (72.6) | 14 (27.4) | 0.512 |
| Moderate | 56 | 35 (62.5) | 21 (37.5) | |
| Poor | 22 | 14 (63.6) | 8 (36.4) | |
|
| ||||
| pT | ||||
| T1, T2 | 50 | 38 (76) | 12 (24) | 0.07 |
| T3, T4 | 79 | 48 (68.8) | 31 (39.2) | |
|
| ||||
| pN | ||||
| N0 | 47 | 30 (80.9) | 9 (19.1) | 0.0008 |
| N1 | 82 | 48 (58.5) | 34 (41.5) | |
|
| ||||
| pM | ||||
| M0 | 88 | 66 (75) | 22 (25) | 0.003 |
| M1 | 41 | 20 (48.4) | 21 (51.2) | |
|
| ||||
| p-Stage | ||||
| I, II | 57 | 44 (77.2) | 13 (22.8) | 0.023 |
| III, IV | 72 | 42 (58.3) | 30 (41.7) | |
|
| ||||
| Lymphatic Involvement | ||||
| Negative | 42 | 35 (83.3) | 7 (16.7) | 0.004 |
| Positive | 87 | 51 (58.6) | 36 (41.4) | |
|
| ||||
| Vascular Involvement | ||||
| Negative | 87 | 66 (77) | 20 (23) | 0.0003 |
| Positive | 42 | 19 (45.2) | 23 (54.8) | |
In vivo autophagy inhibition depletes ESCC cells with high CD44 expression
To investigate the functional role of autophagy in ESCC, we treated immunocompromised mice bearing tumors generated by the ESCC patient-derived cell line TE11 with hydroxychloroquine (HCQ) or Lys05 (Supplementary Figure S1A), two chloroquine (CQ) derivatives that inhibit autophagy by blocking AV-lysosome fusion.2, 35 Both agents efficiently promoted AV accumulation as evidenced by increased levels of the cleaved and further lipidated form of LC3, designated LC3-II, and the autophagy cargo-identifying protein p62 (Supplementary Figure S1B). Transmission electron microscopy (TEM) corroborated enhanced AV content in tumors from HCQ-treated animals (Supplementary Figure S2A). Although neither agent significantly impacted TE11 tumor volume (Supplementary Figure S1C), tumors from Lys05-treated animals displayed a trend toward decreased volume and evidence of involution at a frequency of 50% as compared to 16.7% in vehicle-treated animals (Supplementary Table S1 and Supplementary Figure S1D). Additionally, 87.5% of tumors from HCQ-treated animals displayed cystic changes, as compared to 33.3% of tumors from vehicle-treated animals (Supplementary Table S1 and Supplementary Figure S1D). As these findings suggest that autophagy inhibition is associated with less aggressive tumor phenotypes, we suspected that HCQ and Lys05 impacted cells with high CD44 expression and enhanced malignant potential in the context of ESCC. Indeed, HCQ or Lys05 decreased intratumoral content of ESCC cells with high CD44 expression (Figure 2A, B) as well as those with EMT characteristics (Figure 2C). Interestingly, autophagy inhibition in vitro efficiently attenuated TGF-β-mediated expansion of TE11 cells with high CD44 expression while only exerting a minimal impact in the absence of TGF-β (Supplementary Figure S3A, B), suggesting that autophagy may regulate generation of tumor cells with high expression of CD44 in response to microenvironmental cues, such as TGF-β.
Figure 2. Effects of autophagy inhibition on ESCC tumors in vivo.
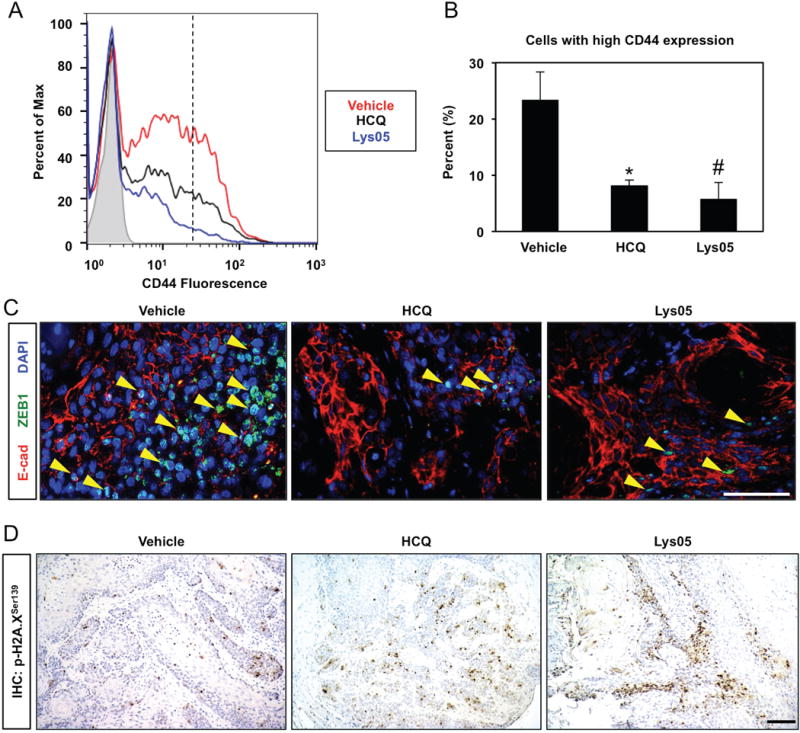
Immunocompromised mice bearing established TE11 xenograft tumors (~75 mm3) were treated with HCQ (60 mg/kg), Lys05 (20 mg/kg) or vehicle control via i.p. injection according to a 3 days on/2 days off schedule for 2 weeks. (A, B) Dissociated tumor cells were assessed for CD44 expression with flow cytometry plot of representative samples (in A). Note cells with high CD44 expression are present to the right of the hatched line. Bar diagram (mean ± sem) representing average percentage of cells with high CD44 expression in tumors from mice treated with vehicle (n=8), HCQ (n=8) or Lys05 (n=7) is shown (in B). *, p<0.005 vs. vehicle; #, p<0.001 vs. vehicle; ANOVA with Tukey’s post-hoc test. (C) Co-immunofluorescence for E-cadherin (E-cad) and ZEB1 identified EMT cells (indicated by arrowheads) in tumor sections. Nuclei were visualized with DAPI. (D) Tumor sections were stained for p-H2A.XSer139 via IHC to assess oxidative stress. At least 4 tumors were evaluated (in C and D) with representative images shown. Scale bars, 100 μm.
As autophagy is a well-established mechanism to modulate oxidative stress and our previous findings highlight the importance of redox balance in regulating populations with differential CD44 expression in transformed esophageal keratinocytes,22, 40 we evaluated the influence of autophagy inhibition upon ROS. Both HCQ and Lys05 enhanced expression of Histone H2A.X phosphorylated at Serine 139 (p-H2A.XSer139), a surrogate marker for oxidative stress (Figure 2D). Additionally, multilamellar structures consistent with mitochondria were identified within intratumoral AVs of HCQ-treated mice (Supplementary Figure S2B). Thus, we hypothesized that autophagy regulates cellular redox balance and mitochondrial dynamics during expansion of cells with high CD44 expression.
AV accumulation accompanies EMT-mediated CD44H cell generation
To interrogate the role of autophagy in generation of cells with high CD44 expression, we utilized the well-characterized genetically engineered human esophageal epithelial cell line EPC2-hTERT-EGFR-p53R175H-CyclinD1 (EPC2T). This cell line is well-suited for such studies as it (i) is comprised of discreet CD44L and CD44H subpopulations;22 (ii) following purification by fluorescence activated cell sorting (FACS), CD44L EPC2T cells display limited spontaneous CD44L to CD44H cell conversion;22 and (iii) purified CD44L subpopulations displaying epithelial characteristics undergo robust EMT-mediated conversion to a mesenchymal CD44H phenotype in response to TGF-β.22 Microarray analysis in TGF-β-treated EPC2T cells (GSE37994) revealed significant enrichment of EMT-associated pathways, including response to wound healing, cell motility and cell migration, concurrent with suppression of cell differentiation-associated pathways (Supplementary Figure S4). The mesenchymal nature of CD44H cells was further confirmed upon epithelial reconstitution studies in 3-dimensional (3D) organotypic culture (OTC) where CD44H cells exhibited invasion and robust α-smooth muscle actin expression (αSMA)(Supplementary Figure S5A). ZEB1 upregulation of and E-cadherin loss corroborated EMT in CD44H cells (Supplementary Figure S5A). Purified CD44H cells also displayed properties consistent with enhanced malignant potential, including colony formation capability and resistance to 5-fluorouracil (5FU) and cisplatin (CDDP) (Supplementary Figure S5B, C), as well as expression of genes associated with stemness, including WNT5A, BMI1 and KLF4 (Supplementary Figure S5D).
CD44 isoform switching as a result of alternative splicing has been described during EMT.5 Utilizing a pan-CD44 antibody for immunoblotting studies we found that FACS-purified CD44L cells express low level of CD44 that is largely attributed to the presence of high molecular weight protein species (>130 kDa), consistent with CD44 variant isoforms (CD44v)32 (Supplementary Figure S6A). By contrast, FACS-purified CD44H cells exhibited robust CD44 expression with a predominate band of 90 kDa, consistent with the standard isoform of CD44 (CD44s)32 (Supplementary Figure S6A). A shift from CD44v to CD44s was also apparent in unsorted EPC2T cells responding to TGF-β (Supplementary Figure S6A). Upregulation of total CD44 and CD44s concomitant with downregulation of CD44v2-10 and CD44v3-10 was also detected at the mRNA level in purified CD44H cells (Supplementary Figure S6B). Gene expression analysis (GSE37993) further indicated downregulation of epithelial splicing regulatory protein (ESRP)1 (−29.0-fold vs. CD44L; p<0.001) and ESRP2 (−5.4-fold vs. CD44L; p<0.001), which regulate alternative splicing of CD44 mRNA55, in purified CD44H cells. As CD44v6 expression has been implicated in ESCC,39, 49, 57 we continued to examine its expression in the context of keratinocyte EMT. Indeed, both CD44H cells (Supplementary Figure S6C–E) and TGF-β-treated CD44L (Supplementary Figure S7) cells displayed decreased cell surface CD44v6 protein expression. Taken together, these findings indicate that CD44 isoform switching accompanies EMT in esophageal keratinocytes.
Purified EPC2T CD44L cells treated with TGF-β underwent robust CD44H cell conversion as a function of time (Figure 3A, B) concomitant with EMT (Figure 3C). Enhanced LC3-II expression and accumulation of the AV-identifying dye Cyto-ID in TGF-β-treated CD44L EPC2T cells (Figure 3C–E) indicated AV accumulation during CD44H cell generation which was corroborated utilizing TEM, the gold standard for documenting autophagy,25 (Figure 4A, B). Enhanced AV content during CD44H cell expansion was corroborated in the transformed oral keratinocyte cell line OKF6-hTERT-EGFR-p53R175H (OKF6T) (Supplementary Figure S8A–C).
Figure 3. TGF-β promotes AV accumulation concurrent with EMT-mediated CD44L to CD44H cell conversion in transformed esophageal keratinocytes.
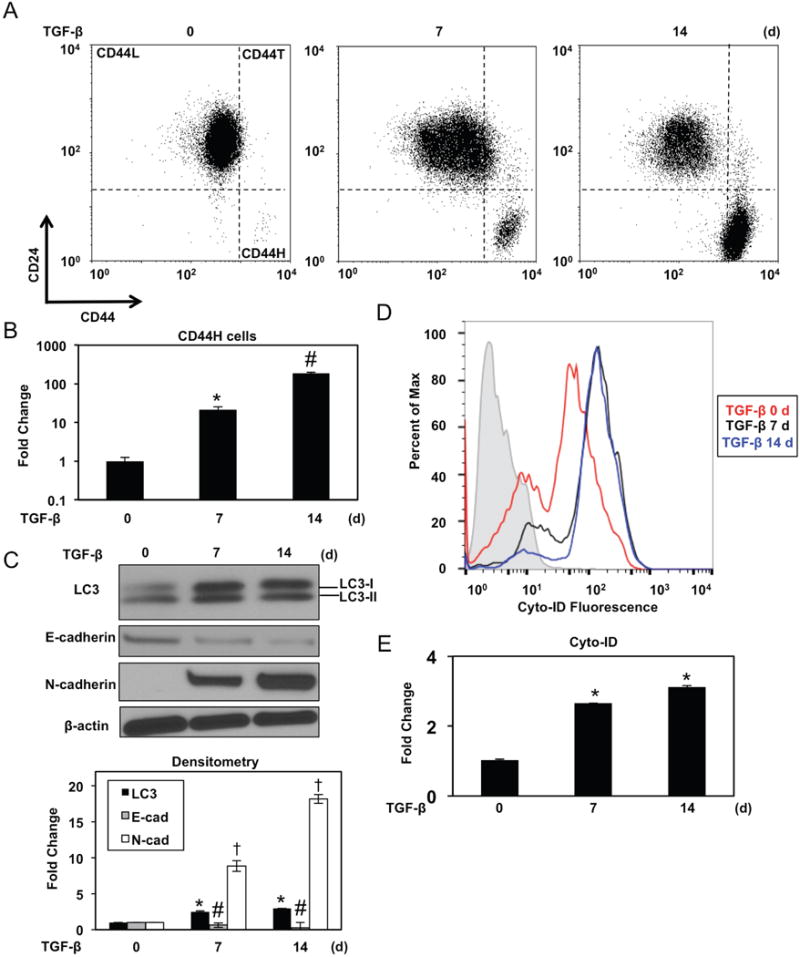
FACS-purified CD44L EPC2T cells were cultured with TGF-β (5 ng/ml) for indicated time periods. (A, B) Cells were analyzed for expression of CD24 and CD44 by flow cytometry to determine CD44H cells with representative dot plots (in A) and fold change (in B) shown. *, p<0.0001 vs. TGF-β at day 0 ; #, p<0.0001 vs. TGF-β at day 7; (n=3); (C) Immunoblot analysis determined expression of indicated proteins. β-actin was used as a loading control. Densitometry determined level of indicated proteins relative to β-actin as shown in bar diagram (mean ± sem) at bottom. *, p<0.05 vs. TGF-β 0 d for LC3; #, p<0.01 vs. TGF-β 0 d for E-cadherin. †, p<0.0001 vs. TGF-β 0 d for N-cadherin; (n=3). (D, E) Flow cytometry determined Cyto-ID with representative histogram plot for each condition (in D) and relative Cyto-ID levels (average geometric mean ± sem) (in E) shown. *, p<0.0001 vs. TGF-β at day 0. ANOVA with Tukey’s post-hoc test was used to determine p values (in B, C and E).
Figure 4. Evaluation of AVs by TEM.
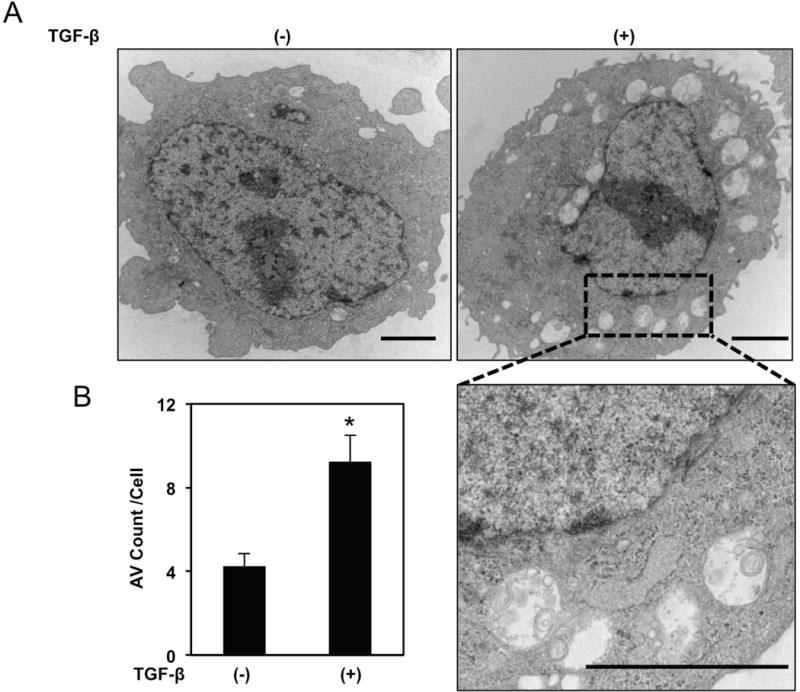
FACS-purified CD44L EPC2T cells were cultured with or without TGF-β (5 ng/ml) for 7 days then subjected to TEM analysis. (A) Representative micrographs. Area noted by hatched black box is shown at higher magnification in lower panel. Scale bars, 2 μm. (B) Bar diagram (mean± sem) representing average AV count/cell. *, p<0.05 vs. TGF-β (−); two-tailed Student’s t-test; (n=3).
TGF-β treatment in transformed esophageal and oral keratinocytes generates a heterogeneous cell population comprising CD44L and CD44H cells as well as a minor fraction of CD24High-CD44High (CD44T) transitioning cells (Figure 3A; Supplementary Figure S8A).22 In unsorted cells, Cyto-ID fluorescence was lowest in CD44L cells and highest in CD44H cells with CD44T cells displaying an intermediate level (Figure 5A; Supplementary Figure S9). FACS-purified CD44H EPC2T cells displayed enhanced LC3 expression as compared to their CD44L counterparts in both monolayer culture and 3D OTC (Figure 5B; Supplementary Figure S5A). Upon stimulation with TGF-β for 7 days, all subpopulations displayed increased Cyto-ID fluorescence (Figure 5A; Supplementary Figure S9), indicating that all subpopulations contribute to increased AV content observed during EMT. A time course study revealed that purified EPC2T CD44L cells displayed LC3-II induction 24 hours following TGF-β stimulation (Figure 5C), indicating that AV accumulation is an early event in keratinocyte EMT. Further LC3-II upregulation was detected after 5 days of TGF-β stimulation and maintained throughout 15 days of treatment (Figure 5C). Taken together, these findings indicate that AV content is increased in transformed keratinocytes undergoing EMT-mediated CD44H cell generation and is maintained in established CD44H cells.
Figure 5. AV content is upregulated during TGF-β-mediated CD44L to CD44H cell conversion and remains increased in established CD44H cells.
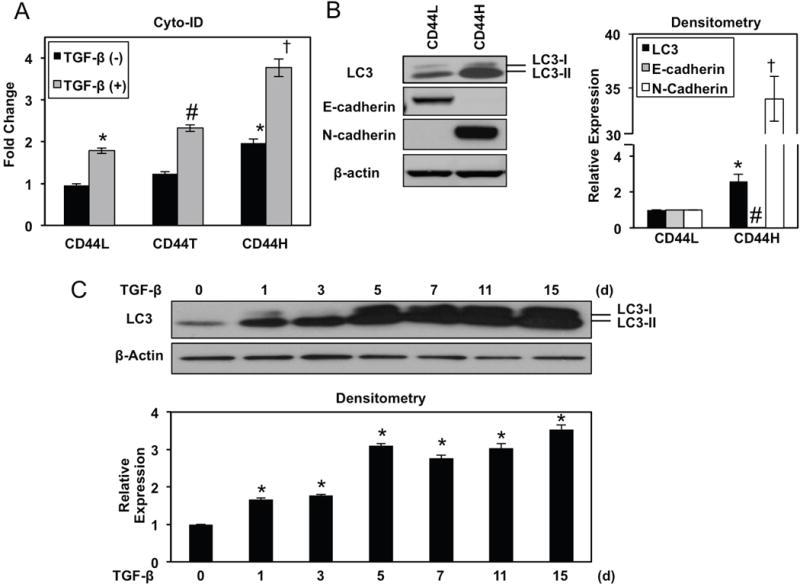
(A) EPC2T cells were cultured with or without TGF-β (5 ng/ml) for 7 days. Cells were analyzed for CD24, CD44 and Cyto-ID by flow cytometry. Bar diagram shows relative Cyto-ID levels for each population (average geometric mean ± sem). *, p<0.05 vs. CD44L TGF-β (−); #, p<0.05 vs. CD44T TGF-β (−). †, p<0.05 vs. CD44H TGF-β (−); ANOVA with Tukey’s post hoc test; (n=3); (B) Early passage FACS-purified CD44L and CD44H EPC2T cells were evaluated for expression of indicated proteins via immunoblot analysis with β-actin as a loading control. Densitometry determined level of indicated proteins relative to β-actin as shown in bar diagram (mean ± sem). *, p<0.05 vs. CD44L for LC3; #, p<0.001 vs. CD44L for E-cadherin. †, p<0.0001 vs. CD44L for N-cadherin; two-tailed Student’ s t-test; (n=3). (C) EPC2T cells were cultured in the presence of TGF-β (5 ng/ml) for indicated number of days. Immunoblot analysis determined expression of indicated proteins. β-actin was used as a loading control. Densitometry determined LC3 level relative to β-actin as shown in bar diagram (mean ± sem). *, p<0.005 vs. TGF-β 0 d; ANOVA with Dunnett’s post hoc test.; (n=3).
Autophagic flux is activated as a cytoprotective mechanism during CD44H cell generation
Increased AV content may be reflective of enhanced autophagic flux or a defect in AV clearance. To distinguish between these possibilities, we carried out autophagic flux assays utilizing CQ at a concentration of 1 μg/ml, the dose at which AV accumulation was maximal in EPC2T cells without significant induction of apoptosis (Supplementary Figure S10A, B). In purified CD44L EPC2T cells, AV accumulation was detected by Cyto-ID flow cytometry and LC3-II protein expression upon treatment with TGF-β or CQ, with further upregulation upon co-treatment (Figure 6A, B), This suggests enhanced autophagy flux in keratinocytes undergoing TGF-β-mediated EMT, a finding that was corroborated in OKF6T cells (Supplementary Figure S11A).
Figure 6. Autophagy flux is activated during and required for EMT-mediated CD44H cell expansion.
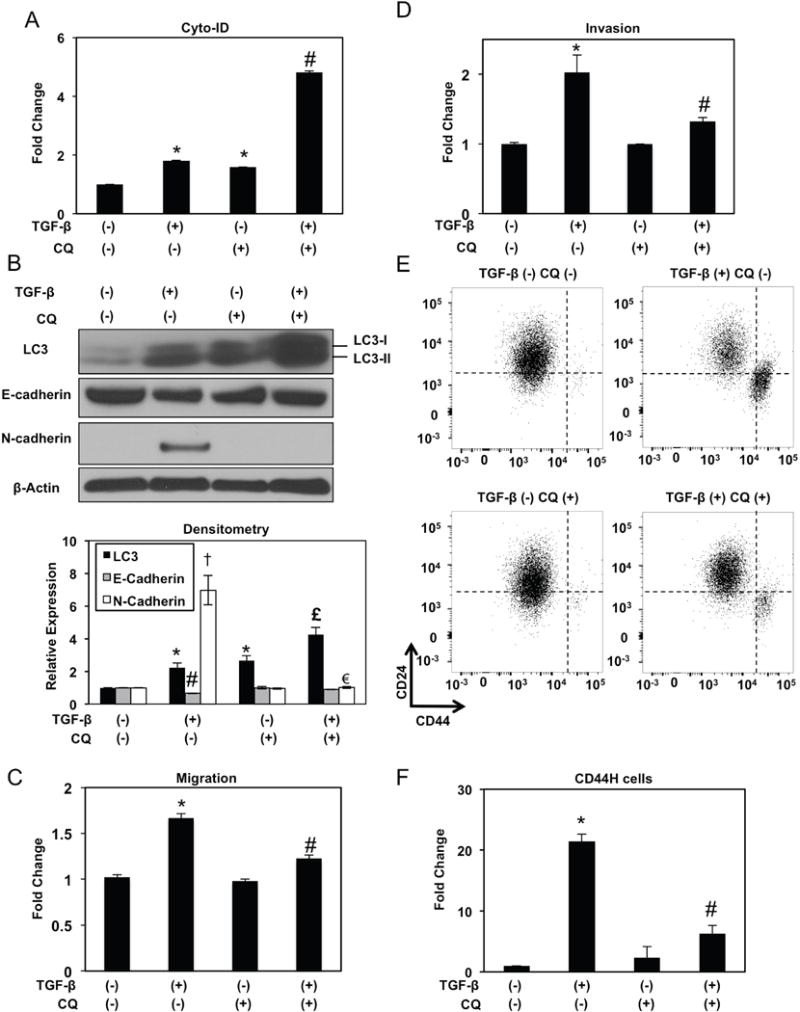
EPC2T cells were cultured in the presence or absence of TGF-β (5 ng/ml) and/or CQ (1 μg/ml) as indicated for 7 days. (A) Flow cytometry determined Cyto-ID with relative levels (average geometric mean ± sem) shown. *, p<0.05 vs. TGF-β (−) CQ (−); #, p<0.05 vs. TGF-β (+) CQ (−) and TGF-β (−) CQ (+). (B) Immunoblot analysis determined expression of indicated proteins. β-actin was used as a loading control. Densitometry determined level of indicated proteins relative to β-actin as shown in bar diagram (mean ± sem). *, p<0.05 vs. TGF-β (−) CQ (−) for LC3; #, p<0.05 vs. TGF-β (−) CQ (−) for E-cadherin. †, p<0.0001 vs. TGF-β (−) CQ (−) for N-cadherin; £, p<0.05 vs. TGF-β (+) CQ (−) and TGF-β (−) CQ (+) for LC3; €, p<0.0001 vs. TGF-β (+) CQ (−) for N-cadherin; (n=3). (C, D) Boyden chambers determined migration (in C) and invasion (in D) with fold change shown in bar diagrams (mean ± sem). *, p<0.05 vs. TGF-β (−) CQ (−); #, p<0.05 vs. TGF-β (+) CQ (−); (n=3). (E, F) Cells were analyzed for expression of CD24 and CD44 by flow cytometry to determine CD44H cells with representative dot plot (in C) and relative fold change shown in bar diagram (mean ± sem) (in D). Note presence of CD44H cells in lower right quadrant. *, p<0.05 vs. TGF-β (−) CQ (−); #, p<0.05 vs. TGF-β (+) CQ (−) and TGF-β (−) CQ (+); (n=3). ANOVA with Tukey’s post-hoc test was used to determine all p values.
In TGF-β-treated EPC2T CD44L cells, CQ suppressed E-cadherin downregulation and abrogated N-cadherin induction (Figure 6B) while also limiting TGF-β-mediated migration and invasion (Figure 6C, D). Moreover, TGF-β-mediated CD44H cell expansion was significantly attenuated in the presence of CQ in both EPC2T and OKF6T cells (Figure 6E, F; Supplementary Figure S11B), indicating that autophagic flux is required for EMT-mediated CD44L to CD44H cell conversion in esophageal and oral keratinocytes. As single agents, neither TGF-β nor CQ impacted cell viability in EPC2T cells (Figure 7A); however, upon co-treatment viability was impaired (Figure 7A) concomitant with enhanced apoptosis (Figure 7B). In light of our in vivo studies indicating enhanced oxidative stress in response to autophagy inhibition (Figure 2D), we hypothesized that cell death in keratinocytes with impaired autophagy may be associated with oxidative stress. We utilized 7′-dichlorodihydrofluorescein diacetate (DCF) to measure ROS in vitro as we have previously demonstrated that the antioxidant compound N-acetylcysteine was sufficient to suppress basal ROS in EPC2T cells,22 confirming the specificity of DCF as metric for ROS. While CD44L EPC2T cells treated with TGF-β or CQ alone displayed ROS induction, further ROS accumulation was detected upon co-treatment (Figure 7C, D). OKF6T cells also displayed enhanced cell death and ROS upon co-treatment with TGF-β and CQ (Supplementary Figure S12A, B). Thus, autophagy may serve as a cytoprotective mechanism against oxidative stress during EMT-mediated CD44L to CD44H cell conversion.
Figure 7. Pharmacological impairment of autophagy flux during EMT promotes cell death and oxidative stress.
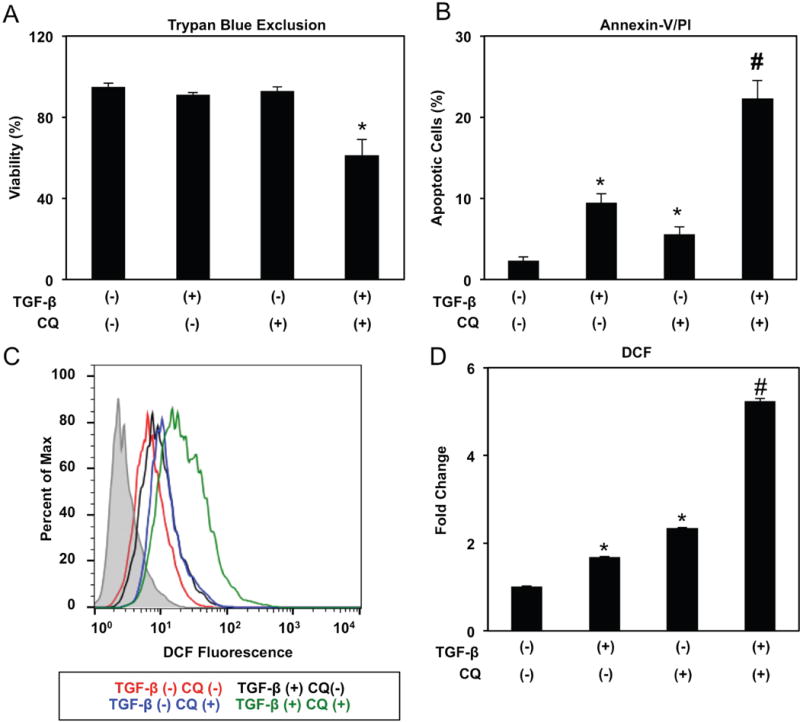
EPC2T cells were cultured in the presence or absence of TGF-β (5 ng/ml) and/or CQ (1 μg/ml) for 14 days. (A) Trypan blue exclusion assessed cell viability as shown in bar diagram (mean ± sem) representing data from three independent experiments. *, p<0.05 vs. TGF-β (−) CQ (−), p<0.05 vs. TGF-β (+) CQ (−), and TGF-β (−) CQ (+); (n=3). (B) Flow cytometry for Annexin-V/PI determined apoptosis with bar diagram (mean ± sem) depicting average percentage of early (Annexin-V-positive PI-negative) and late (Annexin-V-positive PI-positive) apoptotic cells shown. *, p<0.05 vs. TGF-β (−) CQ (−); #, p<0.05 vs. TGF-β (+) CQ (−) and TGF-β (−) CQ (+); (n=3). (C, D) Reactive oxygen species were evaluated by DCF flow cytometry with representative histogram plot for each condition (in C) and relative fluorescence levels (average geometric mean ± sem) (in D) shown. *, p<0.05 vs. TGF-β (−) CQ (−); #, p<0.01 vs. TGF-β (+) CQ (−) and TGF-β (−) CQ (+); (n=3). ANOVA with Tukey’s post-hoc test was used to determine p values (in A, B and D).
Mitophagy is required for EMT-mediated CD44H cell generation
Further evaluation of EPC2T cells co-treated with TGF-β and CQ revealed accumulation of mitochondrial superoxide (O2−) (Figure 8A, B) and accumulation of mitochondria with diminished membrane potential (Figure 8C). Moreover, upon TGF-β treatment, CD44L EPC2T cells displayed small, fragmented mitochondria lacking intact cristae (Figure 9A). As mitochondrial fragmentation is a prerequisite for mitophagy, we evaluated co-localization of Parkin and the mitochondrial outer membrane protein TOM20 and found that Parkin translocation to mitochondria was augmented in CD44L EPC2T cells stimulated with TGF-β for 7 days as compared to controls (Figure 9B, C). Mitochondrial DNA (mtDNA) level was also depleted in TGF-β-treated EPC2T cells (Figure 9D) and remained decreased in purified CD44H cells (Supplementary Figure S13). A requirement for mitophagy in CD44H cell generation was evident as genetic depletion of PARK2 suppressed TGF-β-mediated CD44H cell expansion to level comparable to that seen with inhibition of BECN1 (Figure 9E; Supplementary Figure S14). Parkin depletion in TGF-β-treated EPC2T cells further resulted in elevation of mitochondrial superoxide (O2−) and accumulation of mitochondria with diminished membrane potential (Figure 9F, G).
Figure 8. Mitochondrial ROS production and depolarization are induced in autophagy-impaired cells undergoing EMT.
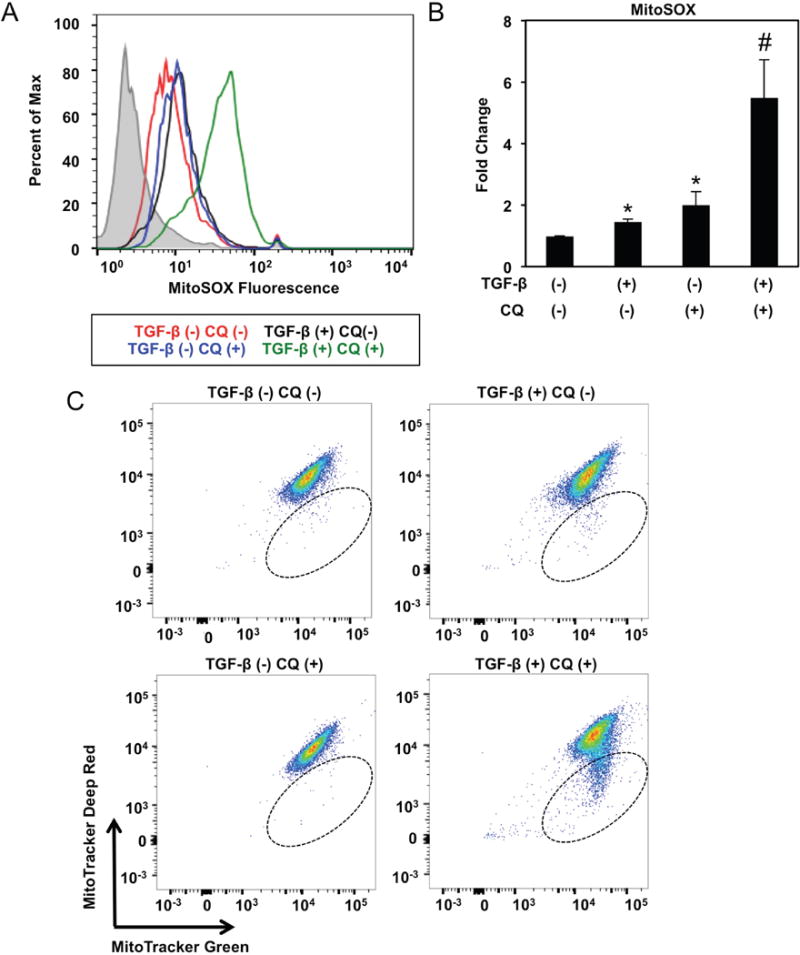
EPC2T cells were cultured in the presence or absence of TGF-β (5 ng/ml) and/or CQ (1 μg/ml) for 14 days. (A, B) Mitochondrial O2− was evaluated by flow cytometry for MitoSOX with representative histogram plot for each condition (in A) and relative fluorescence levels (average geometric mean ± sem) (in B) shown. *, p<0.05 vs. TGF-β (−) CQ (−); #, p<0.05 vs. TGF-β (+) CQ (−) and TGF-β (−) CQ (+); ANOVA with Tukey’s post-hoc test; (n=3). (C) Cells were stained with MitoTracker green (membrane potential insensitive) and MitoTracker Deep Red (membrane potential sensitive) to evaluate mitochondrial membrane potential by flow cytometry. Note that cells present within hatched oval represent those with low mitochondrial membrane potential. Flow plots are representative of data from 3 independent experiments.
Figure 9. Mitophagy is activated during and required for EMT-mediated CD44H cell expansion.
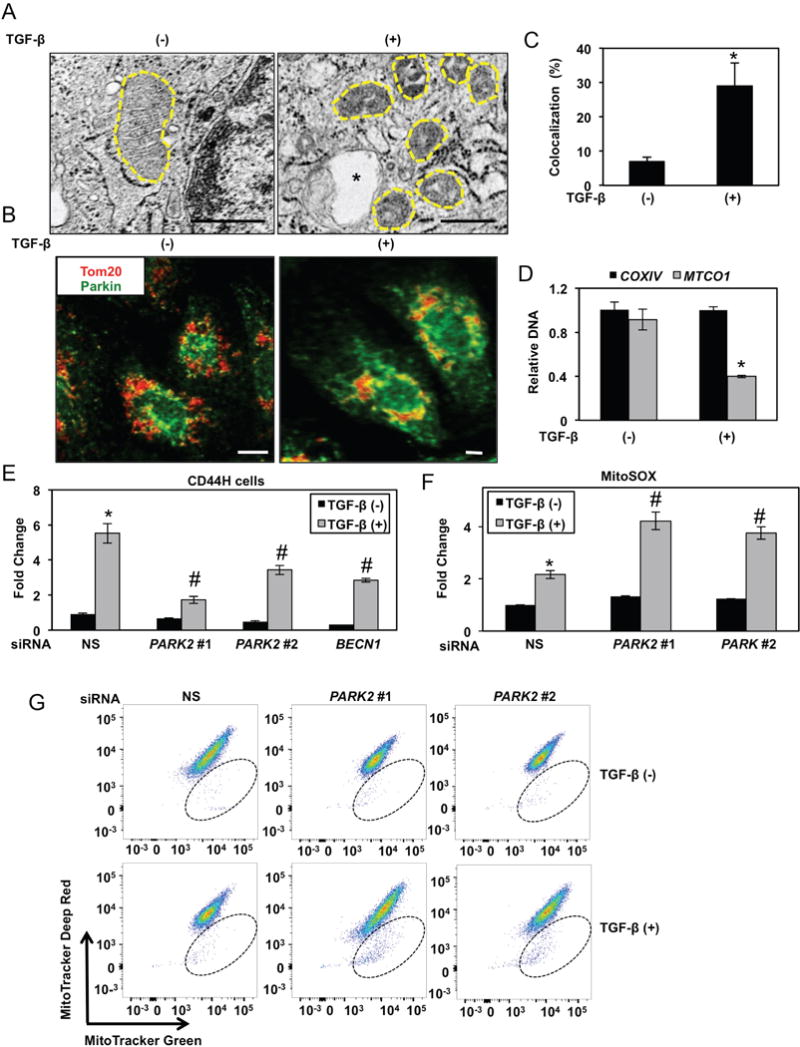
(A–C) EPC2T cells were cultured with or without TGF-β (5 ng/ml) for 7 days. (A) Representative micrographs with mitochondria outlined by hatched line and autophagic vesicle indicated by asterisk. Scale bars, 500 nm (B) Following IF staining for TOM20 (red) and Parkin (green), cells were imaged by confocal microscopy with representative images (in B) and quantification of colocalization in bar diagram (mean ± sd) (in C) shown. *, p<0.05 vs. TGF-β (−); (n=3). Scale bars, 5 μm. (D) mtDNA content was determined by quantitative real time PCR. Note that MTCO1 is encoded by mitochondrial DNA while COXIV is encoded by nuclear DNA. Gene expression is presented relative to an internal loading control (GAPDH) in bar diagram (mean ± sd). *, p<0.05 vs. TGF-β (−); (n=3). (E-G) EPC2T cells were transfected with siRNA targeting PARK2 or BECN1 or non-silencing control siRNA (NS). (E) Cells were analyzed for expression of CD24 and CD44 by flow cytometry to determine CD44H cells with relative fold change shown in bar diagram (mean ± sem). *, p<0.05 vs. NS TGF-β (−); #, p<0.05 vs. NS TGF-β (+); (n=3). (F) Cells were analyzed for DCF by flow cytometry to determine ROS with relative fold change shown in bar diagram (mean ± sem). *, p<0.05 vs. NS TGF-β (−); #, p<0.05 vs. NS TGF-β (+); (n=3). (G) Cells were stained with MitoTracker green (membrane potential insensitive) and MitoTracker Deep Red (membrane potential sensitive) to evaluate mitochondrial membrane potential by flow cytometry. Note that cells present within hatched oval represent those with low mitochondrial membrane potential. Flow plots are representative of data from 3 independent experiments. p values were determined by two-tailed Student’s t-test (in C and D) or ANOVA with Tukey’s post-hoc test was used to determine p values (in E and F).
We finally treated immunocompromised mice bearing established TE11 xenograft tumors with mitochondria division inhibitor (Mdivi)-1 which attenuates mitophagy by blocking mitochondrial fission.6 Mdivi-1 promoted accumulation of mitochondria with depleted membrane potential (Figure 10A). Although the drug had no effect on tumor volume (Figure 10B), 40% of Mdivi-1-treated tumors showed necrosis (Figure 10C). Mdivi-1 also depleted cells with high CD44 expression in tumors while promoting oxidative stress (Figure 10D–G). By contrast, 100% of vehicle-treated tumors remained intact histologically (Figure 10C). These findings are consistent with our in vitro studies and suggest that mitophagy acts as a cytoprotective mechanism during EMT-mediated generation of CD44H cells via regulation of redox homeostasis and Parkin-dependent clearance of dysfunctional mitochondria.
Figure 10. Effects of mitophagy inhibition in vivo.
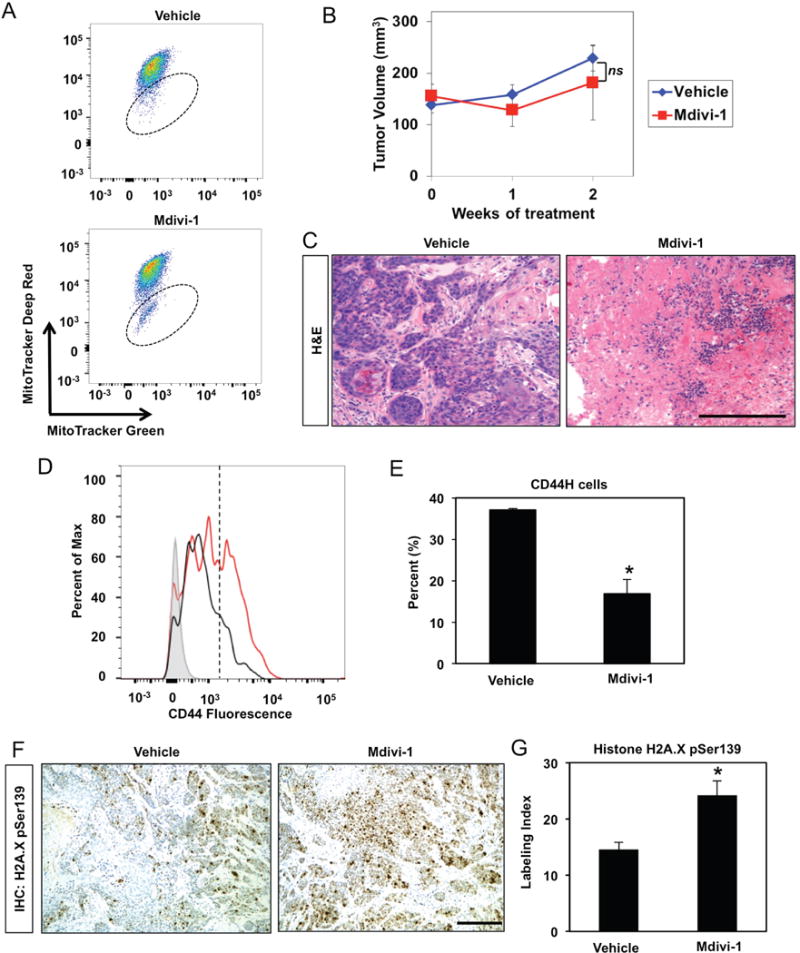
Immunocompromised mice bearing established TE11 xenograft tumors (~150 mm3) were treated with Mdivi-1 (0.375 mg/tumor) or vehicle control via intratumoral injection 2 times per week for 2 weeks. (A) Dissociated tumor cells were assessed for MitoTracker green (membrane potential insensitive) and MitoTracker Deep Red (membrane potential sensitive) to evaluate mitochondrial membrane potential by flow cytometry. Note that cells present within hatched oval represent those with low mitochondrial membrane potential. Flow plots represent data from at least 3 tumors. (B) Tumor volume was measured weekly as presented in line graph (mean ± sem). ns, not significant vs. Mdivi-1; (n=8 in vehicle-treated group) or (n=10 in Mdivi-1-treated group); repeated measures ANOVA. (C) H&E images of representative tumors. Scale bar, 100 μm. (D, E) Dissociated tumor cells were assessed for CD44 expression with flow cytometry plot of representative samples (in D). Note cells with high CD44 expression are present to the right of the hatched line. (E) Bar diagram (mean ± sem) representing average percentage of cells with high CD44 expression in tumors from mice treated with vehicle (n=8) or Mdivi-1 (n=10). *, p<0.05 vs. vehicle. (F, G) Tumor sections were stained for p-H2A.XSer139 via IHC to assess oxidative stress. (F) Representative images. Scale bars, 100 μm. (G) Bar diagram as (mean ± sem) representing average p-H2A.XSer139 labeling index in tumors from mice treated with vehicle (n=8) or Mdivi-1 (n=10). *, p<0.01. ANOVA with Tukey’s post-hoc test was used to determine p values (in E and G).
Discussion
In this study, we demonstrate that high expression of cleaved LC3 correlates with poor prognosis in ESCC (Figure 1) and that pharmacological autophagy inhibition depletes ESCC cells with high CD44 expression in xenograft tumors while promoting oxidative stress (Figure 2). We then utilize well-characterized transformed esophageal and oral keratinocyte cell lines to define the mechanism through which autophagy contributes specifically to CD44H cell generation via TGF-β-induced EMT. We report that AV content is augmented upon EMT-mediated CD44L to CD44H cell conversion as a result of enhanced autophagic flux (Figures 3–6). Moreover, autophagy acts as a cytoprotective mechanism to mitigate mitochondrial dysfunction, oxidative stress and apoptotic cell death during TGF-β-mediated EMT and CD44L to CD44H cell conversion (Figures 6–9). We also demonstrate that mitophagy is activated during EMT-mediated CD44H expansion, facilitating clearance of dysfunctional mitochondria and modulation of oxidative stress (Figures 9–10).
Autophagy supports initiation and maintenance of CD44H breast cancer cells with mesenchymal characteristics via transcriptional downregulation of CD24 and upregulation of the mesenchymal marker Vimentin;8 however, autophagic targeting of the EMT-associated transcription factors Snail and Twist has been demonstrated to inhibit EMT, tumor growth and metastasis in mammary carcinoma.29 The dichotomous nature of the relationship between autophagy and EMT is illustrated further in the liver where autophagy promotes EMT in hepatocellular carcinoma cells via activation of the TGF-β/Smad3 signaling axis,27 but prevents EMT in non-transformed hepatocytes via Snail degradation.14 While the potential for cell type- and context-dependent roles for autophagy with regard to EMT and CD44H cell dynamics cannot be excluded, one potential source of ambiguity in the aforementioned studies is the presence of mixed epithelial and mesenchymal populations that may be differentially influenced by autophagy modulation. Limited spontaneous CD44H generation in purified CD44L EPC2T cells coupled with robust EMT-mediated CD44L to CD44H cell conversion in response to TGF-β (Figure 3) facilitated our investigation into the functional role of autophagy specifically in the expansion of CD44H cells, representing a strength of the current study. Our findings utilizing this experimental system indicate a critical cytoprotective role for autophagy in keratinocytes undergoing EMT-mediated generation of CD44H cells (Figure 7; Supplementary Figure S11). We have previously implicated various additional factors, including ZEB140, Wnt28, Notch,41 EGFR41 and IGFBP338, in EMT by transformed esophageal keratinocytes and it will be of interest to elucidate potential interactions between autophagy and these pathways in the context of ESCC.
This is the first report to implicate mitophagy in the regulation of EMT and cancer cells with high CD44 expression. In transformed esophageal keratinocytes undergoing EMT-mediated CD44L to CD44H cell conversion, we detect evidence of mitophagy, including loss of mtDNA (Figure 9). Reduced mtDNA content has been reported in various cancer types, including esophageal cancer and head and neck squamous cell carcinoma,45, 60 and may correlate with invasion, metastasis and poor clinical prognosis.42, 52 Although the molecular mechanisms governing tumor-associated mtDNA depletion remain elusive, our findings suggest a role for mitophagy in mtDNA reduction and acquisition of malignant potential. Alterations in mitochondrial content often result from imbalance between mitochondrial clearance and mitochondrial biogenesis,3 raising the possibility that impaired mitochondrial biogenesis may also accompany CD44H cell generation. As depletion of mtDNA induces EMT and CD44H cell expansion in mammary epithelial cells,15 it remains to be determined if mitophagy drives EMT-mediated CD44H cell expansion or is a permissive factor during this process.
Mitophagy-mediated ROS regulation suppresses senescence and age-associated stem cell exhaustion in skeletal muscle.12, 13 Our finding that autophagy inhibition in keratinocytes undergoing EMT promotes cell death associated with mitochondrial dysfunction and ROS accumulation (Figure 9) further supports a role for mitophagy in cell fate determination in the context of cancer cells with high CD44 expression and enhanced malignant potential. Although TGF-β drives EMT and CD44H cell expansion in transformed keratinocytes, we have previously demonstrated induction of TGF-β-mediated senescence in non-transformed esophageal keratinocytes.22 Wild type p53 interacts with Parkin to inhibit mitophagy.17 As such, it is tempting to speculate that differential cell fates induced by TGF-β in non-transformed (wild type p53) and transformed (overexpression of mutant p53, EGFR and Cyclin D1) esophageal keratinocytes may be related to the ability of these cells to modulate mitophagy via p53. In addition to regulating ROS, mitophagy may be activated by ROS, including O2−. The mitochondrial antioxidant superoxide dismutase (SOD) 2 attenuates mitophagy following photodynamic stress.46 Our findings in transformed esophageal keratinocytes demonstrate transient SOD2 downregulation during TGF-β-mediated CD44L to CD44H cell conversion22 where we now find evidence of mitophagy. Thus, SOD2 and mitophagy may act coordinately in transformed keratinocytes exposed to TGF-β in order to fine tune ROS to a level that is permissive for EMT, but insufficient to engage alternative cell fates such as apoptosis. An additional question that remains is whether mitophagy regulates mesenchymal-epithelial transition. As EPC2T cells display minimal interconversion between CD44L and CD44H cells in the absence of TGF-β, future studies will address this issue utilizing transformed keratinocytes capable of robust CD44H to CD44L conversion.
Previous reports analyzing LC3 in ESCC patients exhibited discrepant results regarding the relationship to patient outcome.16, 58 In a cohort of chemoradiotherapy naïve ESCC patients, we demonstrate that high cleaved LC3 expression correlates with poor clinical outcome, consistent with the findings of Hao et al.16 Pharmacological autophagy or mitophagy impairment in ESCC xenograft tumors decreased intratumoral content of cells with high CD44 expression (Figures 2 and 10), supporting autophagy as tumor-promoting factor in ESCC. Given the association between high cleaved LC3 expression and metastasis in ESCC patients (Table 1), it is of interest to determine the influence of autophagy or mitophagy inhibition upon ESCC metastasis. Co-administration of pharmacological autophagy inhibitors with chemo-22 or radiotherapy21 enhances ESCC therapeutic response in preclinical settings. Our findings offer pretreatment with autophagy or mitophagy inhibitors as a mechanism to deplete cells with high CD44 expression and induce oxidative stress prior to intervention with neoadjuvant therapies, many of which require ROS for tumoricidal activity.47 Issues regarding specificity and potency have complicated the use of lysosomotropic agents to block autophagy in human patients1 and development of more potent autophagy inhibitors, including the dimeric CQ derivative Lys05, represents an active area of investigation.2, 35 Overall, the current study indicates future clinical strategies in ESCC as well as other cancer types in which autophagy and CD44H cells have been implicated will benefit from improved methods for pharmacologically targeting autophagy and mitophagy.
Materials and Methods
Human ESCC tissue microarray
ESCC tissues along with adjacent non-cancerous mucosa were obtained as surgical biopsies from Kagoshima University Hospital, as described previously.38 Clinical materials were obtained from informed-consent patients according to the Institutional Review Board standard and guideline.
Cell culture
EPC2T and OKF6T were generated and cultured in keratinocyte-serum free medium (KSFM; Thermo Fisher Scientific, Waltham, MA, USA) as described previously.10, 22, 40 TE11 cells were cultured in Dulbecco’s Modified Eagle Medium (Thermo Fisher Scientific) as previously described.40 Countess™ Automated Cell Counter (Thermo Fisher Scientific) was used to count cells with 0.2% Trypan Blue dye to exclude dead cells. Recombinant human TGF-β1 (R&D Systems, Minneapolis, MN, USA) was reconstituted in Dulbecco’s Phosphate Buffered Saline (DPBS) containing 10% FBS. Chloroquine diphosphate solid salt (Sigma-Aldrich, St Louis, MO, USA) was reconstituted in water. CDDP (Sigma-Aldrich) and 5FU (Sigma-Aldrich) were dissolved in DMSO. Organotypic 3D culture (OTC) was carried out as described previously.19 The earliest frozen stocks of all cell lines are stored at the Cell Culture Core of the University of Pennsylvania. We have propagated cells from frozen stocks of original vials that were authenticated by short tandem repeat profiling (ATCC) for highly polymorphic microsatellites to validate the identity of cells by comparing cells at the earliest stocks and those grown >8–12 passages. All cell lines undergo routine mycoplasma testing.
RNA interference and transfection
siRNA sequences directed against PARK2 (Silencer Select s224170 and s10043; 10 nm; Thermo Fisher Scientific), BECN1 (BECN1; Silencer Select s16537 and s16358; 10 nm; Thermo Fisher Scientific) or a non-silencing control sequence (Silencer Select Negative Control #1; 10 nm; Thermo Fisher Scientific) were transfected with Lipofectamine RNAi Max reagent (Thermo Fisher Scientific) as described previously.22
Quantitative real-time reverse-transcription polymerase chain reaction (RT-PCR) and mtDNA PCR
RNA isolation, cDNA synthesis and quantitative RT-PCR were performed using SYBR green or TaqMan® Gene Expression Assays (Thermo Fisher Scientific) as previously described.22 The following TaqMan® gene expression assays were utilized: Hs01081473_m1 for CD44s, Hs01081480_m1 for CD44v3-v10, and Hs1075866_m1 for CD44v2-v10. SYBR green was also used to quantitate mRNA for PARK2 and CD44 with paired forward and reverse primers: PARK2-F (5′-AAATCAGGTGGCTCCCTTCTGTCA-3′); PARK2-R (5′-CATGCAGATTGGGAAGGCGCAATA-3′); CD44-F (5′-TAAGGACACCCCAAATTCCA-3′); and CD44-R (5′-ACTGCAATGCAAACTGCAAG-3′). Relative PARK2 or CD44 level was normalized to β-actin (ACTB) using the following primers: β-ACTIN-F (5′-TTGCCGACAGGATGCAGAA-3′) and β-ACTIN-R (5′-GCCGATCCACACGGAGTACT-3′). DNA was extracted from cells using DNeasy Blood & Tissue Kit (Qiagen, Valencia, CA, USA). mtDNA content measured by quantitative RT- PCR using specific primers for mtDNA-coded Cytochrome Oxidase I (MTCO1) and nuclear DNA-coded Cytochrome Oxidase IV (COXIV) or Glyceraldehyde 3-phosphate dehydrogenase (GAPDH), as previously described.15, 22 Primers sequences for mtDNA analysis are as follow: MTCO1-F (5′-CCCACCGGCGTCAAAGTAT-3′); MTCO1-R (5′-TGCAGCAGATCATTTCATATTGC-3′); COX-IV-F (5′-GGGCGGTGCCATGTTTC-3′); COX-IV-R (5′-CATAGTGCTTCTGCCACATGA-3′); GAPDH-F (5′-CCAGGTGGTCTCCTCTGACTTC-3′); and GAPDH-R (5′-GTGGTCGTTGAGGGCAATC-3′).
Immunohistochemistry and immunofluorescence
IHC and IF in tissue sections and were performed as described previously56 using the following primary antibodies: anti-cleaved LC3 (1:250; AP1805a; Abgent, San Diego, CA), anti-E-cadherin (1:100; 610182; BD Biosciences, San Jose, CA, USA); anti-phospho-Histone H2A.X Ser139 (20E3) (1:250; 9718; Cell Signaling Technology, Danvers, MA), anti-ZEB1 (1:200; Douglas S. Darling),9 α-Smooth Muscle Actin (1A4) (1:200; A5528; Sigma-Aldrich). To detect CD44, we utilized mouse anti-CD44 clone 156-C11 (1:100; 3570; Cell Signaling Technology) which recognizes an epitope in the amino-terminal extracellular region of CD4448, consisting of the nonvariable exons 1 to 5, allowing for detection of the standard isoform of CD44 as well as variant CD44 isoforms. To detect CD44v6, we utilized anti-CD44v6 clone #2F10 (1:100; R&D Systems). A pathologist blind to molecular and clinical data scored all slides. Cleaved LC3 staining was scored based on intensity and distribution. Score 0, no stain detected; Score 1, marginal to mild stain affecting nuclei only; Score 2, moderate to intense nuclear staining and occasional cytosolic stain; Score 3, intense nuclear stain together with obvious cytosolic stain with or without puncta. Scores 0 and 1 were classified as low while scores 2 and 3 were defined as high with regard to LC3 expression. For Histone H2A.X Ser139 IHC staining, a labeling index was determined as the percentage of nuclei positively stained nuclei per total nuclei counted (≥375 cells per tumor). Slides were imaged on a Nikon E600 microscope.
For immunocytochemistry, cells grown on glass coverslips precoated with bovine collagen (1 μg/ml; Organogenesis, Canton MA, USA) were fixed in 4% formaldehyde for 20 minutes, permeabilized with 0.1% Triton X-100 in DPBS, and blocked with 5% bovine serum albumin for 1 hour. Cells were incubated with rabbit anti-Parkin (1:100; ab15954; Abcam, Cambridge, MA) and mouse anti-TOM20 (F10) (1:100; sc-17764; Santa Cruz, Dallas, TX, USA) overnight at 4°C, and then with rabbit-Cy2- and mouse-Cy3-conjugated secondary antibodies (1:200; Jackson ImmunoResearch, West Grove, PA, USA) for 1 hour at room temperature. Nuclei were counterstained by 4′,6-diamidino-2-phenylindole (DAPI; 1:10000; Thermo Fisher Scientific). Stained objects were imaged with a Leica TCS SP8 confocal microscope using LAS software (Leica Microsystems, Buffalo Grove, IL, USA).
Immunoblot analysis
Western blotting was performed as described previously18, 22 using the following primary antibodies: rabbit anti-LC3B (1:1000; 2775; Cell Signaling Technology), mouse anti-p62/SQSTM1 (D-3) (1:1000; sc-28359; Cell Signaling Technology), rabbit anti-Beclin1 antibody (1:1000; 3738; Cell Signaling Technology), mouse anti-E-cadherin (1:10000; 610182; BD Biosciences), mouse anti-N-cadherin (1:1000; 610921; BD Biosciences), and mouse anti-β-Actin (AC-74) (1:10000; A5316; Sigma-Aldrich). To detect CD44, we utilized mouse anti-CD44 clone 156-C11 (1:1000; 3570; Cell Signaling Technology) which recognizes an epitope in the amino-terminal extracellular region of CD4448, allowing for detection of the standard isoform of CD44 as well as variant CD44 isoforms. CD44v6 expression was evaluated via mouse anti-CD44v6 clone 2F10 (1:500; BBA13 R&D Systems). Densitometry was performed with Image J (National Institutes of Health).
Transmission electron microscopy
Cells and tissue sections were fixed and analyzed as described previously.26 AVs were identified as double-membrane vesicles containing cellular material.25 AV counts were performed in at least 50 cells per condition by two independent investigators blinded to experimental conditions.
Soft agar colony formation assay
Soft agar colony formation assays were done as described.41 Colonies ≥100 μm were counted following Giemsa staining.
Migration and invasion assays
Cell migration and invasion assays were done using Boyden chambers as described previously.41 In brief, 2.5 × 10⁴ cells were suspended in base medium devoid of growth factors and placed in each insert coated with or without Matrigel matrix (BD Biosciences). Cells were allowed to move toward full media filled in the bottom well for 24 hours and stained with 4 μg/ml Calcein AM dye (Invitrogen). All Boyden chamber assays were performed at least three times in triplicate.
Flow cytometry and FACS
Flow cytometry and FACS were performed as described previously22, 38 using FACSCalibur or LSR II cytometers (BD Biosciences) and FlowJo software (Tree Star) for cells suspended in DPBS containing 1% bovine serum albumin (BSA). CD44Low-CD24High (CD44L), CD44High-CD24−/low (CD44H) and CD44High-CD24High (CD44T) subpopulations were identified via staining with PE/Cy7-anti-CD24 [ML5] (1:40; 101822; BioLegend, San Diego, CA, USA) and APC-anti-CD44 clone G44-26 (1:20; 559942; BD Biosciences) on ice for 30 minutes. Anti-CD44 clone G44-26 recognizes an epitope in the extracellular amino-terminal region of CD4423 which consists of the nonvariable exons 1 to 5, allowing for detection of the standard isoforms of CD44 as well as variant isoforms. CD44v6 expression was evaluated utilizing PE-anti-CD44v6 clone #2F10 (1:10; AB3660P; R&D Systems). To define cells with high CD44 expression in TE11, a gate set in vehicle control was applied to all experimental groups. FACS Aria II (BD Biosciences) was used to sort purified CD44L and CD44H cells. AVs were determined with Cyto-ID® fluorescent dye (ENZ-51031; Enzo Life Sciences, Farmingdale, NY, USA) as previously described.51, 56 ROS were determined with 2′, 7′-dichlorodihydrofluorescein diacetate (DCF; 10 μM; D399; Thermo Fisher Scientific) and MitoSOX™ (M36008; 5 μM; Thermo Fisher Scientific) as previously described.22, 51, 56 For MitoTracker™ Green (1:20000; M7514; Thermo Fisher Scientific) and Deep Red (1:50000; M22426; Thermo Fisher Scientific) staining, cells were incubated with indicated dilutions of 1 mM stock in KSFM at 37°C for 30 minutes. Cells were then cultured in KSFM for 3 hours prior to flow cytometry. Viability was determined using DAPI. Apoptosis was determined using the Annexin-V-FLUOS kit (11858777001; Sigma-Aldrich) according the manufacturer’s instructions.
Xenotransplantation studies and histological analysis
Xenograft experiments were performed as described38 under an Institutional Animal Care and Use Committee-approved protocol. Cells were suspended in 50% Matrigel and implanted subcutaneously into the dorsal flanks of 4 week old female athymic nu/nu mice (Taconic Biosciences, Hudson, NY, USA). Tumor growth was monitored using digital calipers and volume was calculated using the formula: tumor volume (mm3) = [width (mm)]2 × length (mm) × 0.5. Mice were subjected to intraperitoneal (i.p.) injection of HCQ (60 mg/kg; Spectrum Chemical, New Brunswick, NJ, USA), Lys05 (20 mg/kg; a gift from Drs. Amaravadi and Winkler)35 or DPBS according to a 3 days on/2 days off regimen for 2 weeks. Mdivi-1 (0.375 mg/tumor; Sigma-Aldrich) or DMSO was delivered via intratumoral injection twice weekly for 2 weeks. All xenograft experiments were completed at least 2 independent times. Sample size for groups were projected based upon previous xenograft studies then adjusted following acquisition of data in initial experiment. Tumors were harvested for histopathological analysis, flow cytometry or TEM as previously described.38 Animals were only excluded from analyses in event of death from procedure-related causes (e.g. sepsis) that were unrelated to experimental differences between groups. Animals were randomized by cage upon arrival. Investigators were informed of groups during treatment phase of experiments. Upon processing, tumors were given a unique identifier to blind investigators during analyses and outcome assessments.
Statistical analyses
Data were analyzed as indicated using GraphPad Prism 7.0 software. p <0.05 was considered significant. Equal variance across groups being compared was confirmed by Bartlett’s test (for ANOVA) or F-test (Student’s t-test).
Data availability
Microarray data were deposited at the NCBI Gene Expression Omnibus (http://www.ncbi.nlm.nih.gov/geo) under accession numbers GSE37993 and GSE37994. Additional datasets are available upon request.
Supplementary Material
Acknowledgments
We appreciate the support the support of members the Nakagawa and Rustgi laboratories for thoughtful discussions and support. We thank Ben Rhodes, Sanders Chang, Andy Guo, Amanda B. Muir, MD and Ashley Lento, PhD for technical support. We acknowledge the Flow Cytometry and Cell Sorting Resource Laboratory, the Electron Microscopy Resource Laboratory, and the Cell and Developmental Biology Microscopy Core at the University of Pennsylvania. This study was supported by the following NIH Grants: P01CA098101 (KAW, KT, PMC, AJK-S, HN, AKR), K26RR032714 (HN), P30ES013508 University of Pennsylvania Center of Excellence in Environmental Toxicology (HN), K01DK103953 (KAW), F32CA174176 (KAW), T32DK007066 (KAW), the American Cancer Society RP-10-033-01-CCE (AKR), NIH/NIDDK P30DK050306 Center of Molecular Studies in Digestive and Liver Diseases, The Molecular Pathology and Imaging, Molecular Biology/Gene Expression, Cell Culture and Mouse Core Facilities. Additional support was provided by the Pennsylvania Department of Health, Pennsylvania CURE Program Grant (HN). KT is a recipient of the Japan Society for the Promotion of Science Postdoctoral Fellowship.
Abbreviations
- 3D
3-dimensional
- 5FU
5-fluorouracil
- αSMA
α-smooth muscle actin expression (ATG, autophagy-related
- AV(s)
autophagic vesicle(s)
- BSA
bovine serum albumin
- CD44H
CD44High-CD24−/Low
- CD44L
CD44Low-CD24High
- CD44s
standard isoform of CD44
- CD44T
CD44High-CD24High
- CD44v
variant isoforms of CD44
- CDDP
cisplatin
- COXIV
Cytochrome Oxidase IV
- CQ
Chloroquine
- DAPI
4′,6-diamidino-2-phenylindole
- DCF
2′, 7′-dichlorodihydrofluorescein diacetate
- DPBS
Dulbecco’s Phosphate-Buffered Saline
- EMT
epithelial-mesenchymal transition
- EPC2T
EPC2-hTERT-EGFR-p53R175H-CyclinD1
- ESCC
esophageal squamous cell carcinoma
- ESRP
epithelial splicing regulatory protein
- FACS
fluorescence activated cell sorting
- GAPDH
Glyceraldehyde 3-phosphate dehydrogenase
- HCQ
Hydroxychloroquine
- i.p.
intraperitoneal
- IHC
Immunohistochemistry
- KSFM
keratinocyte-serum free medium
- LC3
microtubule-associated protein 1 light chain 3
- Mdivi-1
mitochondria division inhibitor-1
- MTCO1
Mitochondrial encoded Cytochrome Oxidase I
- mtDNA
mitochondrial DNA
- O2−
superoxide
- OKF6T
OKF6-hTERT-EGFR-p53R175H
- OTC
organotypic culture
- p-H2A.XSer139
phospho-Histone H2A.X Serine139
- PCR
polymerase chain reaction
- PI
propidium iodide
- ROS
reactive oxygen species
- RT
Reverse-transcription
- sd
standard deviation
- sem
standard error of the mean
- siRNA
small interfering RNA
- SOD
superoxide dismutase
- TEM
transmission electron microscopy
- TGF
transforming growth factor
Footnotes
Conflict of Interest: Drs. Ravi K. Amaravadi and Jeffrey D. Winkler have licensed Lys05 to Presage biosciences for development.
Supplementary Information accompanies the paper on the Oncogene website (http://www.nature.com/onc).
References
- 1.Amaravadi RK, Lippincott-Schwartz J, Yin XM, Weiss WA, Takebe N, Timmer W, et al. Principles and current strategies for targeting autophagy for cancer treatment. Clin Cancer Res. 2011;17:654–666. doi: 10.1158/1078-0432.CCR-10-2634. [DOI] [PMC free article] [PubMed] [Google Scholar]
- 2.Amaravadi RK, Winkler JD. Lys05: a new lysosomal autophagy inhibitor. Autophagy. 2012;8:1383–1384. doi: 10.4161/auto.20958. [DOI] [PMC free article] [PubMed] [Google Scholar]
- 3.Archer SL. Mitochondrial dynamics–mitochondrial fission and fusion in human diseases. N Engl J Med. 2013;369:2236–2251. doi: 10.1056/NEJMra1215233. [DOI] [PubMed] [Google Scholar]
- 4.Biddle A, Gammon L, Liang X, Costea DE, Mackenzie IC. Phenotypic Plasticity Determines Cancer Stem Cell Therapeutic Resistance in Oral Squamous Cell Carcinoma. EBioMedicine. 2016;4:138–145. doi: 10.1016/j.ebiom.2016.01.007. [DOI] [PMC free article] [PubMed] [Google Scholar]
- 5.Brown RL, Reinke LM, Damerow MS, Perez D, Chodosh LA, Yang J, et al. CD44 splice isoform switching in human and mouse epithelium is essential for epithelial-mesenchymal transition and breast cancer progression. J Clin Invest. 2011;121:1064–1074. doi: 10.1172/JCI44540. [DOI] [PMC free article] [PubMed] [Google Scholar]
- 6.Cassidy-Stone A, Chipuk JE, Ingerman E, Song C, Yoo C, Kuwana T, et al. Chemical inhibition of the mitochondrial division dynamin reveals its role in Bax/Bak-dependent mitochondrial outer membrane permeabilization. Dev Cell. 2008;14:193–204. doi: 10.1016/j.devcel.2007.11.019. [DOI] [PMC free article] [PubMed] [Google Scholar]
- 7.Chen Y, Li X, Guo L, Wu X, He C, Zhang S, et al. Combining radiation with autophagy inhibition enhances suppression of tumor growth and angiogenesis in esophageal cancer. Mol Med Rep. 2015;12:1645–1652. doi: 10.3892/mmr.2015.3623. [DOI] [PMC free article] [PubMed] [Google Scholar]
- 8.Cufi S, Vazquez-Martin A, Oliveras-Ferraros C, Martin-Castillo B, Vellon L, Menendez JA. Autophagy positively regulates the CD44(+) CD24(−/low) breast cancer stem-like phenotype. Cell Cycle. 2011;10:3871–3885. doi: 10.4161/cc.10.22.17976. [DOI] [PubMed] [Google Scholar]
- 9.Darling DS, Stearman RP, Qi Y, Qiu MS, Feller JP. Expression of Zfhep/deltaEF1 protein in palate, neural progenitors, and differentiated neurons. Gene Expr Patterns. 2003;3:709–717. doi: 10.1016/s1567-133x(03)00147-9. [DOI] [PMC free article] [PubMed] [Google Scholar]
- 10.Dickson MA, Hahn WC, Ino Y, Ronfard V, Wu JY, Weinberg RA, et al. Human keratinocytes that express hTERT and also bypass a p16(INK4a)-enforced mechanism that limits life span become immortal yet retain normal growth and differentiation characteristics. Molecular and cellular biology. 2000;20:1436–1447. doi: 10.1128/mcb.20.4.1436-1447.2000. [DOI] [PMC free article] [PubMed] [Google Scholar]
- 11.Enzinger PC, Mayer RJ. Esophageal cancer. N Engl J Med. 2003;349:2241–2252. doi: 10.1056/NEJMra035010. [DOI] [PubMed] [Google Scholar]
- 12.Garcia-Prat L, Martinez-Vicente M, Munoz-Canoves P. Autophagy: a decisive process for stemness. Oncotarget. 2016 doi: 10.18632/oncotarget.7766. [DOI] [PMC free article] [PubMed] [Google Scholar]
- 13.Garcia-Prat L, Martinez-Vicente M, Perdiguero E, Ortet L, Rodriguez-Ubreva J, Rebollo E, et al. Autophagy maintains stemness by preventing senescence. Nature. 2016;529:37–42. doi: 10.1038/nature16187. [DOI] [PubMed] [Google Scholar]
- 14.Grassi G, Di Caprio G, Santangelo L, Fimia GM, Cozzolino AM, Komatsu M, et al. Autophagy regulates hepatocyte identity and epithelial-to-mesenchymal and mesenchymal-to-epithelial transitions promoting Snail degradation. Cell Death Dis. 2015;6:e1880. doi: 10.1038/cddis.2015.249. [DOI] [PMC free article] [PubMed] [Google Scholar]
- 15.Guha M, Srinivasan S, Ruthel G, Kashina AK, Carstens RP, Mendoza A, et al. Mitochondrial retrograde signaling induces epithelial-mesenchymal transition and generates breast cancer stem cells. Oncogene. 2014;33:5238–5250. doi: 10.1038/onc.2013.467. [DOI] [PMC free article] [PubMed] [Google Scholar]
- 16.Hao CL, Li Y, Yang HX, Luo RZ, Zhang Y, Zhang MF, et al. High level of microtubule-associated protein light chain 3 predicts poor prognosis in resectable esophageal squamous cell carcinoma. Int J Clin Exp Pathol. 2014;7:4213–4221. [PMC free article] [PubMed] [Google Scholar]
- 17.Hoshino A, Mita Y, Okawa Y, Ariyoshi M, Iwai-Kanai E, Ueyama T, et al. Cytosolic p53 inhibits Parkin-mediated mitophagy and promotes mitochondrial dysfunction in the mouse heart. Nat Commun. 2013;4:2308. doi: 10.1038/ncomms3308. [DOI] [PubMed] [Google Scholar]
- 18.Kagawa S, Natsuizaka M, Whelan KA, Facompre N, Naganuma S, Ohashi S, et al. Cellular senescence checkpoint function determines differential Notch1-dependent oncogenic and tumor-suppressor activities. Oncogene. 2015;34:2347–2359. doi: 10.1038/onc.2014.169. [DOI] [PMC free article] [PubMed] [Google Scholar]
- 19.Kalabis J, Wong GS, Vega ME, Natsuizaka M, Robertson ES, Herlyn M, et al. Isolation and characterization of mouse and human esophageal epithelial cells in 3D organotypic culture. Nat Protoc. 2012;7:235–246. doi: 10.1038/nprot.2011.437. [DOI] [PMC free article] [PubMed] [Google Scholar]
- 20.Karantza-Wadsworth V, Patel S, Kravchuk O, Chen G, Mathew R, Jin S, et al. Autophagy mitigates metabolic stress and genome damage in mammary tumorigenesis. Genes Dev. 2007;21:1621–1635. doi: 10.1101/gad.1565707. [DOI] [PMC free article] [PubMed] [Google Scholar]
- 21.Kenific CM, Debnath J. Cellular and metabolic functions for autophagy in cancer cells. Trends Cell Biol. 2015;25:37–45. doi: 10.1016/j.tcb.2014.09.001. [DOI] [PMC free article] [PubMed] [Google Scholar]
- 22.Kinugasa H, Whelan KA, Tanaka K, Natsuizaka M, Long A, Guo A, et al. Mitochondrial SOD2 regulates epithelial-mesenchymal transition and cell populations defined by differential CD44 expression. Oncogene. 2015;34:5229–5239. doi: 10.1038/onc.2014.449. [DOI] [PMC free article] [PubMed] [Google Scholar]
- 23.Kishimoto T. Leucocyte typing VI: white cell differentiation antigens: proceedings of the sixth international workshop and conference held in Kobe, Japan, 10–14 November 1996. Garland Pub; New York: 1998. [Google Scholar]
- 24.Kleinberg L, Gibson MK, Forastiere AA. Chemoradiotherapy for localized esophageal cancer: regimen selection and molecular mechanisms of radiosensitization. Nat Clin Pract Oncol. 2007;4:282–294. doi: 10.1038/ncponc0796. [DOI] [PubMed] [Google Scholar]
- 25.Klionsky DJ, Abdelmohsen K, Abe A, Abedin MJ, Abeliovich H, Acevedo Arozena A, et al. Guidelines for the use and interpretation of assays for monitoring autophagy (3rd edition) Autophagy. 2016;12:1–222. doi: 10.1080/15548627.2015.1100356. [DOI] [PMC free article] [PubMed] [Google Scholar]
- 26.Kong J, Whelan KA, Laczko D, Dang B, Caro Monroig A, Soroush A, et al. Autophagy levels are elevated in barrett’s esophagus and promote cell survival from acid and oxidative stress. Mol Carcinog. 2015 doi: 10.1002/mc.22406. [DOI] [PMC free article] [PubMed] [Google Scholar]
- 27.Li J, Yang B, Zhou Q, Wu Y, Shang D, Guo Y, et al. Autophagy promotes hepatocellular carcinoma cell invasion through activation of epithelial-mesenchymal transition. Carcinogenesis. 2013;34:1343–1351. doi: 10.1093/carcin/bgt063. [DOI] [PubMed] [Google Scholar]
- 28.Long A, Giroux V, Whelan KA, Hamilton KE, Tetreault MP, Tanaka K, et al. WNT10A promotes an invasive and self-renewing phenotype in esophageal squamous cell carcinoma. Carcinogenesis. 2015;36:598–606. doi: 10.1093/carcin/bgv025. [DOI] [PMC free article] [PubMed] [Google Scholar]
- 29.Lv Q, Wang W, Xue J, Hua F, Mu R, Lin H, et al. DEDD interacts with PI3KC3 to activate autophagy and attenuate epithelial-mesenchymal transition in human breast cancer. Cancer Res. 2012;72:3238–3250. doi: 10.1158/0008-5472.CAN-11-3832. [DOI] [PubMed] [Google Scholar]
- 30.Mani SA, Guo W, Liao MJ, Eaton EN, Ayyanan A, Zhou AY, et al. The epithelial-mesenchymal transition generates cells with properties of stem cells. Cell. 2008;133:704–715. doi: 10.1016/j.cell.2008.03.027. [DOI] [PMC free article] [PubMed] [Google Scholar]
- 31.Marino G, Salvador-Montoliu N, Fueyo A, Knecht E, Mizushima N, Lopez-Otin C. Tissue-specific autophagy alterations and increased tumorigenesis in mice deficient in Atg4C/autophagin-3. J Biol Chem. 2007;282:18573–18583. doi: 10.1074/jbc.M701194200. [DOI] [PubMed] [Google Scholar]
- 32.Martegani MP, Del Prete F, Gasbarri A, Natali PG, Bartolazzi A. Structural variability of CD44v molecules and reliability of immunodetection of CD44 isoforms using mAbs specific for CD44 variant exon products. Am J Pathol. 1999;154:291–300. doi: 10.1016/S0002-9440(10)65275-3. [DOI] [PMC free article] [PubMed] [Google Scholar]
- 33.Mathew R, Kongara S, Beaudoin B, Karp CM, Bray K, Degenhardt K, et al. Autophagy suppresses tumor progression by limiting chromosomal instability. Genes Dev. 2007;21:1367–1381. doi: 10.1101/gad.1545107. [DOI] [PMC free article] [PubMed] [Google Scholar]
- 34.Mathew R, Karp CM, Beaudoin B, Vuong N, Chen G, Chen HY, et al. Autophagy suppresses tumorigenesis through elimination of p62. Cell. 2009;137:1062–1075. doi: 10.1016/j.cell.2009.03.048. [DOI] [PMC free article] [PubMed] [Google Scholar]
- 35.McAfee Q, Zhang Z, Samanta A, Levi SM, Ma XH, Piao S, et al. Autophagy inhibitor Lys05 has single-agent antitumor activity and reproduces the phenotype of a genetic autophagy deficiency. Proc Natl Acad Sci U S A. 2012;109:8253–8258. doi: 10.1073/pnas.1118193109. [DOI] [PMC free article] [PubMed] [Google Scholar]
- 36.Morel AP, Lievre M, Thomas C, Hinkal G, Ansieau S, Puisieux A. Generation of breast cancer stem cells through epithelial-mesenchymal transition. PLoS One. 2008;3:e2888. doi: 10.1371/journal.pone.0002888. [DOI] [PMC free article] [PubMed] [Google Scholar]
- 37.Narendra D, Tanaka A, Suen DF, Youle RJ. Parkin is recruited selectively to impaired mitochondria and promotes their autophagy. J Cell Biol. 2008;183:795–803. doi: 10.1083/jcb.200809125. [DOI] [PMC free article] [PubMed] [Google Scholar]
- 38.Natsuizaka M, Kinugasa H, Kagawa S, Whelan KA, Naganuma S, Subramanian H, et al. IGFBP3 promotes esophageal cancer growth by suppressing oxidative stress in hypoxic tumor microenvironment. Am J Cancer Res. 2014;4:29–41. [PMC free article] [PubMed] [Google Scholar]
- 39.Nozoe T, Kohnoe S, Ezaki T, Kabashima A, Maehara Y. Significance of immunohistochemical over-expression of CD44v6 as an indicator of malignant potential in esophageal squamous cell carcinoma. J Cancer Res Clin Oncol. 2004;130:334–338. doi: 10.1007/s00432-004-0542-2. [DOI] [PubMed] [Google Scholar]
- 40.Ohashi S, Natsuizaka M, Wong GS, Michaylira CZ, Grugan KD, Stairs DB, et al. Epidermal growth factor receptor and mutant p53 expand an esophageal cellular subpopulation capable of epithelial-to-mesenchymal transition through ZEB transcription factors. Cancer Res. 2010;70:4174–4184. doi: 10.1158/0008-5472.CAN-09-4614. [DOI] [PMC free article] [PubMed] [Google Scholar]
- 41.Ohashi S, Natsuizaka M, Naganuma S, Kagawa S, Kimura S, Itoh H, et al. A NOTCH3-mediated squamous cell differentiation program limits expansion of EMT-competent cells that express the ZEB transcription factors. Cancer Res. 2011;71:6836–6847. doi: 10.1158/0008-5472.CAN-11-0846. [DOI] [PMC free article] [PubMed] [Google Scholar]
- 42.Petros JA, Baumann AK, Ruiz-Pesini E, Amin MB, Sun CQ, Hall J, et al. mtDNA mutations increase tumorigenicity in prostate cancer. Proc Natl Acad Sci U S A. 2005;102:719–724. doi: 10.1073/pnas.0408894102. [DOI] [PMC free article] [PubMed] [Google Scholar]
- 43.Prince ME, Sivanandan R, Kaczorowski A, Wolf GT, Kaplan MJ, Dalerba P, et al. Identification of a subpopulation of cells with cancer stem cell properties in head and neck squamous cell carcinoma. Proc Natl Acad Sci U S A. 2007;104:973–978. doi: 10.1073/pnas.0610117104. [DOI] [PMC free article] [PubMed] [Google Scholar]
- 44.Qu X, Yu J, Bhagat G, Furuya N, Hibshoosh H, Troxel A, et al. Promotion of tumorigenesis by heterozygous disruption of the beclin 1 autophagy gene. J Clin Invest. 2003;112:1809–1820. doi: 10.1172/JCI20039. [DOI] [PMC free article] [PubMed] [Google Scholar]
- 45.Reznik E, Miller ML, Senbabaoglu Y, Riaz N, Sarungbam J, Tickoo SK, et al. Mitochondrial DNA copy number variation across human cancers. Elife. 2016;5 doi: 10.7554/eLife.10769. [DOI] [PMC free article] [PubMed] [Google Scholar]
- 46.Rubio N, Coupienne I, Di Valentin E, Heirman I, Grooten J, Piette J, et al. Spatiotemporal autophagic degradation of oxidatively damaged organelles after photodynamic stress is amplified by mitochondrial reactive oxygen species. Autophagy. 2012;8:1312–1324. doi: 10.4161/auto.20763. [DOI] [PMC free article] [PubMed] [Google Scholar]
- 47.Sabharwal SS, Schumacker PT. Mitochondrial ROS in cancer: initiators, amplifiers or an Achilles’ heel? Nat Rev Cancer. 2014;14:709–721. doi: 10.1038/nrc3803. [DOI] [PMC free article] [PubMed] [Google Scholar]
- 48.Schlossman SF. Leucocyte typing V: white cell differentiation antigens: proceedings of the fifth international workshop and conference held in Boston, USA, 3–7 November, 1993. Oxford University Press; Oxford; New York: 1995. [Google Scholar]
- 49.Shiozaki M, Ishiguro H, Kuwabara Y, Kimura M, Mitsui A, Naganawa Y, et al. Expression of CD44v6 is an independent prognostic factor for poor survival in patients with esophageal squamous cell carcinoma. Oncol Lett. 2011;2:429–434. doi: 10.3892/ol.2011.264. [DOI] [PMC free article] [PubMed] [Google Scholar]
- 50.Takahashi Y, Hori T, Cooper TK, Liao J, Desai N, Serfass JM, et al. Bif-1 haploinsufficiency promotes chromosomal instability and accelerates Myc-driven lymphomagenesis via suppression of mitophagy. Blood. 2013;121:1622–1632. doi: 10.1182/blood-2012-10-459826. [DOI] [PMC free article] [PubMed] [Google Scholar]
- 51.Tanaka K, Whelan KA, Chandramouleeswaran PM, Kagawa S, Rustgi SL, Noguchi C, et al. ALDH2 modulates autophagy flux to regulate acetaldehyde-mediated toxicity thresholds. Am J Cancer Res. 2016;6:781–796. [PMC free article] [PubMed] [Google Scholar]
- 52.Tseng LM, Yin PH, Chi CW, Hsu CY, Wu CW, Lee LM, et al. Mitochondrial DNA mutations and mitochondrial DNA depletion in breast cancer. Genes Chromosomes Cancer. 2006;45:629–638. doi: 10.1002/gcc.20326. [DOI] [PubMed] [Google Scholar]
- 53.Uchikado Y, Natsugoe S, Okumura H, Setoyama T, Matsumoto M, Ishigami S, et al. Slug Expression in the E-cadherin preserved tumors is related to prognosis in patients with esophageal squamous cell carcinoma. Clinical cancer research: an official journal of the American Association for Cancer Research. 2005;11:1174–1180. [PubMed] [Google Scholar]
- 54.Usami Y, Satake S, Nakayama F, Matsumoto M, Ohnuma K, Komori T, et al. Snail-associated epithelial-mesenchymal transition promotes oesophageal squamous cell carcinoma motility and progression. The Journal of pathology. 2008;215:330–339. doi: 10.1002/path.2365. [DOI] [PubMed] [Google Scholar]
- 55.Warzecha CC, Sato TK, Nabet B, Hogenesch JB, Carstens RP. ESRP1 and ESRP2 are epithelial cell-type-specific regulators of FGFR2 splicing. Mol Cell. 2009;33:591–601. doi: 10.1016/j.molcel.2009.01.025. [DOI] [PMC free article] [PubMed] [Google Scholar]
- 56.Whelan KA, Merves JF, Giroux V, Tanaka K, Guo A, Chandramouleeswaran PM, et al. Autophagy mediates epithelial cytoprotection in eosinophilic oesophagitis. Gut. 2016 doi: 10.1136/gutjnl-2015-310341. [DOI] [PMC free article] [PubMed] [Google Scholar]
- 57.Yang H, Liu J, Yu H, Sun P, Hu Y, Zhong J, et al. Expression and association of CD44v6 with prognosis in T2-3N0M0 esophageal squamous cell carcinoma. J Thorac Dis. 2014;6:91–98. doi: 10.3978/j.issn.2072-1439.2013.11.16. [DOI] [PMC free article] [PubMed] [Google Scholar]
- 58.Yoshioka A, Miyata H, Doki Y, Yamasaki M, Sohma I, Gotoh K, et al. LC3, an autophagosome marker, is highly expressed in gastrointestinal cancers. Int J Oncol. 2008;33:461–468. [PubMed] [Google Scholar]
- 59.Yu L, Gu C, Zhong D, Shi L, Kong Y, Zhou Z, et al. Induction of autophagy counteracts the anticancer effect of cisplatin in human esophageal cancer cells with acquired drug resistance. Cancer Lett. 2014;355:34–45. doi: 10.1016/j.canlet.2014.09.020. [DOI] [PubMed] [Google Scholar]
- 60.Yu M. Generation, function and diagnostic value of mitochondrial DNA copy number alterations in human cancers. Life Sci. 2011;89:65–71. doi: 10.1016/j.lfs.2011.05.010. [DOI] [PubMed] [Google Scholar]
- 61.Yue Z, Jin S, Yang C, Levine AJ, Heintz N. Beclin 1, an autophagy gene essential for early embryonic development, is a haploinsufficient tumor suppressor. Proc Natl Acad Sci U S A. 2003;100:15077–15082. doi: 10.1073/pnas.2436255100. [DOI] [PMC free article] [PubMed] [Google Scholar]
- 62.Yuen HF, Chan YP, Wong ML, Kwok WK, Chan KK, Lee PY, et al. Upregulation of Twist in oesophageal squamous cell carcinoma is associated with neoplastic transformation and distant metastasis. Journal of clinical pathology. 2007;60:510–514. doi: 10.1136/jcp.2006.039099. [DOI] [PMC free article] [PubMed] [Google Scholar]
- 63.Zhao JS, Li WJ, Ge D, Zhang PJ, Li JJ, Lu CL, et al. Tumor initiating cells in esophageal squamous cell carcinomas express high levels of CD44. PLoS One. 2011;6:e21419. doi: 10.1371/journal.pone.0021419. [DOI] [PMC free article] [PubMed] [Google Scholar]
- 64.Zoller M. CD44: can a cancer-initiating cell profit from an abundantly expressed molecule? Nat Rev Cancer. 2011;11:254–267. doi: 10.1038/nrc3023. [DOI] [PubMed] [Google Scholar]
Associated Data
This section collects any data citations, data availability statements, or supplementary materials included in this article.
Supplementary Materials
Data Availability Statement
Microarray data were deposited at the NCBI Gene Expression Omnibus (http://www.ncbi.nlm.nih.gov/geo) under accession numbers GSE37993 and GSE37994. Additional datasets are available upon request.