Abstract
Because the ionization efficiency for glycopeptides is lower than that of peptides in electrospray ionization, it is frequently necessary to enrich them prior to their analysis using liquid chromatography coupled with tandem mass spectrometry. Although some methods for selectively enriching glycopeptides (e.g., lectin, agarose, and cellulose methods) have been reported, they are time-consuming (procedures that require several hours) and may not be applicable to submicrogram-sized samples. Here, we report on a rapid, simple method for enriching glycopeptides in small sample amounts using cellulose hydrophilic interaction (cellulose HILIC)/reversed-phase (RP) stop-and-go extraction tips (StageTips). Using the cellulose HILIC/RP StageTips, glycopeptide-selective enrichment can be achieved at the nanogram level within a few minutes.
Keywords: glycopeptide, glycoprotein, glycan, carbohydrate, enrichment
INTRODUCTION
Glycosylation of proteins is a common post-translational modification and plays an important role in the formation of a protein structure, quality control, signal transduction, and immune response.1–4) Biologics, including monoclonal antibody (mAb) drugs, represents a successful and expanding class of drugs because of their high specificity and therapeutic effects.5) The production of mAb therapeutics requires careful monitoring of glycans because their antibody-dependent cell-mediated cytotoxicity (ADCC) and complement-dependent cytotoxicity (CDC) are dependent on their glycan structures.6,7) For example, the α1-6 fucosylation of a non-reducing-end GlcNAc decreases ADCC activity,6,8) whereas galactosyl modification increases CDC activity.7) Since glycans affect the safety and efficacy of biopharmaceuticals, they are considered to be critical-quality attributes in drug quality control. Therefore, to elucidate biological phenomena and develop biopharmaceuticals, it is frequently necessary to quantitatively analyze protein glycosylation.
In general, analyses glycoprotein glycosylation can be classified into three mass-spectrometric approaches: using the intact glycoprotein, the released glycan, or a glycopeptide approach.9,10) Intact glycoproteins can be directly subjected to mass spectrometry in the intact glycoprotein approach. Although in-depth sample preparation is not required in this approach, the method is not very sensitive. The released-glycan approach provides collecting detailed structural information regarding a glycan but does not reveal any glycosylation site or genetic information. The glycopeptide approach is a promising method for the glycosylation analysis of glycoproteins, through which it is possible to obtain comprehensive glycosylation information from complex biological samples. However, in mass spectrometry (MS), signals produced from glycopeptides are low compared to signals corresponding to peptides, owing to the low ionization efficacy of glycopeptides and the heterogeneity of glycans. Thus, glycopeptide enrichment is indispensable for analyzing glycosylation in glycoproteins using MS.
Several methods for enriching glycopeptides for MS have been reported, including lectin affinity chromatography and a batch method using a hydrophilic interaction liquid chromatography (HILIC) resin. Although lectin chromatography can be used to classify and enrich glycopeptides based on the specificities of lectins to glycan epitopes, it cannot cover all types of glycans, and the method is a costly one. The batch method typically involves the use of cellulose and agarose resins and is a promising method for glycopeptide enrichment.11,12) However, the method is time-consuming, and the method cannot be applied to small amounts of sample.
The stop-and-go extraction tip (StageTip) has been widely used in sample pre-purification for MS. StageTips have become extremely popular in proteomics because of their low price, high throughput, high recovery rate for small amount samples, and ease of use.13) We report herein on a novel StageTip prepared by combining cellulose HILIC and reversed phase (RP) and its use in efficiently enriching glycopeptides in a sample. The developed StageTip method allows for the rapid and convenient enrichment of a small sample that contains both N- and O-glycosylated peptides.
EXPERIMENTAL
Materials
Microcrystalline cellulose for chromatography was purchased from Merck Millipore (Darmstadt, Germany; Catalog number: 1.02331.0500). Dithiothreitol (DTT; biochemistry grade), trifluoroacetic acid (TFA; sequencing grade), formic acid, and acetonitrile for LC/MS, IgG1 solution from human myeloma, α1-acid glycoprotein, human chorionic gonadotropin (hCG), and lysyl endopeptidase (LysC; mass-spectrometry grade) were purchased from Wako (Osaka, Japan). Ribonuclease B (RNase B) from bovine pancrease (BioReagent grade) and sodium iodoacetate (IAA) were purchased from Sigma-Aldrich (St. Louis, MI). RapiGest SF surfactant and Sep-Pak Vac 1cc C18 cartridges were purchased from Waters (Milford, MA). Trypsin Gold (MS grade) was purchased from Promega (Madison, WI). Poly(styrene-divinylbenzene) StageTips (C-TIP) were purchased from Nikkyo Technos (Tokyo, Japan). Highly purified Milli-Q (Merck, Millipore) water was used in the present experiment.
Digestion
IgG1 aliquots (50 μg) the α1-acid glycoprotein, hCG, and RNase B were dissolved in 50 μL 0.1% (w/v) RapiGest SF containing 50 mM Tris–HCl (pH 7.8). An aliquot (0.5 μL) of 500 mM DTT was added to each sample, and the samples were then incubated at 65°C for 30 min. The samples were alkylated by adding 1.4 μL of 500 mM IAA, followed by incubation at room temperature for 40 min in the dark. Alkylation was terminated by adding 0.2 μL 500 mM DTT. Trypsin Gold aliquots (2 μg) were added to the IgG1, hCG, and α1-acid glycoprotein samples. A LysC aliquot (2 μg) was added to the RNase B sample. All samples were incubated at 37°C for 16 h. RapiGest SF was denatured and removed from the samples as indicated in the manufacturer’s manual. The samples were desalted using Sep-Pak Vac 1cc C18 cartridges and dried using a speed-vac. The N-glycans in the hCG were released by treatment with 1 U N-glycosidase F (Roche Diagnostics, Rotkreuz, Switzerland) in 50 μL 250 mM sodium phosphate buffer (pH 7.5) for 16 h at 37°C. The hCG sample was desalted using Sep-Pak Vac 1cc C18 cartridges and dried via a speed-vac. Finally, the samples were reconstituted with 50 μL 0.1% formic acid.
NanoLC/ESI/MS/MS
A nanoLC, EASY-nLC™ 1000 (Thermo Fisher Scientific, Waltham, MA) equipped with a trap column Acclaim™ PepMap™ 100 C18 (3 μm, 0.075 mm×10 mm; Thermo Fisher Scientific) and an analytical column NTCC-360/75-3-125 (C18, particle diameter 3 μm, 0.075 mm×125 mm; Nikkyo Technos) was hyphenated to a hybrid quadrupole-orbitrap mass spectrometer (Q Exactive™; Thermo Fisher Scientific). The samples were injected into the trap column and washed with 0.1% (v/v) formic acid/water at 200 bar for 10 min. The samples were eluted with a linear gradient composed of solution A (0.1% (v/v) formic acid/water) and solution B (0.1% (v/v) formic acid/acetonitrile) at 300 nL/min (0–40 min, 0–35% solution B; 40–60 min, 35–100% solution B. Aliquots (50 ng) of samples before and aliquots (50 ng of tryptic digest origin) of samples after glycopeptide enrichment were injected to the nanoLC/ESI/MS/MS.
Preparation of cellulose-RP StageTip
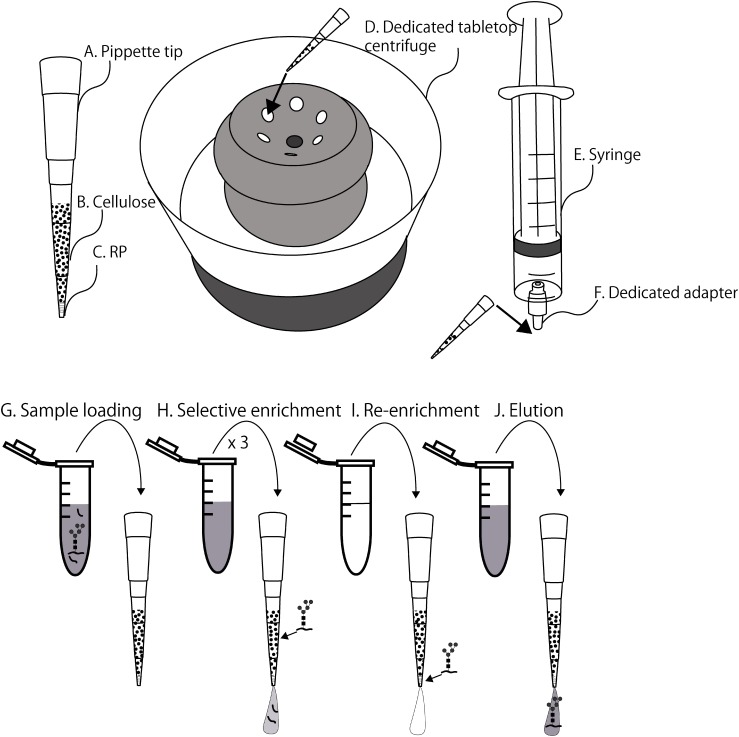
Microcrystalline cellulose was washed with water eight times and then washed twice with an 80% acetonitrile/0.1% TFA (v/v) solution. The microcrystalline cellulose was suspended in 80% acetonitrile (v/v). A repeating pipette tip (Distritip mini 1250 μL; Gilson, Middleton) was cut about 5 mm from the tip end. The suspension of microcrystalline cellulose was drawn in the repeating pipette tip and allowed to stand for 30 s to permit the microcrystalline cellulose to precipitate. Aliquots (25 μL) of the microcrystalline-cellulose slurry in 80% acetonitrile were placed in the StageTips (C-TIP, Nikkyo Technos). Finally, the StageTips were centrifuged in a dedicated tabletop centrifuge for 20 s. We repeated the experiment using different filling conditions. The optimal conditions for filling microcrystalline cellulose owing to its surface tension and viscosity was 80% acetonitrile.
Glycopeptide enrichment by the cellulose-RP StageTips
The cellulose-RP StageTips were inserted in the rotor of a dedicated tabletop centrifuge. Aliquots (50 μL) of 0.1% TFA were placed in the StageTips and centrifuged for 30 s to wash the cellulose resin. Aliquots (50 μL) of 70–90% acetonitrile/0.1% TFA (sample loading solution: 80% for N-linked glycopeptides and 90% O-linked glycopeptides; optimized condition) were then placed in the StageTips and centrifuged for 20 s for initialization of the microcrystalline cellulose. Aliquots (50 μL) of the sample loading solution were placed in the StageTips and flashed for 1 s. Samples (1 μg protein digested in 1 μL 0.1% formic acid/water) were placed in the solution and centrifuged for 20 s to allow them to bind to the cellulose layer (Fig. 1G). Aliquots (100 μL) of 70–90% acetonitrile/0.1% TFA (selective enrichment solution: 80% for N-linked glycopeptides and 90% O-linked glycopeptides; optimized condition) were placed in the StageTips and centrifuged for 20 s; this procedure was repeated three times to ensure the nonspecific peptides were completely removed (Fig. 1H). Aliquots (50 μL) of Milli-Q water were placed in the StageTips, and these were centrifuged for 30 s for re-enrichment of glycopeptides RP layer. Finally, aliquots (20 μL) of 80% acetonitrile were placed in the StageTips, and the glycopeptides were eluated using a dedicated syringe (Figs. 1E and 1F).
Fig. 1. Illustration of equipment and enrichment procedures.
Intensity ratio calculation
Glycopeptide-intensity ratios after enrichment were calculated by comparing the peak areas in the extracted-ion chromatograms of glycopeptides before and after enrichment. The peak areas in the extracted-ion chromatograms were calculated using the Xcalibur software (Xcalibur 2.2; Thermo Fisher Scientific).
RESULTS AND DISCUSSION
Enrichment of N-glycosylated peptides
The enrichment procedure involves four steps: loading a glycoprotein digest on the StageTips, selective enrichment of the glycopeptides on HILIC, re-enrichment of the glycopeptides on RP, and elution of the glycopeptides from the StageTips (Fig. 1). For the effective absorption of the N-glycosylated peptides on HILIC, various acetonitrile/TFA solutions (70–90% acetonitrile/0.1% TFA) were prepared for use with 10–25 μL of the microcrystalline cellulose. The results indicate that using 80% acetonitrile, but not the volume of the microcrystalline cellulose, is crucial for the HILIC enrichment process.
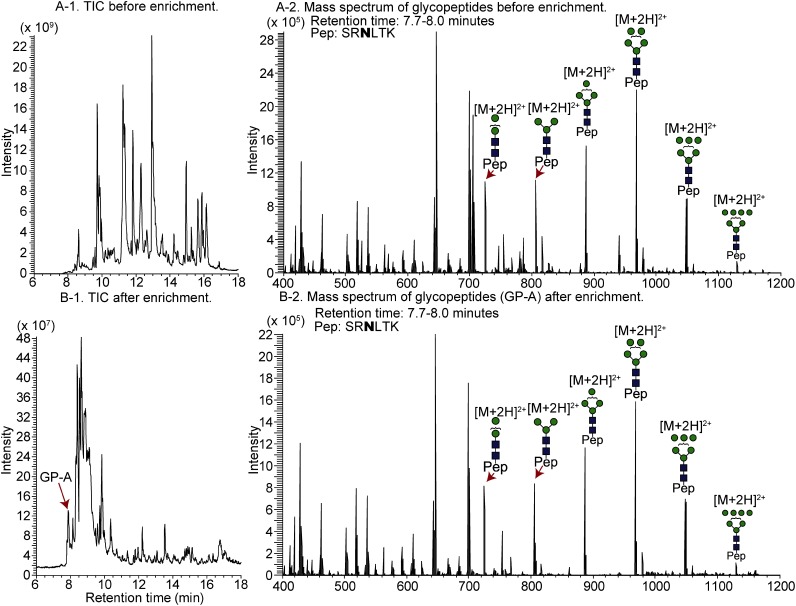
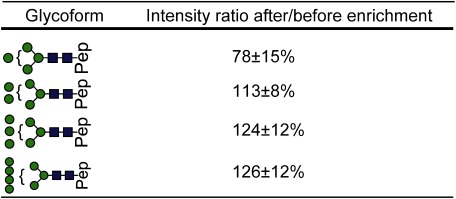
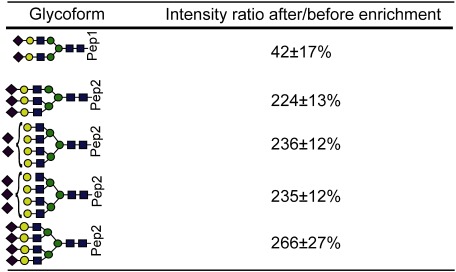
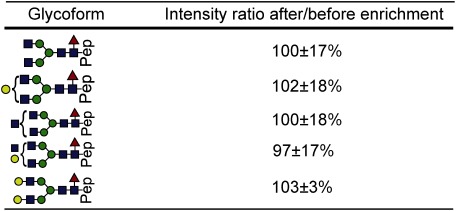
Figures 2A-1 and 2B-1 show total ion current (TIC) chromatograms of a LysC digest prepared from RNase B, which contains a high-mannose type glycan, before and after enrichment, respectively. The undetectable peaks at 7–8 min in Fig. 2A-1 are detectable after enrichment with the StageTips composed of cellulose (25 μL) and RP (Fig. 2B-1). The full mass scans of non-enriched glycopeptides (Fig. 2B-1) and enriched glycopeptides (Fig. 2B-2) as well as the intensity ratios of glycoforms (Table 1) indicate that the peak intensities of the glycoforms are increased after enrichment, and the peak enhancement effect is more notable in the case of lesser glycoforms. This phenomenon can be explained by the reduction in non-glycosylated peptides that causes the ionization of glycopeptides to be suppressed, resulting in less intense peaks.
Fig. 2. TIC chromatogram of ribonuclease B before (A) and after (B) glycopeptide enrichment using the cellulose-RP StageTip and mass spectra of glycopeptides.
Table 1. Intensity ratios of glycopeptides of RNase B after/before enrichment.
“Pep” indicates the amino acid sequence SRNLTK. (mean±S.D., n=4)
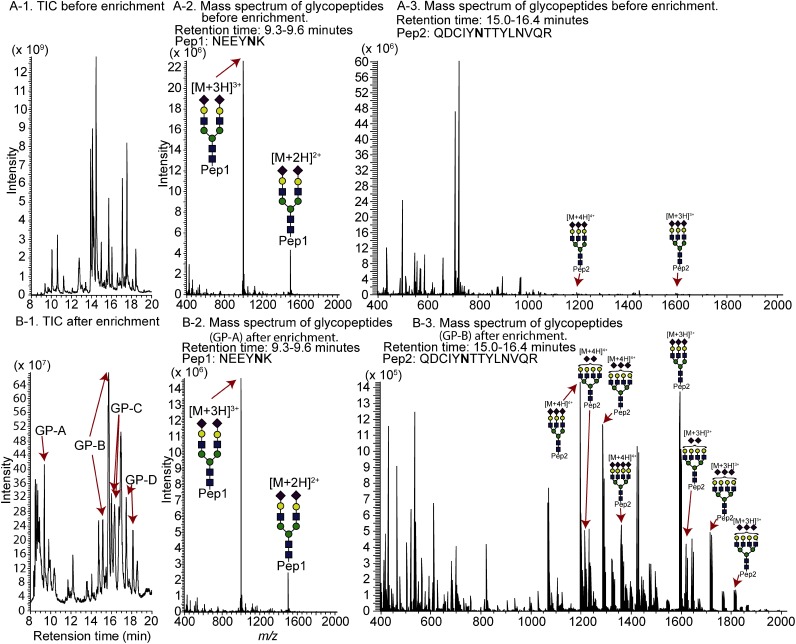
Figure 3 shows the effect of enriching the α1-acid glycoprotein, which contains biantennary, triantennary, and tetra-antennary glycans. After enrichment, many peptide peaks disappear, and glycopeptide peaks (GP-A, B, C, and D) become detectable (Figs. 3A-1 and 3B-1). However, the intensity of glycoform ion peaks of GP-A at 9.3–9.6 min is reduced after the enrichment (Figs. 3A-2 and 3B-2, Table 2). In contrast, several glycoform ion peaks of GP-B at 15.0–16.4 min become more intense after enrichment (Figs. 3A-3 and 3B-3). The amino acid sequence of GP-A is NEEYNK, which is relatively hydrophilic. The glycopeptides GP-A pass through the RPlayer during re-enrichment with H2O because 80% of the acetonitrile solution remains in the cellulose layer. The cellulose/RP StageTips are suitable for enriching glycosylated peptides consisting of hydrophobic amino acid residues.
Fig. 3. TIC chromatogram of α1-acid glycoprotein before (A-1) and after (B-1) glycopeptide enrichment, and mass spectra of glycopeptides before (A-2 and A-3) and after (B-2 and B-3) glycopeptide enrichment.
Table 2. Intensity ratios of glycopeptides of α1-acid glycoprotein after/before enrichment.
“Pep1” and “Pep2” indicate amino acid sequences NEEYNK and QDCIYNTTYLNVQR, respectively. (mean±S.D., n=4)
Enrichment of IgG1 glycopeptide by the StageTip
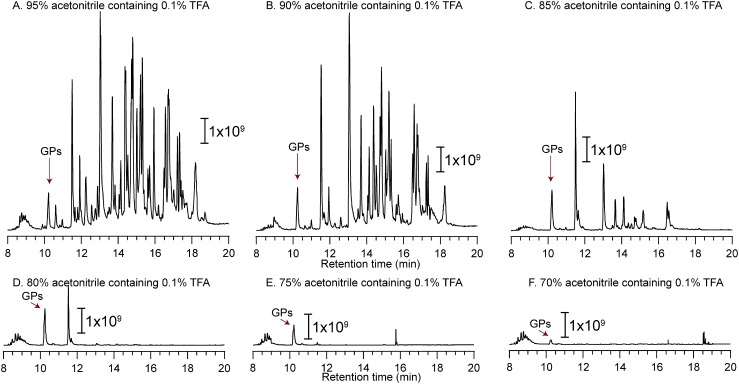
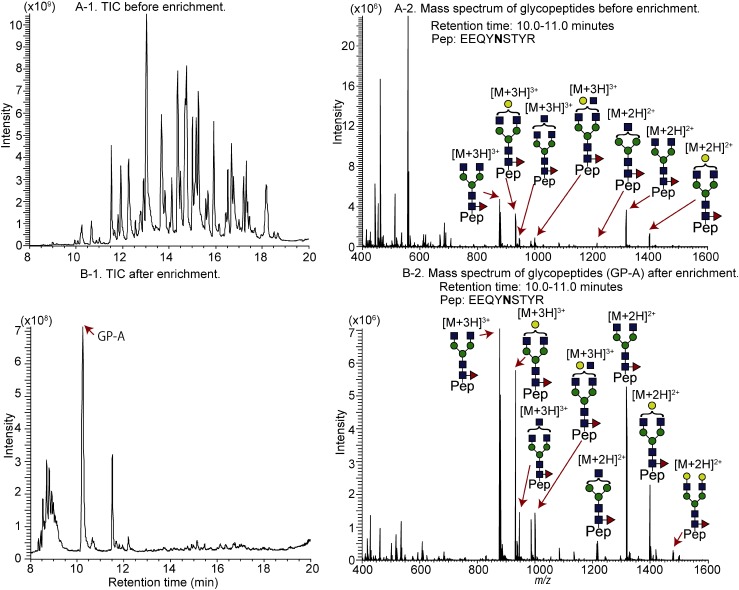
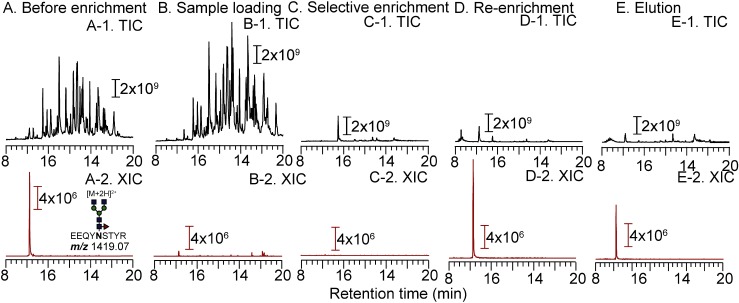
Nonspecific adsorption was observed when N-glycosylated peptides derived from IgG1 were loaded and washed with 95, 90, and 85% acetonitrile/0.1% TFA (Figs. 4A, 4B, and 4C). The glycopeptides are weakly retained on microcrystalline cellulose when 70 and 75% acetonitrile/0.1% TFA is used for the enrichment (Figs. 4E and 4F). The recovery is increased when 80% acetonitrile is used for the IgG1 glycopeptides (Fig. 4D). The TIC chromatograms of non-enriched and enriched IgG1 glycopeptides (Figs. 5A-1 and 5B-1), as well as full mass scans of GP-A at 10.0–11.0 min (Figs. 5A-2 and 5B-2), revealed that the Stage Tip is relatively selective. However, the intensity ratios of glycoforms are almost 100%, suggesting that the glycopeptides are not completely adsorbed on the RP layer. Based on the results for RNase B and α1-acid glycoprotein, sufficient enrichment of glycopeptides tends to enhance the peak intensities of glycopeptides by reducing the level of ionization suppression. Thus, we measured the flow through fractions after loading an IgG1 tryptic digest (1 μg of 1 μg/μL). Figure 6 shows the TIC chromatograms and the extracted-ion chromatogram (XIC; m/z 1419.07, fucosyl biantennary: G0F) of non-enriched samples (Figs. 6A-1 and A-2; 50 ng of tryptic digest), those obtained after sample loading (Figs. 6B-1 and B-2; 50 ng of tryptic digest origin), selective enrichment (Figs. 6C-1 and C-2; 50 ng of tryptic digest origin), re-enrichment (Figs. 6D-1 and D-2; 50 ng tryptic digest origin), and elution (Figs. 6E-1 and E-2; 50 ng tryptic digest origin). Compared with the peak intensity of non-enriched G0F (Fig. 6A-2), the intensity of G0F is higher after sample loading (Fig. 6D-2) and selective enrichment (Fig. 6E-2). We estimate that about 60% of the glycopeptides are leaked in the re-enrichment step, and 30% is recovered in the elution step. For the enrichment of hydrophilic glycopeptides (e.g., IgG1 glycopeptides), the flow-through fraction, which is obtained after re-enrichment, must be combined with the eluted fraction and then dried for maximizing the recovery ratios. It is noteworthy that the peak intensities of the respective glycoforms are nearly the same, suggesting that the distribution of glycoforms does not change after the StageTip treatment (Table 3). Fucose and galactose residues in glycans on mAbs affect both ADCC and CDC. Therefore, glycans on mAbs showing ADCC and CDC should be controlled and monitored in the manufacturing process. Our cellulose-RP StageTips method is suitable for monitoring mAbs glycans, because it is easy, disposable, glycoform independent, and has a carry-over free format.
Fig. 4. Total ion current (TIC) chromatogram of IgG1 after glycopeptide enrichment with 0.1% TFA/95% acetonitrile (A), 0.1% TFA/90% acetonitrile (B), 0.1% TFA/85% acetonitrile (C), 0.1% TFA/80% acetonitrile (D), 0.1% TFA/75% acetonitrile (E), and 0.1% TFA/70% acetonitrile (F) as sample loading and selective enrichment solutions (Figs. 1G and 1H). “GPs” indicates glycopeptides.
Fig. 5. Total ion current (TIC) chromatogram of IgG1 before (A-1) and after (B-1) glycopeptide enrichment and mass spectra of glycopeptides before (A-2) and after (B-2) glycopeptide enrichment.
Fig. 6. Total ion current (TIC) chromatogram and extracted-ion chromatogram (XIC) of 50 ng of IgG1 (A-1 and A-2) and flow-through fractions of sample loading (B-1 and B-2, 50 ng origin), selective enrichment (C-1 and C-2, 50 ng origin) and re-enrichment (D-1 and D-2, 50 ng origin).
Table 3. Intensity ratios of glycopeptides of IgG1 after/before enrichment.
“Pep” indicates amino acid sequence EEQYNSTYR. (mean±S.D., n=4)
Enrichment of O-glycosylated glycopeptides
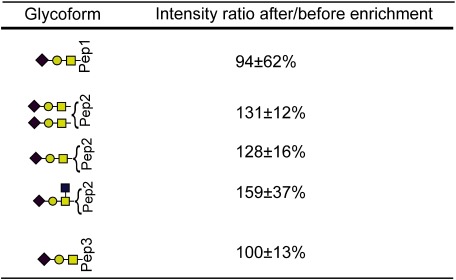
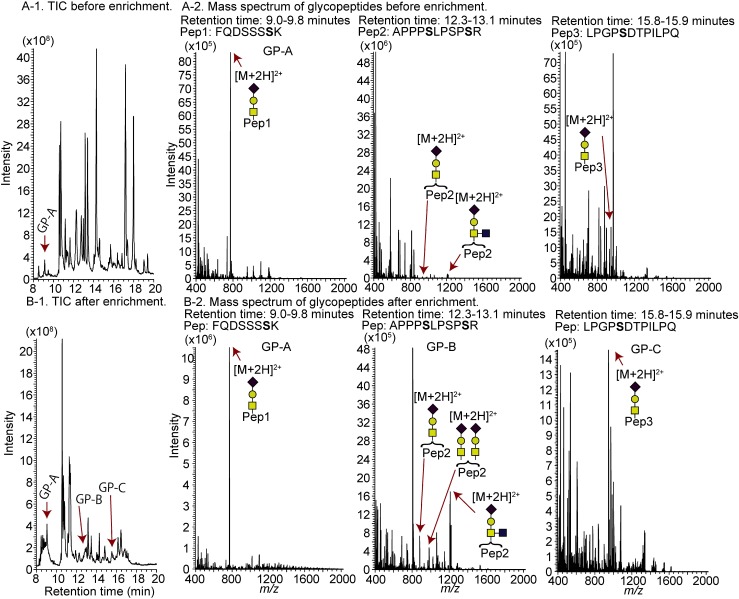
We next attempted to enrich the O-linked glycopeptides (peak area ratio, Table 4). Because O-linked glycans are smaller than N-linked glycans, a higher acetonitrile concentration (90% acetonitrile/0.1% TFA) is used for enriching O-glycosylated glycopeptides than for N-glycosylated glycopeptides. Before enrichment, the observed glycopeptide peaks are minor (Fig. 7A-1), whereas, after enrichment, they are major (Fig. 6A-2). Although the enrichment of O-glycosylated glycopeptides is not as effective as the enrichment of N-glycosylated glycopeptides, owing to the nonspecific absorption of peptides, we conclude that this method can also be used to enrich O-glycosylated glycopeptides.
Table 4. Intensity ratios of glycopeptides of hCG after/before enrichment.
“Pep1,” “Pep2,” and “Pep3” indicate amino acid sequences FQDSSSSK, APPPSLPSPSR, and LPGPSDTPILPQ, respectively. (mean±S.D., n=4)
Fig. 7. TIC chromatogram of hCG before (A-1) and after (B-1) glycopeptide enrichment and mass spectra of glycopeptides before (A-2) and after (B-2) glycopeptide enrichment.
CONCLUSION
We report on the development of a method for enriching small amounts of glycopeptides using cellulose reversed-phase StageTips. Enrichment of N-linked and O-linked glycopeptides can be achieved at the micro to nanogram level within a few minutes.
Author Contributions
Y.O. conceived the basis for the methodology, performed the experiments, wrote the paper, and designed and developed the cellulose-RP tip. N.K. conceived the methodology, designed, and developed the cellulose-RP tip. K.K. performed the N-linked glycopeptide enrichment. M.M. performed the actual O-linked glycopeptide enrichment.
Notes
The authors declare no competing financial interest.
Abbreviations
LC, liquid chromatography; MS, mass spectrometry; nanoLC, nano liquid chromatography
Acknowledgments
This research is supported by the Japan Agency for Medical Research and Development (AMED) through its Funding Program for Basic Science and Platform Technology Program for Innovative Biological Medicine, development of a glycosylation analysis, and control system to manufacture functionalized glycoprotein products.
Mass Spectrom (Tokyo) 2017; 6(1): A0061
References
- 1) K. W. Moremen, M. Tiemeyer, A. V. Nairn. Vertebrate protein glycosylation: Diversity, synthesis and function. Nat. Rev. Mol. Cell Biol. 13: 448–462, 2012. [DOI] [PMC free article] [PubMed] [Google Scholar]
- 2) R. M. Anthony, F. Nimmerjahn, D. J. Ashline, V. N. Reinhold, J. C. Paulson, J. V. Ravetch. Recapitulation of IVIG anti-inflammatory activity with a recombinant IgG Fc. Science 320: 373–376, 2008. [DOI] [PMC free article] [PubMed] [Google Scholar]
- 3) C. Xu, D. T. Ng. Glycosylation-directed quality control of protein folding. Nat. Rev. Mol. Cell Biol. 16: 742–752, 2015. [DOI] [PubMed] [Google Scholar]
- 4) J. Xue, L. P. Zhu, Q. Wei. IgG-Fc N-glycosylation at Asn297 and IgA O-glycosylation in the hinge region in health and disease. Glycoconj. J. 30: 735–745, 2013. [DOI] [PubMed] [Google Scholar]
- 5) W. R. Strohl, D. M. Knight. Discovery and development of biopharmaceuticals: Current issues. Curr. Opin. Biotechnol. 20: 668–672, 2009. [DOI] [PubMed] [Google Scholar]
- 6) A. Natsume, R. Niwa, M. Satoh. Improving effector functions of antibodies for cancer treatment: Enhancing ADCC and CDC. Drug Des. Devel. Ther. 3: 7–16, 2009. [PMC free article] [PubMed] [Google Scholar]
- 7) L. Liu. Antibody glycosylation and its impact on the pharmacokinetics and pharmacodynamics of monoclonal antibodies and Fc-fusion proteins. J. Pharm. Sci. 104: 1866–1884, 2015. [DOI] [PubMed] [Google Scholar]
- 8) A. M. Scott, J. D. Wolchok, L. J. Old. Antibody therapy of cancer. Nat. Rev. Cancer 12: 278–287, 2012. [DOI] [PubMed] [Google Scholar]
- 9) G. Zauner, M. H. Selman, A. Bondt, Y. Rombouts, D. Blank, A. M. Deelder, M. Wuhrer. Glycoproteomic analysis of antibodies. Mol. Cell. Proteomics 12: 856–865, 2013. [DOI] [PMC free article] [PubMed] [Google Scholar]
- 10) H. Liu, N. Zhang, D. Wan, M. Cui, Z. Liu, S. Liu. Mass spectrometry-based analysis of glycoproteins and its clinical applications in cancer biomarker discovery. Clin. Proteomics 11: 14, 2014. [DOI] [PMC free article] [PubMed] [Google Scholar]
- 11) Y. Wada, M. Tajiri, S. Yoshida. Hydrophilic affinity isolation and MALDI multiple-stage tandem mass spectrometry of glycopeptides for glycoproteomics. Anal. Chem. 76: 6560–6565, 2004. [DOI] [PubMed] [Google Scholar]
- 12) M. Tajiri, S. Yoshida, Y. Wada. Differential analysis of site-specific glycans on plasma and cellular fibronectins: Application of a hydrophilic affinity method for glycopeptide enrichment. Glycobiology 15: 1332–1340, 2005. [DOI] [PubMed] [Google Scholar]
- 13) J. Rappsilber, M. Mann, Y. Ishihama. Protocol for micro-purification, enrichment, pre-fractionation and storage of peptides for proteomics using StageTips. Nat. Protoc. 2: 1896–1906, 2007. [DOI] [PubMed] [Google Scholar]


