

ABSTRACT
Colistin is a last-resort antibiotic commonly used against multidrug-resistant strains of Pseudomonas aeruginosa. To investigate the potential for in situ evolution of resistance against colistin and to map the molecular targets of colistin resistance, we exposed two P. aeruginosa isolates to colistin using a continuous-culture device known as a morbidostat. As a result, colistin resistance reproducibly increased 10-fold within 10 days and 100-fold within 20 days, along with highly stereotypic yet strain-specific mutation patterns. The majority of mutations hit the pmrAB two-component signaling system and genes involved in lipopolysaccharide (LPS) synthesis, including lpxC, pmrE, and migA. We tracked the frequencies of all arising mutations by whole-genome deep sequencing every 3 to 4 days to obtain a detailed picture of the dynamics of resistance evolution, including competition and displacement among multiple resistant subpopulations. In 7 out of 18 cultures, we observed mutations in mutS along with a mutator phenotype that seemed to facilitate resistance evolution.
KEYWORDS: Pseudomonas aeruginosa, colistin resistance, experimental evolution, morbidostat
INTRODUCTION
The surge of multidrug resistance has evolved into a serious complication of modern medicine (1). Particularly dangerous is Pseudomonas aeruginosa, a Gram-negative pathogen known to cause severe infections with high mortality rates in immunocompromised individuals (2). Antibiotic drug resistance exacerbates this situation (3, 4). Extensively drug-resistant (XDR) hospital strains are often susceptible only to colistin, which has become an indispensable drug of last resort (5).
Colistin belongs to the polymyxin family and has a broad activity against most clinically relevant Gram-negative bacteria. Polymyxin B and polymyxin E (colistin) are currently used in clinical settings. Both substances interact with fatty acids and phosphates of lipopolysaccharide (LPS) core and lipid A moieties in the outer membrane of Gram-negative bacteria, which leads to cell lysis and death (6). The worldwide rise in infections caused by XDR P. aeruginosa (7) and other Gram-negative bacteria has given polymyxins the status of a last-resort treatment option despite their considerable neuro- and nephrotoxicity (8). Resistance to colistin has been found to be caused by the phosphoethanolamine transferase enzyme MCR-1, the gene for which is located on mobile genetic elements (9, 10). Besides mobile elements, a series of chromosomal mutations can result in colistin resistance. These mutations alter the outer membrane of P. aeruginosa by addition of 4-amino-4-deoxy-l-arabinose (l-Ara4N) to phosphate groups of the LPS lipid A region. The resulting reduced negative charge decreases the uptake of polycationic antimicrobial peptides and lipopeptide polymyxins (11). This modification is typically induced by enzymes that are encoded in the arnBCADTEF-PA3559 (PA3552-PA3559) operon (12). This operon is regulated by several two-component systems that can promote arnB transcription, resulting in increased LPS modification (13, 14). Two two-component systems involved in resistance to colistin are pmrAB and phoPQ (15, 16), which directly or indirectly regulate the arnBCADTEF operon (12, 14). Despite the characterization of the role of these loci in colistin resistance, the evolutionary dynamics of colistin resistance remain poorly understood and reported adaptive mutations are likely to be incomplete. Since progression of colistin-susceptible to -resistant strains under antibiotic exposure is increasingly reported in clinical settings (17–20), it is important to understand how fast and via which mutations colistin resistance emerges under antibiotic stress.
Recent advances in sequencing technology have made it possible to follow the evolution of bacterial populations over long times and in great detail (21). Evolution experiments are particularly valuable to explore and recapitulate the pathways along which resistance evolves, the nature and order of mutations that arise, and the speed at which resistance emerges. Toprak et al. (22) have presented a detailed study of resistance evolution in Escherichia coli under sustained selection pressure for resistance using a custom-made device called a morbidostat. The morbidostat continuously adjusts the concentration of antibiotics to maintain a constant growth rate of bacteria in stirred liquid culture. The bacteria are challenged just enough that they still grow but are under strong pressure to evolve resistance. By sequencing the evolving E. coli populations, Toprak et al. (22) showed how mutations accumulated and affected antibiotic resistance.
In this investigation, we used a customized morbidostat setup to study the evolution of colistin resistance in two clinical P. aeruginosa isolates. Specifically, we investigated how rapidly colistin resistance emerges and whether different isolates evolve colistin resistance via similar mutations. All cultures from both isolates evolved resistance within 2 weeks and increased their colistin MIC in liquid culture about 100-fold. On plates, the increase in the MIC was less pronounced. In agreement with previous characterizations of colistin or polymyxin resistance in P. aeruginosa and other bacteria (14, 16, 17), we observed the rapid emergence and spread of diverse mutations in pmrB and other genes involved in lipid A and lipopolysaccharide synthesis. The evolution of resistance sometimes went along with mutator phenotypes (due to mutations in mutS), which increased the mutation rate approximately 100-fold.
RESULTS
Characteristics of patient isolates.
Two clinical isolates (PA77 and PA83) which originated from two different patients with P. aeruginosa bloodstream infections were investigated. Both strains exhibited extensively drug-resistant phenotypes (23), being nonsusceptible to all antibiotics except colistin (PA77 and PA83) and fosfomycin (PA77). Multilocus sequence typing (MLST) revealed that PA77 belonged to sequence type 308 (ST308) and PA83 to ST233 (24).
Whole-genome sequences of patient isolates.
We sequenced the strains PA77 and PA83 with ≥98× coverage using PacBio long-read sequencing technology. Together with high-fidelity short reads from the Illumina HiSeq platform, we were able to assemble one circular chromosome with a length of 6.82 Mb and one 398-kb plasmid for strain PA83, while the assembly of strain PA77 resulted in three contigs of 3.69 Mb, 2.30 Mb, and 0.994 Mb and one circular plasmid of 40.0 kb. The plasmid of PA77 had consistently 2- to 3-fold-higher coverage than the chromosome, suggesting that it is present in multiple copies (see average coverage in Data Sets S1 and S2 in the supplemental material).
The 40-kb plasmid of PA77 contained several resistance genes (including blaIMP-8 as identified by resFinder [25]). The majority of resistance genes (including blaVIM-2) of PA83 reside in the chromosome. resFinder results for both strains are available in Tables S1 and S2 in the supplemental material.
In vitro resistance evolution against colistin.
We performed three replicated experiments (two for strain PA77 with four and five parallel cultures and one experiment for strain PA83 with nine parallel cultures) selecting for colistin resistance mutations in a modified morbidostat setup (26). Our morbidostat can culture 15 populations in parallel. We used a culture volume of 20 ml of LB medium and maintained cultures at an optical density at 600 nm (OD600) around 0.1, corresponding to about ∼4 × 10⁸ bacteria per culture (27). The optical density of each culture was monitored every 30 s. Every 10 min, a computer program calculated the rate at which the bacteria grew and the colistin concentration in the vials was increased or decreased by adding concentrated colistin solution or medium, respectively. The decisions to increase or decrease the concentration were made automatically by the computer program as described in Materials and Methods.
In contrast to the antibiotics used by Toprak et al. (22), colistin is a bactericidal antibiotic resulting in less stable feedback on growth. Sometimes, we observed sudden population collapse when the colistin concentration increased by small amounts. These sudden collapses were observed only during the first 10 days, before substantial resistance emerged.
We focus here on the second experiment with strain PA77, in which five parallel cultures (vials v01 to v05) were selected for colistin resistance. The first experiment with strain PA77 (described in the supplemental material) delivered similar results but ran for only 15 days. The experiment with strain PA83 (9-fold replicated) also showed similar patterns of evolution. However, frequent mutator phenotypes (see below) and erroneous concentrations of colistin stock solutions used for 6 of the 22 days of this experiment make this run less interpretable.
In each of the experiments, we took samples three times a week for deep sequencing, plated cultures to check for possible contamination, and performed Etests to assess resistance against colistin on plates. In parallel, we inferred the concentration of colistin in the liquid cultures from the known schedule of colistin additions and dilutions for each vial. Both resistance measurements are shown in Fig. 1 and 2 (see Fig. S2 in the supplemental material for results of another 2-week experiment with strain PA77). The MICs of the initial cultures and the evolved population on the final day of the experiment were further determined by broth microdilution in five replicates each.
FIG 1.
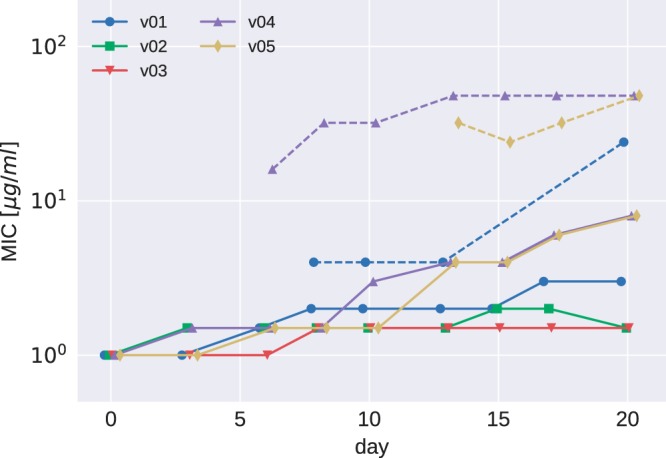
Etest results for PA77. MICs determined in Etests increased moderately over the course of the experiments (v01 to v05 are the five culture vials for strain PA77). Subpopulations showing a MIC higher than that of the main population were observed in some vials after 7 days and are indicated by dashed lines.
FIG 2.
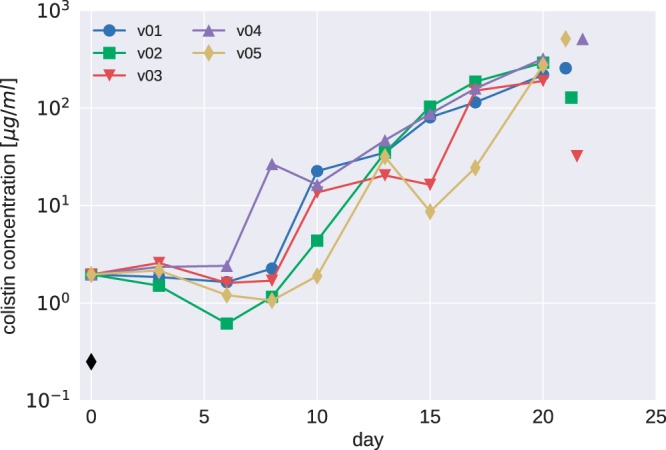
Colistin concentrations during morbidostat culture of PA77. The colistin concentration necessary to inhibit growth in the morbidostat increased much more dramatically than MICs measured in Etests. Colistin concentrations are given in units of the MIC of the initial cultures (2.8 μg/ml). The MICs determined by broth microdilution are indicated by the black diamond (initial strain) and isolated colored symbols (endpoints of each vial).
The colistin concentration in the morbidostat increased about 10-fold between days 7 and 12 and further increased 10-fold toward the end of the experiment (Fig. 2). A much less pronounced increase in colistin resistance was observed in Etest measurements on plates (Fig. 1). In addition to the 2- to 10-fold increase of the colistin MIC of the bulk population, some evolved populations contained subpopulations with higher colistin MICs (dashed lines in Fig. 1). These subpopulations, which grew as morphologically smaller colonies, arose for the first time after 7 days of colistin treatment of strain PA77.
To further investigate the discrepancy between resistance testing results using Etests and the much larger increase of colistin concentration in the morbidostat, we determined the MICs of all initial and final cultures using broth microdilution. Consistent with the colistin concentration increase in the morbidostat, we observe a 100- to 1,000-fold increase in MICs in broth (Fig. 2; see also Fig. S2 and S5).
Convergent evolution in genes involved in LPS synthesis.
Mutations in genes in which we observed mutant alleles in at least two cultures of PA77 are summarized in Table 1. All cultures developed mutations in pmrB; one which yielded a V9A substitution was observed in culture vials v01 and v03. These mutations presumably result in constitutive activity of pmrB (17). Besides mutations in pmrB, strain PA77 developed repeated mutations in a gene coding for a UDP-glucose-6-dehydrogenase (pmrE, also known as udg), which is involved in aminoarabinose synthesis and results in l-Ara4N addition to the LPS (14). Codon 28 of pmrE was hit multiple times, resulting in four Y28C and five Y28N mutations across both experiments with PA77. The gene product of pmrE is known to be a tyrosine phosphorylation target and has been implicated in colistin resistance evolution in E. coli (28). Interestingly, position 28 is a cysteine in the majority of P. aeruginosa reference genomes and PA83, which might indicate intrinsic resistance and explain the absence of pmrE mutations in PA83.
TABLE 1.
Mutations repeatedly observed in cultures of strain PA77a
| Gene | Locus tag |
Mutation(s) in: |
|||||||||
|---|---|---|---|---|---|---|---|---|---|---|---|
| PAO1 | PA77 | v01 | v02 | v03 | v04 | v05 | v05a | v08a | v10a | v11a | |
| pmrB | PA4777 | PSA77_03611 | V9A, L17Q | L90Q, E320K | V9A | P216Q | P254L | P169X, M292I | S257N | N41I, P169X | H261Y |
| pmrE | PA2043 | PSA77_06074 | Y28N | Y28C | Y28N | Y28C | Y28N | Y28C | Y28C | Y28N | Y28N |
| lptD | PA3559 | PSA77_05098 | Y803X | L538R | |||||||
Vials v01 to v05 refer to the experiment discussed in the text; v05a, v08a, v10a, v11a stem from the preliminary experiment with strain PA77, which ran for only 15 days. The full list including annotation of each mutation is available in Data Set S3 in the supplemental material.
In addition to the recurrent mutations in pmrB and pmrE, two cultures of our preliminary experiment with PA77 evolved mutations in lptD. LptD has been described as an essential outer membrane protein (29) that mediates the transport of LPS to the outer membrane (30). Mutations in lptD have been shown to contribute to colistin resistance in Acinetobacter baumannii (31). However, an 11-residue deletion in lptD did not result in colistin resistance in P. aeruginosa (32). A full list of all mutations observed in PA77 at frequencies above 25% is provided in Data Set S3.
Many more mutations were observed in the experiment with isolate PA83 (Table 2). PA83 repeatedly mutated lpxC, which codes for a UDP-3-O-[3-hydroxymyristoyl]-N-acetylglucosamine deacetylase, which participates in the biosynthesis of lipid A and could, therefore, be involved in the progression to colistin resistance as shown in P. aeruginosa (18) and Acinetobacter baumannii (31). The gene was mutated in every culture of PA83 and suffered from multiple mutations in 5 out of 10 vials. All mutations were nonsynonymous, and the V222A and A107T mutations were shared among 3 cultures. In addition to lpxC, all PA83 cultures developed mutations in pmrB with yet another V9A substitution. Three out of nine cultures mutated pmrA, and seven out of nine mutated the gene migA, which codes for an alpha-1,6-rhamnosyltransferase, a glycosyltransferase thought to be involved in the lipopolysaccharide core region synthesis (33). Additional recurrent mutations were observed in lpxO2 (which encodes a lipopolysaccharide biosynthetic protein), in an asparagine synthase gene, a putative acetyltransferase gene, and several other genes (Table 2). A number of mutations observed in only one or two strains clustered around the pmrAB locus. A full list of all detected mutations is provided in Data Set S4. Overall, many more mutations arose in PA83 than in PA77. This excess of mutations might be partly explained by the frequent rise of mutator phenotypes (see below), but even cultures without high-frequency mutS mutations accumulated more mutations than PA77 cultures. Cultures without a high-frequency mutS mutation appeared to have a low wild-type-compatible mutation rate (as suggested by the almost complete lack of synonymous mutations; see below).
TABLE 2.
Mutations repeatedly observed in cultures of strain PA83a
| Gene | Locus tag |
Mutation(s) in: |
|||||||||
|---|---|---|---|---|---|---|---|---|---|---|---|
| PAO1 | PA83 | v02 | v03 | v05 | v06 | v08 | v11 | v12 | v14 | v15 | |
| lpxC | PA4406 | PSMA83_05042 | P101S | V222A, S106G | V222A | V164G, A107T | A107T, G21W, F176S | A107T, I131F | M103I | D232E, D232G, V217F, V217A | V222A, S106G |
| pmrB | PA4777 | PSMA83_05449 | L96R | L171P | L87P | F51L | S8P, E320K | V9A | G123S | E320K, A248T, L167P | R259H, V361M |
| Gene for putative transferase | PA3853 | PSMA83_01172 | C226G | Y3C, G62S | V34A, Y155C | C226G | R60C, Y216C, E185G | C226G | V122A, E185G | ||
| Gene for asparagine synthetase | PSMA83_05677 | L365P | Frameshift | L425P | G32S | Frameshift | W153X | L365P, W153X V286M | |||
| migA | PA0705 | PSMA83_04868 | H219P | C25R, N27S | D106G | Q191R, V22A | T196P, H123P | H219P | A168T | ||
| mutS | PA3620 | PSMA83_01420 | T51P | T51P | T51P | T51P | T51P | T51P, T287P | |||
| lpxO2 | PA0936 | PSMA83_04590 | D163A | D163N | W209X | D163A | Frameshift | In-frame deletion | |||
| pmrA | PA4776 | PSMA83_05448 | L11Q | L11P | R159L, G15V, N172D | ||||||
| Gene for putative outer membrane protein | PA3647 | PSMA83_01392 | K122X | Frameshift | V1V, R2G | ||||||
| Gene for paraquat-inducible protein | PSMA83_05349 | G180X | Frameshift | ||||||||
| 1 | PA4773 | PSMA83_05445 | W35X | Frameshift | |||||||
| cupB5 | PA4082 | PSMA83_00934 | G260X, R26C | P139P | |||||||
| 2 | PA5133 | PSMA83_05845 | Frameshift | Frameshift | Frameshift | ||||||
| pdtA | PA0690 | PSMA83_04884 | A3885V, A3885A | G1527X | |||||||
| morA | PA4601 | PSMA83_05248 | R1199H | G143D | |||||||
| lpxA | PA3644 | PSMA83_01395 | R96S | R191C | |||||||
| priA | PA5050 | PSMA83_05733 | L38L | R689R | |||||||
| Gene for putative chemotaxis transducer | PA4633 | PSMA83_05281 | L315P | A260A | |||||||
| Gene for putative lipoprotein | PA3069 | PSMA83_01992 | K83R | L68P | |||||||
| traN | PSMA83_06409 | W773X | G912D | ||||||||
| Gene for polyketide synthase type I | PSMA83_02547 | I876M | V781V | ||||||||
| 3 | PA0242 | PSMA83_00250 | S420G | A579A | |||||||
| Gene for hypothetical protein | PA4782 | PSMA83_05455 | P38S | P38P | |||||||
| wbpM | PA3141 | PSMA83_01912 | E273K | E273G | |||||||
| mscL | PA4614 | PSMA83_05261 | V86I | S35P | |||||||
The complete list of mutations, including annotation and locus tag of each gene, is available in Data Set S4. For genes with long names, the table lists the PAO1 locus tag where available; the annotations of these genes are as follows: 1, putative S-adenosylmethionine decarboxylase proenzyme; 2, putative membrane-bound metallopeptidase; and 3, putative 4-hydroxyphenylpyruvate dioxygenase.
Dynamics of mutations.
Deep population sequencing (mean coverage > 150×) of the continuously cultured populations in the morbidostat allowed us to study the dynamics of mutations in the entire genome and to quantify the competition between different lineages.
During experiments with PA77, the first major increase in colistin tolerance was observed between days 7 and 10, concomitant with a quick rise of mutations in pmrE and pmrB (Fig. 3). Figure 3F shows the frequency trajectories of major mutations in vial v03. We observe an initial rapid rise of a mutation in pmrB (substitution V9A) to about 70%, followed by an intermittent reduction at day 7 before a variant with substitutions V9A (pmrB) and Y28N (pmrE) took over by day 10. Three other mutations reached high frequency in the second half of the experiments. Analogous graphs for all other vials are given in Fig. S1. The results of shorter (2-week) experiments are given in Fig. S3 and S4.
FIG 3.

Resistance evolution in PA77. Panels A to E show the dynamics of colistin concentration in liquid culture for each culture vial. This concentration is inferred from the cycles of colistin addition and waste removal in 10-min intervals. The shaded bars above the plots show the abundance of different mutations during the experiment. Time points at which a mutation reached a frequency above 95% are highlighted with white circles. The frequencies of pmrE (blue) and pmrB (red) mutations correlate well with colistin tolerance. The deep dips in colistin concentration every 2 to 3 days correspond to transfers to fresh culture vials and mark the time points at which samples were taken. Panel F shows the frequency trajectories of all mutations that reached 20% frequency in vial v03 (for analogous plots for other cultures, see Fig. S1).
Mutations in pmrB tend to occur first, followed by mutations in pmrE. In two of the PA77 cultures (v01 and v02), two different pmrB mutations were observed, and the initially successful mutant was later replaced by the other one, which also carried the mutation in pmrE. In culture v05, a transient mutation in pmrA was observed, which was outcompeted by a lineage carrying mutations in pmrB and pmrE. In cultures v01, v02, v03, and v04, additional mutations rose to intermediate frequencies during the last few days of the experiments (see Fig. S1), possibly explaining the increase in colistin tolerance during the second half of the experiment. The frequency trajectories of all mutations observed in PA77 are provided in Data Sets S5 and S6 for the 3-week and 2-week experiments, respectively.
In experiments with PA83, more complicated dynamics of mutations in three commonly mutated genes (pmrA, pmrB, and lpxC) were observed. In many cases the same gene was mutated independently several times at different positions and apparently functionally similar subpopulations competed. This higher diversity is possibly related to the almost ubiquitous mutator phenotypes observed (see below and the supplemental material). One clear example of such competition between multiple resistant clones can be seen in Fig. S8, vial v15. At day 10, two populations with complementary mutation in lpxC and pmrB competed against each other and oscillated in frequency from days 10 to 21. The time courses of colistin concentration for experiments with strain PA89 are given in Fig. S6; the trajectories of mutations are shown in Fig. S7 and S8 and provided in Data Set S7.
Preexisting variation.
A number of loci were already polymorphic in the initial samples, and the frequencies of these preexisting mutations changed over time as new adaptive mutations arose and the population composition changed (see Fig. S1, S4, S7, and S8). In the majority of cultures a particular subpopulation came to dominate. In PA77, the more successful subpopulation carried a P282S mutation at locus PSA77_01281, annotated as putative pseudouridylate synthase. This variant had a 40% frequency in the initial population and was at frequencies of >90% in 8 out of 9 cultures at the last time point. In PA83, all populations fixed the full-length allele of the sensory histidine kinase CreC (locus PSMA83_00508), even though 75% of the initial population had a premature stop at codon 319.
Mutator phenotypes.
Culture v02 of PA77 developed a mutator phenotype and had mutated mutS resulting in the substitution H21P. This variant rose rapidly in frequency between days 17 and 22 at the end of the experiment. In the last sample, 42 mutations were observed at high frequencies that were not apparent earlier. Even though we lack information on the linkage between these mutations, the most likely explanation is that they arose quickly after the mutation in mutS and were carried to high frequency through linkage with a mutation that conferred a benefit in the culture system. The mutS mutation might have been around for many days before it became frequent, and other mutations will have accumulated throughout this time. The full list of all observed mutations can be found in Data Sets S3 and S4, but mutations that likely arose in genomes already carrying a mutation in mutS are omitted from the graphs.
Mutator phenotypes were much more common in PA83, in which we observed dozens of unique mutations in seven out of nine cultures. In all of these cultures a mutation in mutS that resulted in T51P substitution was at high frequency. This mutation might have preexisted at very low frequency in the initial population and rose in frequency repeatedly because a high mutation rate facilitated resistance evolution. The majority of mutations that rose along with T51P in mutS were unique to each culture, suggesting that these mutations accumulated after the different cultures were inoculated.
In cultures with mutS mutations, we observed between 30 and 100 mutations (see Data Sets S3 and S4) above 20%, the majority of which were observed only in one culture and thus likely arose during culture in the morbidostat. Figure 4 shows the number of synonymous and intergenic mutations versus the number of nonsynonymous mutations observed in the last sample. Each mutation is weighed by its frequency in the population. In contrast to mutations in nonmutators, which are mostly within coding regions and result in amino acid differences, about one-third of mutations in mutator strains are synonymous or intergenic. The null hypothesis of equal synonymous/nonsynonymous ratios in the wild type and mutS mutants is rejected with a P value of 0.005. The most likely odds ratio is 10. The different ratio is consistent with most of these additional mutations being a random by-product of elevated mutation rates in the mutator strains.
FIG 4.
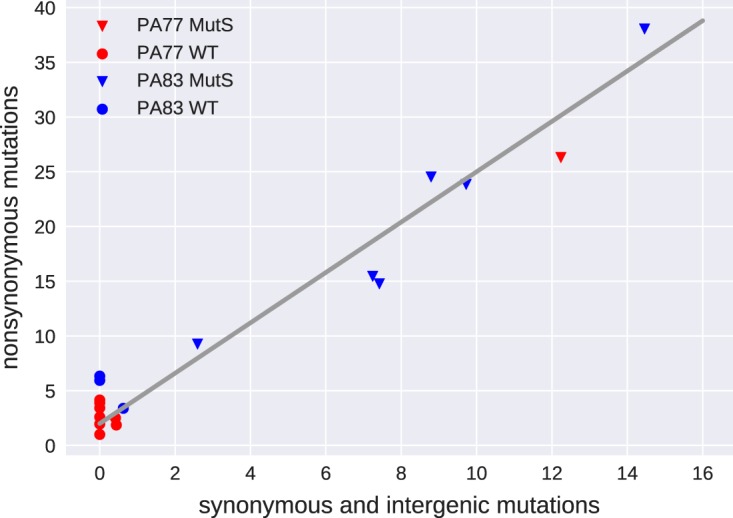
Mutation patterns in mutators and nonmutators. In cultures with no mutations in mutS, mostly nonsynonynous mutations are observed. Most populations carrying a mutation in mutS accumulated the expected mix of synonymous and nonsynonymous mutations. Mutations are weighted by their frequency in the final sample. WT, wild type.
In total, we observed 43 and 152 frequency-weighted synonymous and nonsynonymous mutations, respectively, after a total of 154 days of culture in the seven cultures with a mutS mutation. The overall mutation rate of mutator strains was, therefore, about 1.3 mutations per day. The morbidostat dilution forces a doubling time of 90 min. Hence, the observed mutation rate corresponds to about 0.08 mutation per replication. Given a genome size of 7 Mb, the mutation rate of mutator strains is on the order of 10−8 per site and generation compared to a typical wild-type mutation rate of 10−10 per site and generation (34).
Only synonymous mutations are suitable to compare the mutation rates of mutators and nonmutators, since most nonsynonymous mutations in nonmutators are likely adaptive in the presence of colistin. In cultures without mutations in mutS, the frequency-weighted number of synonymous mutations is 1.1 in 242 days of culture, while cultures with mutators accumulated 43 synonymous mutations in 154 days. These data suggest that the mutation rate of the mutS mutants is increased by approximately 2 orders of magnitude relative to that of the wild type, consistent with previous reports (35, 36).
Deletion mutations.
A small number of deletions were observed during resistance evolution. Two prominent almost adjacent deletions occurred in culture v05 of PA77 (Fig. 5) and partially deleted the metallo-beta-lactamase (MBL; encoded by blaIMP-8) and an aminoglycoside 3′-phosphotransferase [aph(3′)-XV]. The regulation of other resistance genes in the vicinity might also have been affected. The loss occurred between day 11 and day 18 in parallel with the spread of mutations in pmrE and pmrB. The disappearance has been confirmed by PCR, and the breakpoints in coverage are both supported by split reads. The deletions occurred at identical positions at the end of a duplicated stretch (bases 18666 to 19310 and 20647 to 21291 on the plasmid containing aacA4).
FIG 5.

Loss of resistance genes. One of the cultures (v05, PA77) lost two neighboring chunks on the plasmid gradually between day 11 and day 18. The block between 20647 and 21291 corresponds to a duplicated sequence also found at positions 18666 to 19310. Both breakpoints are confirmed by about 50% of reads, suggesting a bona fide double deletion.
While PCR was still positive for blaIMP-8 at day 14, it turned negative at day 21. Of note, resistance to meropenem and aminoglycosides remained unaltered in PA77 at day 21, suggesting that alternative mechanisms were responsible for the observed phenotype. Preservation of aminoglycoside resistance could have been mediated by additional resistance-conferring genes that are part of the PA77 plasmid [aacA4, aac(6′)Ib-cr, and aadA10; see Table S1] and that were not deleted. The preservation of meropenem resistance is less conclusive. None of the OXA enzymes found in PA77 hydrolyze carbapenems (37). However, a number of efflux systems that have been described to cause meropenem resistance when overexpressed have been identified in PA77 (see Table S1) and could explain the unaltered resistance phenotype (38).
DISCUSSION
The morbidostat continuously adjusts drug concentration such that bacteria are always challenged to evolve resistance against the drug while still being able to grow (22, 26). In contrast to transposon knockout screens for polymyxin resistance (39), direct selection for resistance by the morbidostat and whole-genome deep sequencing allows the unbiased detection of loss-of-function as well as gain-of-function mutations associated with resistance (40). Furthermore, compared to classical experimental setups to investigate antibiotic resistance evolution, such as serial dilution protocols or chemostats (18, 41), the morbidostat approach allows a higher degree of replication and control. Multifold replication is essential to quantify convergent evolution and prevalence of different evolutionary pathways and to map the mutations associated with resistance.
The continuously increasing but sublethal antibiotic concentrations in the morbidostat might simulate a clinical situation in which the antimicrobial agent does not reach lethal or inhibitory quantities in all compartments of the infection—a situation therapy should avoid if possible. Resistant bacteria might evolve in such insufficiently suppressed compartments and gradually spread while more resistance mutations accumulate. Baym et al. (42) have recently demonstrated that the kinetics of drug resistance evolution along spatial gradients is similar to the kinetics observed in the morbidostat. While the morbidostat is not intended as a faithful model of the situation in vivo, it is nevertheless useful to determine a bacterial population's capacity to spontaneously evolve resistance or to select already existing rare resistant mutants in a clinical setting. We have focused on colistin resistance since the recent increase in colistin use against XDR pathogens greatly increased the potential for resistance evolution against this last-resort drug. Understanding the pathways and kinetics of colistin resistance evolution is of paramount importance.
Colistin resistance in liquid culture increased 10-fold within approximately 10 days and 100-fold after 20 days in a bacterial population of ∼4 × 10⁸. MICs, as measured by Etest on plates, also increased consistently but only about 2-fold and 4-fold after 10 and 20 days, respectively. However, much more resistant subpopulations were visible on Etest plates in a fraction of the cultures after about 10 days. The discrepancy between liquid culture and Etest measurements of colistin tolerance could be explained by either the nature of the tests or a shift in the population composition that might have occurred while preparing cultures for Etests. Agar dilution, disk diffusion, and gradient diffusion have been reported to be problematic, and EUCAST has released a warning suggesting that only broth microdilution should be used for diagnostic testing at the moment (43). Adding to this concern, broth microdilution confirmed a >100-fold increase in colistin MIC in all cultures.
Selection for colistin tolerance resulted in a reproducible rise of mutation in pmrB and pmrE in strain PA77 and lpxC and pmrAB in PA83. The pmrE mutations in codon 28 reverted the position from a tyrosine to a cysteine shared by the majority of P. aeruginosa reference genomes in the NCBI database or an asparagine. Since strain PA77 is a clinical isolate with a complicated history of antibiotic exposure, it is not clear whether this mutation is a reversion of a previously adaptive mutation or a mutation that is specific to colistin resistance in the genetic background of PA77. Tyrosine phosphorylation of PmrE has been implicated in colistin resistance (28). Mutations in pmrA and pmrB have been previously reported to mediate colistin resistance (14, 16, 17, 44). Several of the pmrB mutations that arose in our experiments had been previously seen in clinical isolates (A248T, S257N, R259H, and M292I [17]). Most other mutations that arose repeatedly are involved in lipopolysaccharide synthesis and lipid A biosynthesis—as expected in case of colistin. Jochumsen et al. (18) recently reported mutations that arose during colistin resistance evolution during serial transfer to the laboratory strain PAO1. They also found parallel mutations in genes pmrB and lpxC. However, other loci that frequently mutated in experiments by Jochumsen et al. (18), such as PA5194 (8 out of 9) and PA5005 (5 out of 9), rarely mutated in our experiments. We found two mutations in homologs of PA5194 (a nonsense mutation in v02 of PA77 at locus PSA77_04096 and G77R in v03 of PA83 at locus PSMA83_05923) and no mutation in opr86 or at locus PA5005. PA5194 is sometimes annotated as yeiU and codes for a phosphoesterase. This gene is an ortholog of lpxT, the product of which adds phosphate groups to lipid A, and downregulation of lpxT is associated with polymyxin resistance (45). The activity patterns of LpxT in P. aeruginosa differ from those in other Gram-negative bacteria (46), but a role for the yeiU/lpxT product in polymyxin resistance is plausible.
We did not observe a strict order in which the mutations arose. While mutations in pmrB tend to be the first to rise to high frequency, mutations in pmrA and lpxC preceded mutations in pmrB in cultures v05 of PA77 and v02, v06, and v12 of PA83.
Taken together, these results suggest a common core of mutations in pmrB with otherwise strain-specific mutation patterns. Besides pmrB, PA77 mutated only pmrE in a reproducible fashion. PA83 always mutated lpxC and several other loci. This diversity of mutation paths to resistance highlights the importance of studying resistance evolution in strains with the relevant genetic and clinical background.
In pmrB and lpxC, many different mutations seem to contribute toward colistin resistance (14), resulting in a high rate at which colistin resistance emerges. We frequently observed multiple competing clones that carried different mutations. In culture v01 of PA77, for example, we observed pmrB substitutions yielding V9A and L17Q at frequencies above 20%, but only L17Q prevailed. In mutator strains of PA83, this competition between multiple variants was the rule rather than an exception.
The ease at which resistance evolved implies a difficult trade-off between minimizing colistin toxicity and the risk of resistance evolution during therapy. One reason why colistin-resistant strains do not emerge as frequently in clinical settings as in in vitro experiments could be fitness costs and impaired virulence associated with resistance. Lee et al. (11) observed rapid reversion of colistin resistance mutations in P. aeruginosa. Similarly, references 47 and 48 describe fitness costs of colistin resistance in Acinetobacter baumannii isolates, while others also reported an inhibited growth of colistin-resistant LPS mutants in fetal bovine serum (49) and a decreased production of capsular polysaccharides in a Klebsiella pneumoniae strain (50). Membrane modification associated with colistin resistance might further reduce clinical invasiveness, possibly due to a lower ability to attach to host epithelium cells, resulting in a lower colonization potential and a “flushing away” from the invasion site. Furthermore, the number of bacteria that experience sublethal drug concentrations during therapy is typically much smaller than the population sizes used in in vitro experiments, which reduces the probability of resistance evolution in clinical settings.
Our results underscore the potential importance of mutator phenotypes in bacterial resistance evolution, as also reported by Jochumsen et al. (18). Once the mutation rate is high, drug resistance mutations are much more rapidly discovered in the mutator lineage, in particular when multiple mutations are necessary to convey full resistance (35, 36, 51). Our estimate of the mutation rate suggests that in cultures dominated by mutator strains, most mutations are produced every generation (the product of mutation rate and population size exceeds 1), while in the absence of mutator alleles, a specific mutation would take a few days to be discovered. However, the mutational target is much larger than a single site—in particular in pmrA/B and lpxC—such that resistance evolved rapidly even in cultures with no dominant mutator phenotype.
The highly parallelized morbidostat approach enabled us to explore the diversity of evolutionary trajectories of resistance development. One limitation of our study is that we have investigated only two clinical strains and are thus not able to draw general conclusions about a potentially common timeline of mutations toward colistin resistance. Investigation of many clinical strains might reveal common trajectories and high-risk mutations that do not yet cause clinical resistance but predispose a strain to become fully resistant. Such preresistance marker could be clinically useful to decide whether a combination treatment—if possible, especially with aminoglycosides—should be started that would have been otherwise avoided due to concerns about cumulative toxicity. This way, findings from in vitro evolutionary experiments could provide knowledge that can be translated into routine diagnostics and treatment, eventually improving our therapeutic concepts and patient care.
MATERIALS AND METHODS
Bacterial strains.
The two P. aeruginosa strains, PA77 and PA83, were recovered from the blood of two adult patients that were hospitalized at the Department of Hematology of the hospital of University of Tübingen (24). Species identification was conducted using a linear matrix-assisted laser desorption ionization–time of flight (MALDI-TOF) mass spectrometer (AXIMA Assurance, bioMérieux, Marcy l'Etoile, France; Saramis database version 4.09).
Morbidostat and experimental procedures.
The morbidostat system was built by following the detailed instructions by Toprak et al. (26), with the following modifications: we used (i) DC pumps instead of AC pumps arranged in a different geometry, (ii) an Arduino mega256 microcontroller instead of the MC DAQ card, and (iii) custom Python control software instead of the Matlab-based software provided by Toprak et al. (26). The custom-written control software is available at https://github.com/neherlab/python_morbidostat. In addition, the outlets of the three separate pumps for each culture vial were combined such that only one tube ran from the pump array to each culture vial inside the incubator. The culture volume of each vial was 20 ml, and the target optical density was 0.1. Cultures were kept in an incubator at 37°C. The changes to the design made the morbidostat system substantially cheaper and easier to operate.
Before each experiment, the setup was sterilized as suggested in reference 26. The MIC of the strains was inferred by cultivating them at several different colistin concentrations slightly above and below a rough estimate of the MIC. The initial MICs in the morbidostat were found to be 2.8 μg/ml and 4.8 μg/ml for strains PA77 and PA83, respectively.
All morbidostat experiments were started with 7× and 25× MICs in the colistin reservoirs. As P. aeruginosa population developed resistance, the colistin concentrations in the reservoirs was increased such that growth could be regulated by addition of colistin solution from these reservoirs.
The morbidostat recorded the optical density in each vial every 30 s. After 10 min, the growth rate of each vial was calculated. Depending on the rate of growth and the optical density in the vial, either pure medium was added to dilute the culture and increase growth or colistin solution (low or high concentration) was added to inhibit growth. The target growth rate was set to a doubling time of 90 min, and we used a target OD of 0.1. Figure 6 shows a flowchart detailing the conditions used to determine whether culture is diluted with medium or colistin solution.
FIG 6.
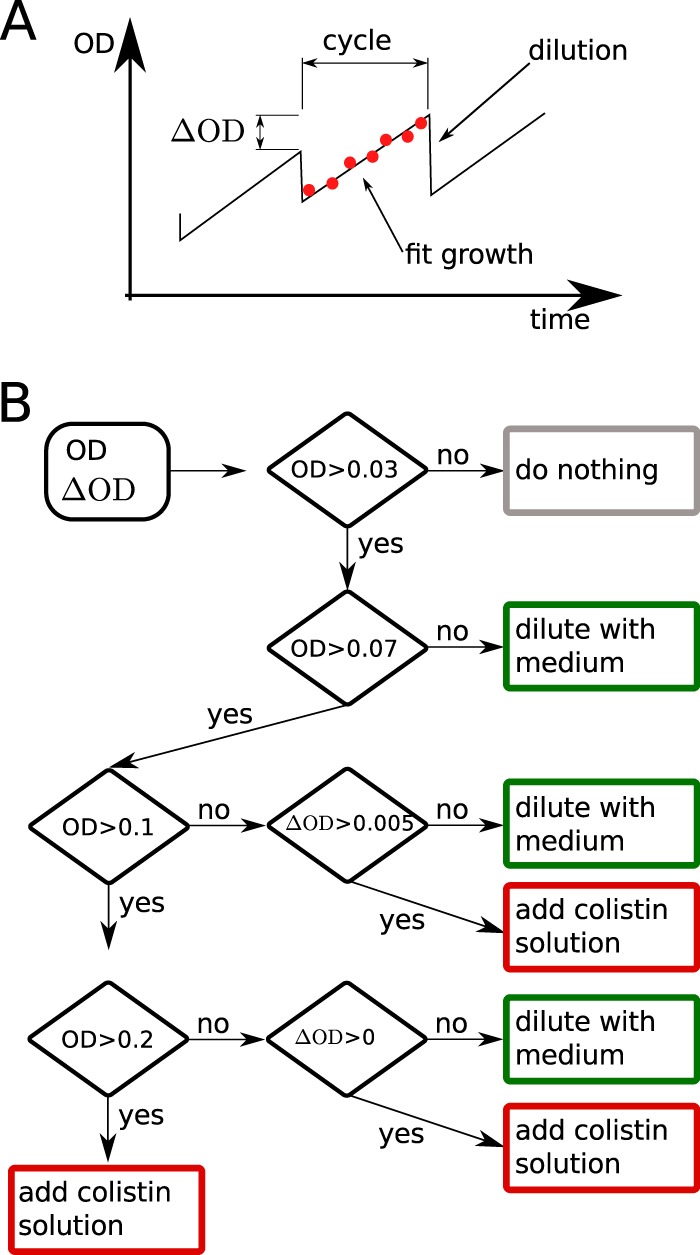
Growth feedback by the morbidostat. (A) The morbidostat measures the OD 18 times during a cycle of 10 min. At the end of each cycle, the culture is diluted and excess liquid removed. (B) The decision whether to dilute the culture and whether to dilute the culture with medium or colistin solution is based on the current OD and the increase of OD (ΔOD) compared to the previous cycle.
The morbidostat was programmed to use the colistin solution with the higher concentration whenever the colistin concentration in the respective vial exceed in one-third of the colistin solution with the lower concentration. In addition, we limited the rate of colistin increase to 10% over 1 h to prevent too-rapid feedback followed by population collapse.
Waste products were automatically removed using a 16-channel peristaltic pump and immediately transferred into inactivating solution and autoclaved. After each experiment, all tubing was first flushed with ethanol and bleach and subsequently autoclaved.
Since clinically relevant pan-resistant strains can potentially emerge during the experiments performed in this study, risks of the such studies need to be considered carefully. While the P. aeruginosa strains used pose little risk to immunocompetent people, we ensured that laboratory personnel were not involved in any form of patient care and performed the experiments in a dedicated room in a research facility. We consulted the hospital infection control team to devise and implement a hygiene protocol for the handling of XDR strains in the morbidostat.
Sampling.
Every 2 to 3 days, 1 ml of the bacterial culture was transferred to 19 ml of fresh LB medium in a sterile vial with a magnetic stir bar. To avoid contamination, the vial lid with the inlet was screwed onto a sterile empty vial during the transfer procedure. From every vial, 500 μl of suspension was mixed with 250 μl of 50% glycerin and stored at −80°C. To assess purity and to conduct resistance testing with Etests, 10 μl of suspension was spread on blood agar plates and grown overnight at 37°C. No bacteria other than P. aeruginosa were ever observed on these purity controls. Additional checks for contamination were done using the deep-sequencing data (see below).
Etest and broth microdilution.
Bacterial material was taken from a blood agar plate and diluted with physiological NaCl solution to 0.5 McFarland standard corresponding to around 108 CFU/ml. The mixture was plated on Mueller-Hinton agar plates. A colistin Etest strip (bestbion, Cologne, Germany) was placed in the middle of the plate (52). The bacteria were cultivated overnight. After 22 h, the resulting MIC could be checked. Broth microdilution was performed as follows. P. aeruginosa strain material was diluted in LB medium to an organism concentration of 104 to 105 CFU/ml and preincubated for 2 h at 37°C. A purity control was plated on tryptic soy agar (Oxoid, Wesel, Germany) and was considered valid when counts were 104 to 105 CFU/ml and when no contamination occurred. Tests were performed in a flat-bottom 96-well plate with a volume of 200 μl per well. Reference strains were examined with a range of colistin concentrations between 5 × 10⁻⁴ and 6.25 μg/ml, while evolved strains from the morbidostat were examined with between 2 and 4,096 μg/ml, each with a 2-fold dilution per step. MICs were recorded after 24 h as the first concentration of colistin that prevented a visible opacity change. The test was considered valid if the growth control showed an opacity change while medium and drug control wells remained clear. Colonies showing a MIC of ≥2 μg/ml are classified as clinically resistant according to EUCAST criteria (http://www.eucast.org). All broth microdilution results are available in Data Set S8.
PCR assays and DNA sequencing.
For the detection of genes, a PCR amplification was conducted according to a previously described protocol (53). Multilocus sequence typing (MLST) of both strains was performed according to the instructions in the P. aeruginosa MLST Database (https://pubmlst.org/paeruginosa/). Sequencing of internal fragments of seven housekeeping genes (acsA, aroE, guaA, mutL, nuoD, ppsA, and trpE) was done to determine the sequence type.
Whole-genome sequencing and analysis. (i) Reference genomes.
Reference genomes of the PA77 and PA83 strains were determined by PacBio long-read sequencing. P. aeruginosa DNA was isolated with a MoBio Ultra Clean microbial DNA isolation kit according to the manufacturer's instructions, including the optional RNase step. DNA from each strain was sequenced in two SMRT (single molecule, real time) cells on a PacBio RSII instrument. For the two genomes, 77,931 and 99,623 PacBio reads with mean read lengths of 15,479 and 11,143 bp were assembled using the HGAP.3 protocol implemented in SMRT Portal version 2.3.0. Illumina reads with >180-fold coverage were mapped onto the assembled sequence contigs using bwa (54) to improve sequence quality. Annotation was performed using Prokka 1.8 software (55) and manually supplemented.
(ii) Population sequencing.
For DNA extraction, 10 μl of thawed sample suspension was plated on blood agar and grown overnight at 37°C. Bacterial DNA was isolated by using the MoBio Ultra Clean microbial DNA isolation kit according to the manufacturer's instructions.
Sequencing libraries of the PA77 samples of the first experiment were prepared by using a modified Nextera XT protocol (for details, see reference 56) and sequenced to an average coverage of 33× on a MiSeq (three chromosomal contigs, 24×, 27×, and 24×, and a plasmid, 56×) in paired-end mode with 2 × 250 cycles (version 2, MS-102-2003).
Sequencing of samples from the two later experiments (PA77 and PA83) were prepared with a TruSeq nano kit by Illumina and sequenced on a HiSeq 2500 in paired-end mode with 2 × 150 cycles. In total, we sequenced 35 samples of strain PA77 (mean coverage of three chromosomal contigs, 182×, 212×, and 191×; mean plasmid coverage, 457×) and 61 samples of PA83 (chromosome, 175×, and plasmid, 388×) on four lanes.
Bioinformatic pipeline. (i)Trimming.
TrimGalore! was used for adaptor clipping and quality trimming with a Phred score cutoff at 20 of the paired-end reads (57). The resulting fastq files were checked using FastQC (58).
(ii) Mapping.
We mapped the short reads against the reference genomes using bwa (54). Mapping results of a representative subset of the samples were checked using QualiMap (59).
(iii) Variant analysis.
We used custom analysis scripts to identify mutations that arose and spread during the experiments. Scripts were written in Python and use the packages NumPy (60), biopython (61), and pysam (62).
We used the mapped reads to calculate the number of times each of the bases A, C, G, and T or a gap (-) was observed at every position in every sample (a pile-up). Only positions at which the frequency of a variant changed by at least >0.2 and had a coverage of more than a third of the average were considered reliable substitutions. For the preliminary experiment that was sequenced to lower coverage, a minimal frequency change of 0.4 was required.
To find deletions or duplications, we normalized coverage with a position-specific average coverage. Coverage of each contig in each run was normalized to the mean coverage along the contig. Then these normalized coverages were used to calculate the position-specific median normalized coverage across all samples. Deletions or duplications were detected by searching for regions where the normalized coverage dropped below 0.5-fold the position-specific median or above 1.8-fold the position-specific median. Only regions longer than 200 bp were considered.
Regions identified by this criterion were manually inspected for mapping artifacts and temporal signal in the variant frequency.
Accession number(s).
Genome sequences were submitted to GenBank (https://www.ncbi.nlm.nih.gov/GenBank) and assigned accession numbers CP017293 (PA83, chromosome), CP017294 (PA83, plasmid), and MJMC00000000 (PA77). Sequencing reads have been submitted to the European Short Read archive and are available under study accession number PRJEB15033 (sample accession numbers for samples from PA77a, PA77, and PA83 are ERS1284627 to ERS1284650, ERS1284651 to ERS1284684, and ERS1284685 to ERS1284744, respectively).
Supplementary Material
ACKNOWLEDGMENTS
We gratefully acknowledge Dirk Linke and Urs Jenal for stimulating discussions, three anonymous reviewers for insightful comments, Christa Lanz and Julia Hildebrandt for help with sequencing, and Nadine Hoffmann and Maximilian Heinrich for excellent technical assistance.
This study was supported by institutional funding from the Max-Planck Society. Partial financial support was received from the European Union's Horizon 2020 program under grant agreement no. 643476 (to U.N.).
We all declare that no conflicts of interest exist.
The funders had no role in study design, data collection and interpretation, or the decision to submit the work for publication.
Footnotes
Supplemental material for this article may be found at https://doi.org/10.1128/AAC.00043-17.
REFERENCES
- 1.Tzouvelekis LS, Markogiannakis A, Psichogiou M, Tassios PT, Daikos GL. 2012. Carbapenemases in Klebsiella pneumoniae and other Enterobacteriaceae: an evolving crisis of global dimensions. Clin Microbiol Rev 25:682–707. doi: 10.1128/CMR.05035-11. [DOI] [PMC free article] [PubMed] [Google Scholar]
- 2.Gould IM, Wise R. 1985. Pseudomonas aeruginosa: clinical manifestations and management. Lancet ii:1224–1227. [DOI] [PubMed] [Google Scholar]
- 3.Kang C-I, Kim S-H, Kim H-B, Park S-W, Choe Y-J, Oh M-D, Kim E-C, Choe K-W. 2003. Pseudomonas aeruginosa bacteremia: risk factors for mortality and influence of delayed receipt of effective antimicrobial therapy on clinical outcome. Clin Infect Dis 37:745–751. doi: 10.1086/377200. [DOI] [PubMed] [Google Scholar]
- 4.Tumbarello M, Repetto E, Trecarichi EM, Bernardini C, De Pascale G, Parisini A, Rossi M, Molinari MP, Spanu T, Viscoli C, Cauda R, Bassetti M. 2011. Multidrug-resistant Pseudomonas aeruginosa bloodstream infections: risk factors and mortality. Epidemiol Infect 139:1740–1749. doi: 10.1017/S0950268810003055. [DOI] [PubMed] [Google Scholar]
- 5.Katz DE, Marchaim D, Assous MV, Yinnon A, Wiener-Well Y, Ben-Chetrit E. 13 June 2016. Ten years with colistin: a retrospective case series. Int J Clin Pract doi: 10.1111/ijcp.12830. [DOI] [PubMed] [Google Scholar]
- 6.Storm DR, Rosenthal KS, Swanson PE. 1977. Polymyxin and related peptide antibiotics. Annu Rev Biochem 46:723–763. doi: 10.1146/annurev.bi.46.070177.003451. [DOI] [PubMed] [Google Scholar]
- 7.Buhl M, Peter S, Willmann M. 2015. Prevalence and risk factors associated with colonization and infection of extensively drug-resistant Pseudomonas aeruginosa: a systematic review. Expert Rev Anti Infect Ther 13:1159–1170. doi: 10.1586/14787210.2015.1064310. [DOI] [PubMed] [Google Scholar]
- 8.Fiaccadori E, Antonucci E, Morabito S, d' Avolio A, Maggiore U, Regolisti G. 2016. Colistin use in patients with reduced kidney function. Am J Kidney Dis 68:296–306. doi: 10.1053/j.ajkd.2016.03.421. [DOI] [PubMed] [Google Scholar]
- 9.Liu Y-Y, Wang Y, Walsh TR, Yi L- X, Zhang R, Spencer J, Doi Y, Tian G, Dong B, Huang X, Yu L-F, Gu D, Ren H, Chen X, Lv L, He D, Zhou H, Liang Z, Liu J-H, Shen J. 2016. Emergence of plasmid-mediated colistin resistance mechanism MCR-1 in animals and human beings in China: a microbiological and molecular biological study. Lancet Infect Dis 16:161–168. doi: 10.1016/S1473-3099(15)00424-7. [DOI] [PubMed] [Google Scholar]
- 10.Malhotra-Kumar S, Xavier BB, Das AJ, Lammens C, Butaye P, Goossens H. 2016. Colistin resistance gene mcr-1 harboured on a multidrug resistant plasmid. Lancet Infect Dis 16:283–284. doi: 10.1016/S1473-3099(16)00012-8. [DOI] [PubMed] [Google Scholar]
- 11.Lee J-Y, Park YK, Chung ES, Na IY, Ko KS. 2016. Evolved resistance to colistin and its loss due to genetic reversion in Pseudomonas aeruginosa. Sci Rep 6:25543. doi: 10.1038/srep25543. [DOI] [PMC free article] [PubMed] [Google Scholar]
- 12.McPhee JB, Lewenza S, Hancock REW. 2003. Cationic antimicrobial peptides activate a two-component regulatory system, PmrA-PmrB, that regulates resistance to polymyxin B and cationic antimicrobial peptides in Pseudomonas aeruginosa. Mol Microbiol 50:205–217. doi: 10.1046/j.1365-2958.2003.03673.x. [DOI] [PubMed] [Google Scholar]
- 13.Fernández L, Jenssen H, Bains M, Wiegand I, Gooderham WJ, Hancock REW. 2012. The two-component system CprRS senses cationic peptides and triggers adaptive resistance in Pseudomonas aeruginosa independently of ParRS. Antimicrob Agents Chemother 56:6212–6222. doi: 10.1128/AAC.01530-12. [DOI] [PMC free article] [PubMed] [Google Scholar]
- 14.Olaitan AO, Morand S, Rolain J-M. 2014. Mechanisms of polymyxin resistance: acquired and intrinsic resistance in bacteria. Front Microbiol 5:643. doi: 10.3389/fmicb.2014.00643. [DOI] [PMC free article] [PubMed] [Google Scholar]
- 15.Macfarlane ELA, Kwasnicka A, Hancock REW. 2000. Role of Pseudomonas aeruginosa PhoP-PhoQ in resistance to antimicrobial cationic peptides and aminoglycosides. Microbiology 146:2543–2554. doi: 10.1099/00221287-146-10-2543. [DOI] [PubMed] [Google Scholar]
- 16.Moskowitz SM, Ernst RK, Miller SI. 2004. PmrAB, a two-component regulatory system of Pseudomonas aeruginosa that modulates resistance to cationic antimicrobial peptides and addition of aminoarabinose to lipid A. J Bacteriol 186:575–579. doi: 10.1128/JB.186.2.575-579.2004. [DOI] [PMC free article] [PubMed] [Google Scholar]
- 17.Moskowitz SM, Brannon MK, Dasgupta N, Pier M, Sgambati N, Miller AK, Selgrade SE, Miller SI, Denton M, Conway SP, Johansen HK, Høiby N. 2012. PmrB mutations promote polymyxin resistance of Pseudomonas aeruginosa isolated from colistin-treated cystic fibrosis patients. Antimicrob Agents Chemother 56:1019–1030. doi: 10.1128/AAC.05829-11. [DOI] [PMC free article] [PubMed] [Google Scholar]
- 18.Jochumsen N, Marvig RL, Damkiær S, Jensen RL, Paulander W, Molin S, Jelsbak L, Folkesson A. 2016. The evolution of antimicrobial peptide resistance in Pseudomonas aeruginosa is shaped by strong epistatic interactions. Nat Commun 7:13002. doi: 10.1038/ncomms13002. [DOI] [PMC free article] [PubMed] [Google Scholar]
- 19.Snitkin ES, Zelazny AM, Thomas PJ, Stock F, NISC Comparative Sequencing Program, Henderson DK, Palmore TN, Segre JA. 2012. Tracking a hospital outbreak of carbapenem-resistant Klebsiella pneumoniae with whole-genome sequencing. Sci Transl Med 4:148ra116. doi: 10.1126/scitranslmed.3004129. [DOI] [PMC free article] [PubMed] [Google Scholar]
- 20.Noteboom Y, Ong DSY, Oostdijk EA, Schultz MJ, de Jonge E, Purmer I, Bergmans D, Fijen JW, Kesecioglu J, Bonten MJM. 2015. Antibiotic-induced within-host resistance development of gram-negative bacteria in patients receiving selective decontamination or standard care. Crit Care Med 43:2582–2588. doi: 10.1097/CCM.0000000000001298. [DOI] [PubMed] [Google Scholar]
- 21.Barrick JE, Yu DS, Yoon SH, Jeong H, Oh TK, Schneider D, Lenski RE, Kim JF. 2009. Genome evolution and adaptation in a long-term experiment with Escherichia coli. Nature 461:1243–1247. doi: 10.1038/nature08480. [DOI] [PubMed] [Google Scholar]
- 22.Toprak E, Veres A, Michel J-B, Chait R, Hartl DL, Kishony R. 2012. Evolutionary paths to antibiotic resistance under dynamically sustained drug selection. Nat Genet 44:101–105. doi: 10.1038/ng.1034. [DOI] [PMC free article] [PubMed] [Google Scholar]
- 23.Magiorakos A-P, Srinivasan A, Carey RB, Carmeli Y, Falagas ME, Giske CG, Harbarth S, Hindler JF, Kahlmeter G, Olsson-Liljequist B, Paterson DL, Rice LB, Stelling J, Struelens MJ, Vatopoulos A, Weber JT, Monnet DL. 2012. Multidrug-resistant, extensively drug-resistant and pandrug-resistant bacteria: an international expert proposal for interim standard definitions for acquired resistance. Clin Microbiol Infect 18:268–281. doi: 10.1111/j.1469-0691.2011.03570.x. [DOI] [PubMed] [Google Scholar]
- 24.Willmann M, Kuebart I, Marschal M, Schröppel K, Vogel W, Flesch I, Markert U, Autenrieth IB, Hölzl F, Peter S. 2013. Effect of metallo-β-lactamase production and multidrug resistance on clinical outcomes in patients with Pseudomonas aeruginosa bloodstream infection: a retrospective cohort study. BMC Infect Dis 13:515. doi: 10.1186/1471-2334-13-515. [DOI] [PMC free article] [PubMed] [Google Scholar]
- 25.Zankari E, Hasman H, Cosentino S, Vestergaard M, Rasmussen S, Lund O, Aarestrup FM, Larsen MV. 2012. Identification of acquired antimicrobial resistance genes. J Antimicrob Chemother 67:2640–2644. doi: 10.1093/jac/dks261. [DOI] [PMC free article] [PubMed] [Google Scholar]
- 26.Toprak E, Veres A, Yildiz S, Pedraza JM, Chait R, Paulsson J, Kishony R. 2013. Building a morbidostat: an automated continuous-culture device for studying bacterial drug resistance under dynamically sustained drug inhibition. Nat Protoc 8:555–567. doi: 10.1038/nprot.2013.021. [DOI] [PMC free article] [PubMed] [Google Scholar]
- 27.Kim D-J, Chung S-G, Lee S-H, Choi J-W. 2012. Relation of microbial biomass to counting units for Pseudomonas aeruginosa. Afr J Microbiol Res 6:4620–4622. [Google Scholar]
- 28.Lacour S, Bechet E, Cozzone AJ, Mijakovic I, Grangeasse C. 2008. Tyrosine phosphorylation of the UDP-glucose dehydrogenase of Escherichia coli is at the crossroads of colanic acid synthesis and polymyxin resistance. PLoS One 3:e3053. doi: 10.1371/journal.pone.0003053. [DOI] [PMC free article] [PubMed] [Google Scholar]
- 29.Braun M, Silhavy TJ. 2002. Imp/OstA is required for cell envelope biogenesis in Escherichia coli. Mol Microbiol 45:1289–1302. doi: 10.1046/j.1365-2958.2002.03091.x. [DOI] [PubMed] [Google Scholar]
- 30.Chng S-S, Ruiz N, Chimalakonda G, Silhavy TJ, Kahne D. 2010. Characterization of the two-protein complex in Escherichia coli responsible for lipopolysaccharide assembly at the outer membrane. Proc Natl Acad Sci U S A 107:5363–5368. doi: 10.1073/pnas.0912872107. [DOI] [PMC free article] [PubMed] [Google Scholar]
- 31.Moffatt JH, Harper M, Harrison P, Hale JDF, Vinogradov E, Seemann T, Henry R, Crane B, Michael FS, Cox AD, Adler B, Nation RL, Li J, Boyce JD. 2010. Colistin resistance in Acinetobacter baumannii is mediated by complete loss of lipopolysaccharide production. Antimicrob Agents Chemother 54:4971–4977. doi: 10.1128/AAC.00834-10. [DOI] [PMC free article] [PubMed] [Google Scholar]
- 32.Balibar CJ, Grabowicz M. 2016. Mutant alleles of lptD increase the permeability of Pseudomonas aeruginosa and define determinants of intrinsic resistance to antibiotics. Antimicrob Agents Chemother 60:845–854. doi: 10.1128/AAC.01747-15. [DOI] [PMC free article] [PubMed] [Google Scholar]
- 33.Poon KKH, Westman EL, Vinogradov E, Jin S, Lam JS. 2008. Functional characterization of MigA and WapR: putative rhamnosyltransferases involved in outer core oligosaccharide biosynthesis of Pseudomonas aeruginosa. J Bacteriol 190:1857–1865. doi: 10.1128/JB.01546-07. [DOI] [PMC free article] [PubMed] [Google Scholar]
- 34.Dettman JR, Sztepanacz JL, Kassen R. 2016. The properties of spontaneous mutations in the opportunistic pathogen Pseudomonas aeruginosa. BMC Genomics 17:27. doi: 10.1186/s12864-015-2244-3. [DOI] [PMC free article] [PubMed] [Google Scholar]
- 35.Taddei F, Radman M, Maynard-Smith J, Toupance B, Gouyon PH, Godelle B. 1997. Role of mutator alleles in adaptive evolution. Nature 387:700–702. doi: 10.1038/42696. [DOI] [PubMed] [Google Scholar]
- 36.Chopra I, O'Neill AJ, Miller K. 2003. The role of mutators in the emergence of antibiotic-resistant bacteria. Drug Resist Updat 6:137–145. doi: 10.1016/S1368-7646(03)00041-4. [DOI] [PubMed] [Google Scholar]
- 37.Evans BA, Amyes SGB. 2014. OXA β-lactamases. Clin Microbiol Rev 27:241–263. doi: 10.1128/CMR.00117-13. [DOI] [PMC free article] [PubMed] [Google Scholar]
- 38.Rodríguez-Martínez J-M, Poirel L, Nordmann P. 2009. Molecular epidemiology and mechanisms of carbapenem resistance in Pseudomonas aeruginosa. Antimicrob Agents Chemother 53:4783–4788. doi: 10.1128/AAC.00574-09. [DOI] [PMC free article] [PubMed] [Google Scholar]
- 39.Fernández L, Álvarez-Ortega C, Wiegand I, Olivares J, Kocíncová D, Lam JS, Martínez JL, Hancock REW. 2013. Characterization of the polymyxin B resistome of Pseudomonas aeruginosa. Antimicrob Agents Chemother 57:110–119. doi: 10.1128/AAC.01583-12. [DOI] [PMC free article] [PubMed] [Google Scholar]
- 40.Punina NV, Makridakis NM, Remnev MA, Topunov AF. 2015. Whole-genome sequencing targets drug-resistant bacterial infections. Hum Genomics 9:19. doi: 10.1186/s40246-015-0037-z. [DOI] [PMC free article] [PubMed] [Google Scholar]
- 41.Jansen G, Barbosa C, Schulenburg H. 2013. Experimental evolution as an efficient tool to dissect adaptive paths to antibiotic resistance. Drug Resist Updat 16:96–107. doi: 10.1016/j.drup.2014.02.002. [DOI] [PubMed] [Google Scholar]
- 42.Baym M, Lieberman TD, Kelsic ED, Chait R, Gross R, Yelin I, Kishony R. 2016. Spatiotemporal microbial evolution on antibiotic landscapes. Science 353:1147–1151. doi: 10.1126/science.aag0822. [DOI] [PMC free article] [PubMed] [Google Scholar]
- 43.EUCAST. 2016. Recommendations for MIC determination of colistin (polymyxin E) as recommended by the joint CLSI-EUCAST Polymyxin Breakpoints Working Group. http://www.eucast.org/fileadmin/src/media/PDFs/EUCAST_files/General_documents/Recommendations_for_MIC_determination_of_colistin_March_2016.pdf.
- 44.Pamp SJ, Gjermansen M, Johansen HK, Tolker-Nielsen T. 2008. Tolerance to the antimicrobial peptide colistin in Pseudomonas aeruginosa biofilms is linked to metabolically active cells, and depends on the pmr and mexAB-oprM genes. Mol Microbiol 68:223–240. doi: 10.1111/j.1365-2958.2008.06152.x. [DOI] [PubMed] [Google Scholar]
- 45.Herrera CM, Hankins JV, Trent MS. 2010. Activation of PmrA inhibits LpxT-dependent phosphorylation of lipid A promoting resistance to antimicrobial peptides. Mol Microbiol 76:1444–1460. doi: 10.1111/j.1365-2958.2010.07150.x. [DOI] [PMC free article] [PubMed] [Google Scholar]
- 46.Nowicki EM, O'Brien JP, Brodbelt JS, Trent MS. 2014. Characterization of Pseudomonas aeruginosa LpxT reveals dual positional lipid A kinase activity and co-ordinated control of outer membrane modification. Mol Microbiol 94:728–741. doi: 10.1111/mmi.12796. [DOI] [PMC free article] [PubMed] [Google Scholar]
- 47.Fernández-Reyes M, Rodríguez-Falcón M, Chiva C, Pachón J, Andreu D, Rivas L. 2009. The cost of resistance to colistin in Acinetobacter baumannii: a proteomic perspective. Proteomics 9:1632–1645. doi: 10.1002/pmic.200800434. [DOI] [PubMed] [Google Scholar]
- 48.López-Rojas R, Domínguez-Herrera J, McConnell MJ, Docobo-Peréz F, Smani Y, Fernández-Reyes M, Rivas L, Pachón J. 2011. Impaired virulence and in vivo fitness of colistin-resistant Acinetobacter baumannii. J Infect Dis 203:545–548. doi: 10.1093/infdis/jiq086. [DOI] [PMC free article] [PubMed] [Google Scholar]
- 49.Mu X, Wang N, Li X, Shi K, Zhou Z, Yu Y, Hua X. 2016. The effect of colistin resistance-associated mutations on the fitness of Acinetobacter baumannii. Front Microbiol 7:1715. doi: 10.3389/fmicb.2016.01715. [DOI] [PMC free article] [PubMed] [Google Scholar]
- 50.Choi M-J, Ko KS. 2015. Loss of hypermucoviscosity and increased fitness cost in colistin-resistant Klebsiella pneumoniae sequence type 23 strains. Antimicrob Agents Chemother 59:6763–6773. doi: 10.1128/AAC.00952-15. [DOI] [PMC free article] [PubMed] [Google Scholar]
- 51.Marvig RL, Johansen HK, Molin S, Jelsbak L. 2013. Genome analysis of a transmissible lineage of Pseudomonas aeruginosa reveals pathoadaptive mutations and distinct evolutionary paths of hypermutators. PLoS Genet 9:e1003741. doi: 10.1371/journal.pgen.1003741. [DOI] [PMC free article] [PubMed] [Google Scholar]
- 52.Andrews JM. 2001. Determination of minimum inhibitory concentrations. J Antimicrob Chemother 48:5–16. doi: 10.1093/jac/48.suppl_1.5. [DOI] [PubMed] [Google Scholar]
- 53.Pitout JDD, Gregson DB, Poirel L, McClure J-A, Le P, Church DL. 2005. Detection of Pseudomonas aeruginosa producing metallo-β-lactamases in a large centralized laboratory. J Clin Microbiol 43:3129–3135. doi: 10.1128/JCM.43.7.3129-3135.2005. [DOI] [PMC free article] [PubMed] [Google Scholar]
- 54.Li H, Durbin R. 2009. Fast and accurate short read alignment with Burrows-Wheeler transform. Bioinformatics 25:1754–1760. doi: 10.1093/bioinformatics/btp324. [DOI] [PMC free article] [PubMed] [Google Scholar]
- 55.Seemann T. 2014. Prokka: rapid prokaryotic genome annotation. Bioinformatics 30:2068–2069. doi: 10.1093/bioinformatics/btu153. [DOI] [PubMed] [Google Scholar]
- 56.Zanini F, Brodin J, Thebo L, Lanz C, Bratt G, Albert J, Neher RA. 2016. Population genomics of intrapatient HIV-1 evolution. eLife Sci 4:e11282. [DOI] [PMC free article] [PubMed] [Google Scholar]
- 57.Krueger F. 2015. TrimGalore! A wrapper tool around Cutadapt and FastQC to consistently apply quality and adapter trimming to FastQ files. https://www.bioinformatics.babraham.ac.uk/projects/trim_galore/. Accessed 8 January 2015.
- 58.Andrews S. 2015. FastQC: a quality control tool for high throughput sequence data. https://www.bioinformatics.babraham.ac.uk/projects/fastqc/. Accessed 8 January 2015.
- 59.García-Alcalde F, Okonechnikov K, Carbonell J, Cruz LM, Götz S, Tarazona S, Dopazo J, Meyer TF, Conesa A. 2012. QualiMap: evaluating next generation sequencing alignment data. Bioinformatics 28:2678–2679. doi: 10.1093/bioinformatics/bts503. [DOI] [PubMed] [Google Scholar]
- 60.van der Walt S, Colbert SC, Varoquaux G. 2011. The NumPy array: a structure for efficient numerical computation. Comput Sci Eng 13:22–30. doi: 10.1109/MCSE.2011.37. [DOI] [Google Scholar]
- 61.Cock PJA, Antao T, Chang JT, Chapman BA, Cox CJ, Dalke A, Friedberg I, Hamelryck T, Kauff F, Wilczynski B, Hoon MJLd. 2009. Biopython: freely available Python tools for computational molecular biology and bioinformatics. Bioinformatics 25:1422–1423. doi: 10.1093/bioinformatics/btp163. [DOI] [PMC free article] [PubMed] [Google Scholar]
- 62.Li H, Handsaker B, Wysoker A, Fennell T, Ruan J, Homer N, Marth G, Abecasis G, Durbin R, 1000 Genome Project Data Processing Subgroup. 2009. The Sequence Alignment/Map format and SAMtools. Bioinformatics 25:2078–2079. doi: 10.1093/bioinformatics/btp352. [DOI] [PMC free article] [PubMed] [Google Scholar]
Associated Data
This section collects any data citations, data availability statements, or supplementary materials included in this article.