Abstract
Background:
Parapneumonic pleural effusion (PPE) is a common complication of pneumonia. The accurate diagnosis of PPE remains a challenge. Recent studies suggest that procalcitonin (PCT) emerges as a potential biomarker for PPE. Our study aimed to determine the diagnostic value of PCT for PPE by a clinical study and summarize the overall diagnostic performance of PCT through a meta-analysis.
Methods:
Demographic and clinical data of the patients with PPE and controls were collected in our clinical study. The diagnostic performances of serum PCT (s-PCT) were analyzed via receiver operating characteristic (ROC) curve analysis, using area under the curve (AUC) as a measure of accuracy. Literature databases were systematically searched for the studies examining the accuracy of PCT for diagnosing PPE. Data on sensitivity, specificity, positive/negative likelihood ratio (PLR/NLR), and diagnostic odds ratio (DOR) were pooled. Summary ROC curves and AUC were used to evaluate overall test performance.
Results:
In our clinical study, 47 patients with PPE and 101 controls were included. The s-PCT levels were significantly increased in the setting of PPE (5.44 ± 9.82 ng/mL) compared with malignant PE (0.15 ± 0.19 ng/mL), tuberculous PE (0.18 ± 0.16 ng/mL), and transudates (0.09 ± 0.03 ng/mL) (P < .001). Using a cutoff value of 0.195 ng/mL, the sensitivity and specificity of s-PCT in diagnosing PPE were 0.83 and 0.80, respectively, and AUC was 0.89. In addition, 11 studies were included in our meta-analysis. Summary performance estimates for s-PCT in diagnosing PPE were as follows: sensitivity, 0.78 (95% CI: 0.71–0.84); specificity, 0.74 (95% CI: 0.69–0.78); PLR, 3.46 (95% CI: 2.09–5.74); NLR, 0.27 (95% CI: 0.14–0.54); DOR, 12.37 (95% CI: 4.34–41.17); and AUC, 0.84. The corresponding estimates for p-PCT were as follows: sensitivity, 0.62 (95% CI: 0.57–0.67); specificity, 0.71 (95% CI: 0.68–0.75); PLR 2.31 (95% CI: 1.81–2.95); NLR, 0.47 (95% CI: 0.35–0.63); DOR, 5.48 (95% CI: 3.07–9.77); and AUC, 0.80.
Conclusion:
Both s-PCT and p-PCT might have modest performance in diagnosing PPE. However, more studies on a large scale should be performed to confirm our findings.
Keywords: diagnosis, meta-analysis, parapneumonic pleural effusion, procalcitonin
1. Introduction
Pneumonia is reported as the most common cause of infection-related mortality worldwide.[1] Parapneumonic pleural effusion (PPE) refers to a pleural effusion (PE) associated with bacterial pneumonia, a pulmonary abscess, or infected bronchiectasis.[2] PPE occurs in 45% of the patients who are hospitalized with pneumonia, and up to 35% of these patients develop an empyema which results in a prolonged hospital stay and higher mortality.[3–5] It highlights the early diagnosis of PPE as paramount in the evaluation of patients with pneumonia.
The diagnosis of PPE is a challenge because of the limitations of the current available methods. PE culture is negative in 40% of cases of PPE.[6] Detection of pH, lactate dehydrogenase (LDH), and glucose in PE shows a low specificity and/or low sensitivity.[7,8] In addition, radiologic examination and cytological analyses can be used to distinguish PPE from other kinds of PE (such as malignant PE [MPE], tuberculous PE [TPE]). However, these methods are sometimes insufficient for exact diagnosis, especially in the early phase of the diseases. Therefore, biomarkers of bacterial metabolism and those of white cells, such as procalcitonin (PCT), C-reactive protein, and interleukin, have been looked at in the last few years to improve the diagnosis.
PCT is a prohormone of calcitonin that is secreted physiologically by C-cells of the thyroid gland in response to hypercalcemia, and is emerging as a promising clinical biomarker of bacterial infection.[9] PCT concentrations tend to be higher in patients with pneumonia who have more severe infections.[10,11] In recent years, some studies have evaluated the usefulness of serum PCT (s-PCT) and/or pleural PCT (p-PCT) as a diagnostic marker of PPE. However, the conflicting conclusions were obtained.[12,13] To gain more reliable insights, we analyzed the diagnostic accuracy of s-PCT level in PPE by a retrospective clinical study and summarized the overall performance of s-PCT and p-PCT for diagnosing PPE via an updated meta-analysis.
2. Methods
2.1. Patients
A total of 148 inpatients with PE admitted to West China Hospital during January 2015 to June 2016 were included in this study. A PPE was defined as one associated with pneumonia according to the criteria of the American Thoracic Society.[14] A MPE was defined as one with malignant cells identified in the PE cytology or biopsy specimen. A TPE was regarded as one associated with granulomatous inflammation seen on the pleural biopsy specimen or a positive Mycobacterium tuberculosis culture finding in PE. A transudate was attributed to heart failure, liver cirrhosis, and chronic renal failure.[15] Institutional review board approval was waived for this retrospective clinical study and meta-analysis.
2.2. Data collection and statistical analysis
Demographic data, concentration of s-PCT, and protein/LDH/glucose in PE were collected for the patients included, and summarized using descriptive statistics. The s-PCT level was measured by electrochemiluminescence method (Roche, IN). The data of s-PCT were expressed as the mean ± standard deviations. The differences between groups were analyzed using the one-way analysis of variance. A receiver operating characteristic (ROC) curve analysis was applied to evaluate the threshold value of s-PCT in diagnosing PPE. A cutoff point was determined as the value of the parameter that maximized the sum of the specificity and sensitivity. The area under the curve (AUC) was used to summarize the diagnostic performance of s-PCT. The statistical analysis was performed using SPSS 18.0 software (Chicago, IL). A value of P less than .05 was considered statistically significant.
2.3. Meta-analysis
A systematic literature search was conducted in PubMed, EMBASE, CNKI, WANGFANG, and VIP databases up to September 2016, using the following syntax: “Parapneumonic pleural effusion OR Parapneumonic pleural fluid OR Parapneumonic effusion OR Parapneumonic fluid” AND “Procalcitonin” AND “Sensitivity OR Specificity OR Accuracy.” Studies were included if they fulfilled the following criteria: they were original research articles and published in English or Chinese; they examined the ability of PCT level for diagnosing PPE in humans; and they reported sufficient data to allow calculation of true positive (TP), false positive (FP), false negative (FN), and true negative (TN). Conference proceedings and studies published only as abstracts were excluded. The quality of the selected studies was assessed using the 14-items Quality Assessment of Diagnostic Accuracy Studies (QUADAS) list.[16]
We calculated positive likelihood ratios (PLR), negative likelihood ratios (NLR), and diagnostic odds ratios (DOR), which used as an overall index of diagnostic accuracy. Summary receiver operating characteristic (SROC) curves and AUC were also calculated to evaluate the overall diagnostic performance of PCT. Heterogeneity was assessed using the I2 inconsistency test. I2 > 50% indicated substantial heterogeneity. Potential publication bias was evaluated by Deek funnel plot.[17] All analyses were performed using the “Midas” module in STATA 12.0 (Stata Corp, College Station, TX) and Meta-DiSc 1.4 for Windows (XI, Cochrane Colloquium, Barcelona, Spain). All statistical tests were 2-sided, a P value less than .05 was considered as statistical significance.
3. Results
3.1. Demographics of the patients and their pleural effusion characteristics
The present clinical study included 47 patients in PPE group and 101 patients in control groups (including 46 patients with TPE, 41 with MPE, and 14 with transudate). The demographics and characteristics of PE in these patients are summarized in Table 1.
Table 1.
Characteristics of the patients with pleural effusions in the present clinical study.

3.2. s-PCT levels in the patients
The s-PCT levels were significantly higher in the patients with PPE (5.44 ± 9.82 ng/mL) than those in the patients with MPE (0.15 ± 0.19 ng/mL), TPE (0.18 ± 0.16 ng/mL), and transudate (0.09 ± 0.03 ng/mL) (P < .001) (Fig. 1).
Figure 1.
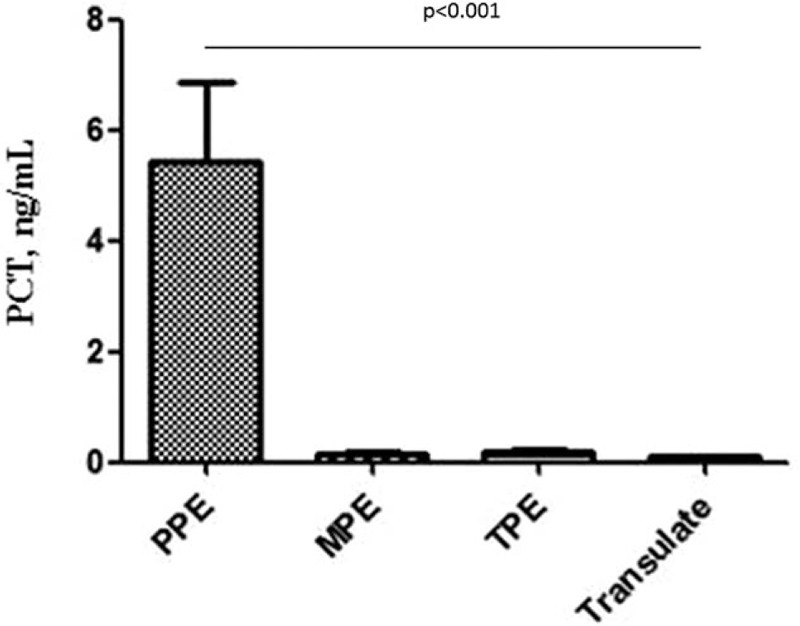
Comparisons of s-PCT levels in patients between PPE and non-PPE groups. The levels of PCT for PPE, MPE, TPE, transudate groups were 5.44 ± 9.82, 0.15 ± 0.19, 0.18 ± 0.16, and 0.09 ± 0.03 ng/mL, respectively. MPE = malignant pleural effusion, PCT = procalcitonin, PPE = parapneumonic pleural effusion, s-PCT = serum procalcitonin, TPE = tuberculous pleural effusion.
3.3. Diagnostic performance of s-PCT in PPE
A ROC curve was created to summarize the diagnostic performance of s-PCT for PPE, and the AUC was 0.886 (Fig. 2). At a cutoff value of 0.195 ng/mL, and the sensitivity and specificity of s-PCT in diagnosing PPE were 0.83 and 0.80, respectively.
Figure 2.
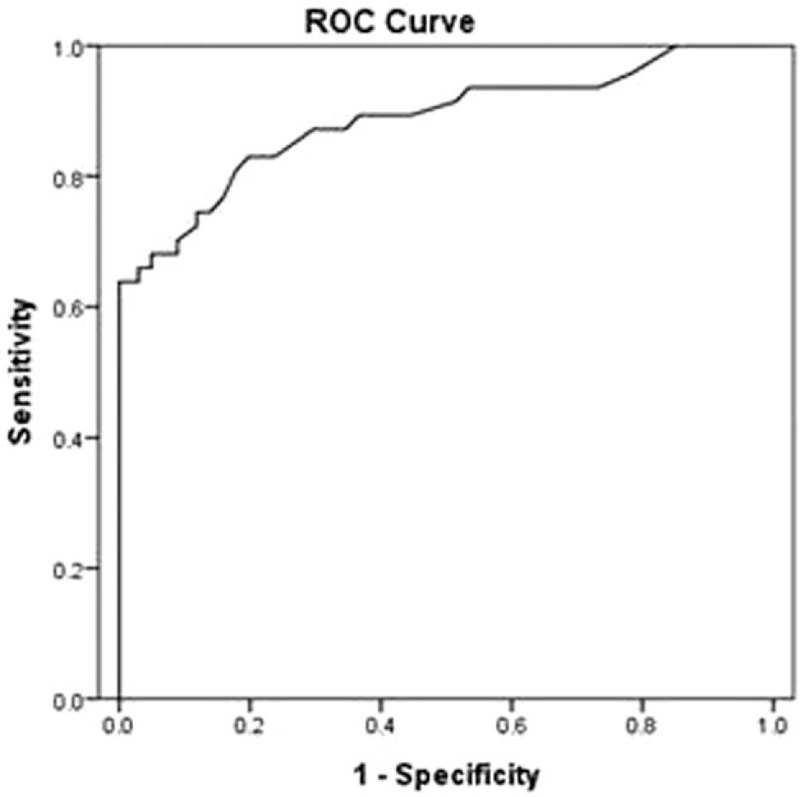
ROC curve for the diagnosis of PPE. The AUC for s-PCT is 0.89. AUC = area under the curve, PPE = parapneumonic pleural effusion, ROC = receiver operating characteristic, s-PCT = serum procalcitonin.
3.4. Meta-analysis
In this meta-analysis, 11 studies involving 1320 subjects, comprising 463 patients with PPE and 857 controls, were included for a meta-analysis.[13,15,18–25] The clinical characteristics of the patients as well as the QUADAS scores for the studies included are listed in Table 2. Diagnostic performance of s-PCT and p-PCT is described in Table 3. Figure 3 shows the SROC curve, with an AUC of 0.84 for s-PCT and 0.80 for p-PCT.
Table 2.
Clinical summary of included studies examining the diagnostic performance of serum and pleural PCT in PPEs.
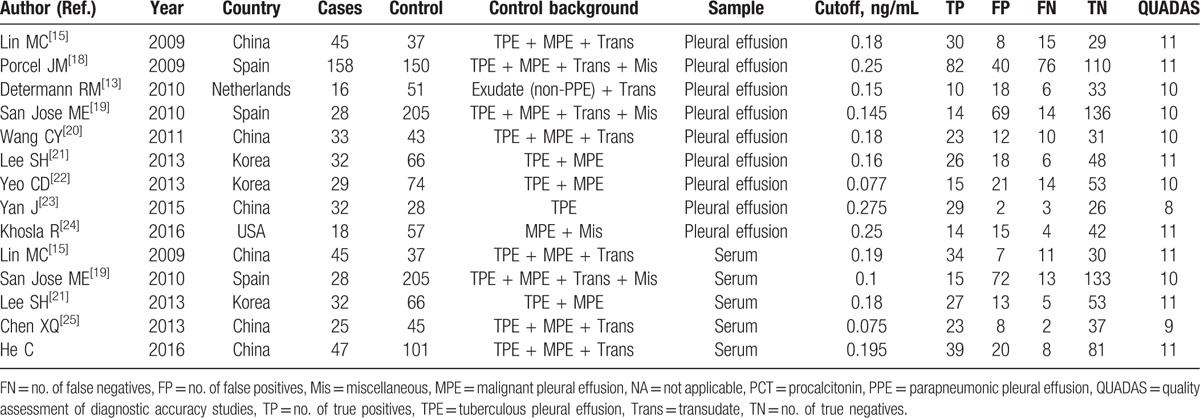
Table 3.
Summary characteristics of diagnostic performance of serum and pleural PCT levels.
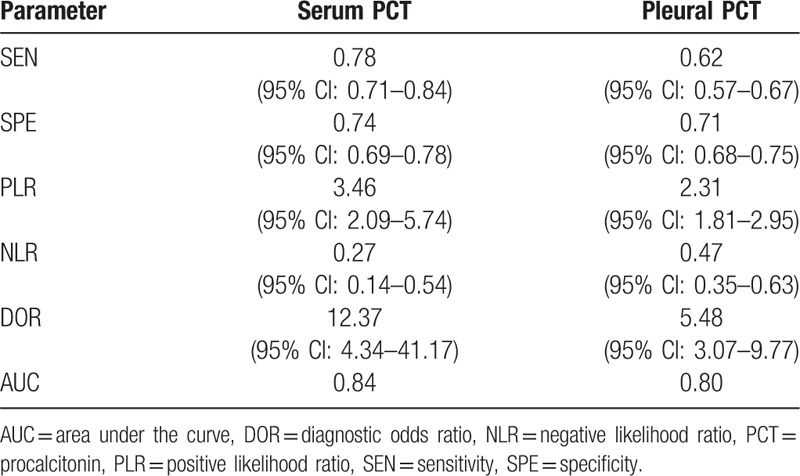
Figure 3.
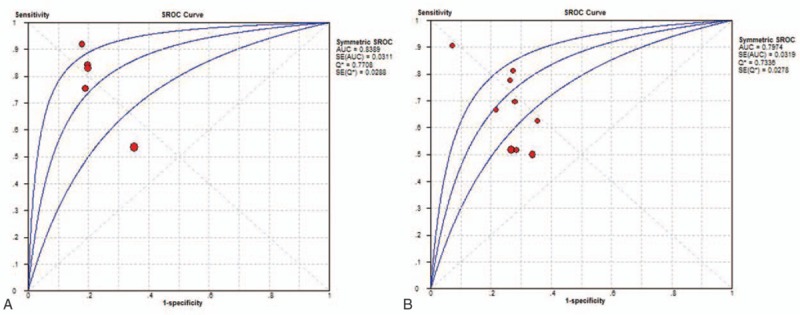
SROC curves for s-PCT and p-PCT as a diagnostic biomarker for PPE. The overall AUCs for s-PCT (A) and p-PCT (B) are 0.84 and 0.80, respectively. AUC = area under the curve, p-PCT = pleural procalcitonin, PPE = parapneumonic pleural effusion, s-PCT = serum procalcitonin, SROC = summary receiver operating characteristic.
The heterogeneity examination showed that the sensitivity and specificity presented with I2 values of 70.1% and 72.6% for s-PCT, and 75.1% and 38.9% for p-PCT, respectively. These results suggested that heterogeneity existed among the studies. However, we did not perform a meta-regression analysis to investigate the source of heterogeneity due to limited included studies. Publication bias was tested by the Deek funnel plot. As shown in Figure 4, the slope coefficient was associated with a P value of 0.60 for s-PCT and 0.18 for p-PCT, suggesting no evidence of publication bias.
Figure 4.
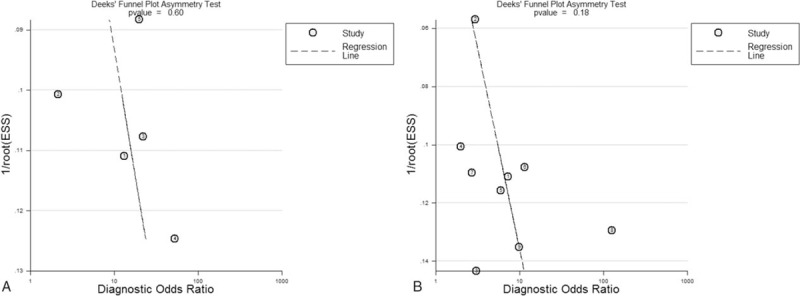
Deek funnel plot to assess the likelihood of publication bias. (A) s-PCT and (B) p-PCT. p-PCT = pleural procalcitonin, s-PCT = serum procalcitonin.
4. Discussion
The differential diagnosis of PPE is of great importance in the clinical management of the patient with pneumonia. Many methods can be used for the diagnosis of PPE, but the absence of early, reliable, and minimally invasive biomarkers for PPE screening has been a limiting factor in clinical practice.[26] In this study, we performed a clinical study to confirm the diagnostic performance of s-PCT. We found that the AUC, sensitivity, and specificity of s-PCT for diagnosing PPE were 0.89, 0.83, and 0.80, respectively. It indicated that s-PCT was a modest diagnostic marker for PPE, and further evaluation of its clinical practice is necessary. Recent reports found that s-PCT can predict the prognosis and response to antibiotic management for the patients with community acquired pneumonia.[27,28] Moreover, there are 3 kinds of PPE (uncomplicated PPE, complicated PPE, and empyema). So, further studies could focus on the role of s-PCT in assessing the severity of PPE and outcome of the patients, which will better guide its clinical management.
We also completed a meta-analysis using currently available publications and our study to update the overall diagnostic performance of PCT for PPE. Our results indicate that s-PCT is associated with higher overall sensitivity (0.78) and specificity (0.74) compared to p-PCT with overall sensitivity (0.62) and specificity (0.71). The SROC curves illustrate overall test performance, and depict the tradeoff between sensitivity and specificity. The SROC analysis demonstrates an AUC of 0.84 for s-PCT and 0.80 for p-PCT, which is suggestive of a better overall performance of s-PCT. DOR combines the sensitivity and specificity data into a single number ranging from 0 to infinity, with higher values indicating better discriminatory test performance.[29] The mean pooled DOR in our meta-analysis was 12.37 for s-PCT and 5.48 for p-PCT, suggesting that s-PCT may be more helpful in diagnosing PPE.
We subsequently examined the diagnostic accuracy of PCT by calculating PLR and NLR. The pooled PLR was 3.46 for s-PCT and 2.31 for p-PCT, which suggest that PPE patients have an approximately 3-fold chance of presenting a positive s-PCT result and 2-fold chance of presenting a positive p-PCT result than patients without PPE do. The pooled NLR was 0.27 for s-PCT and 0.47 for p-PCT, indicating that a negative PCT measurement result presents 27% likelihood for s-PCT and 47% likelihood for p-PCT of being an FN.
In our meta-analysis, latest papers published in recent years were included. We suggest that s-PCT have better diagnostic performance than that of p-PCT, which is different from the results of a previous meta-analysis.[30] In addition, we found that the cutoff values of PCT ranged from 0.075 to 0.275 ng/mL among included studies. Such variation of cutoff value might result from the differences in clinical characteristics of the subjects. Further work should aim to identify the cutoff values that can provide optimal diagnostic accuracy, especially for differentiating the different kinds of PPE.
Several limitations of this study should be addressed. First, for the strict inclusion criteria, our meta-analysis analyzed only a limited number of studies. Another limitation was that our clinical study was retrospective and the p-PCT level and severity of PPE cannot be taken into considerations for the lack of the available data. Finally, we observed the heterogeneity among the studies in our meta-analysis. However, due to the limited number of studies included, we did not evaluate covariates as possible sources of the heterogeneity.[31]
5. Conclusion
Taken together, the findings of our study suggest that both s-PCT and p-PCT might have modest performance in diagnosing PPE. PCT-based clinical study on a large scale may elucidate whether it can be a useful and noninvasive diagnostic tool to complement current diagnosing procedures of PPE.
Footnotes
Abbreviations: AUC = area under the curve, DOR = diagnostic odds ratio, FN = false negative, FP = false positive, LDH = lactate dehydrogenase, MPE = malignant PE, PCT = procalcitonin, PE = pleural effusion, PLR/NLR = positive/negative likelihood ratio, p-PCT = pleural PCT, PPE = parapneumonic pleural effusion, QUADAS = Quality Assessment of Diagnostic Accuracy Studies, ROC = receiver operating characteristic, s-PCT = serum PCT, SROC = summary receiver operating characteristic, TN = true negative, TP = true positive, TPE = tuberculous PE.
CH and BW are equal contributors to this paper and share joint first authorship.
This work was supported by grants No.81201342 from the National Natural Science Foundation of China, and projects No.16PJ325 from Health and Family Planning Commission of Sichuan province, China.
The authors report no conflicts of interest.
References
- [1].Jose RJ, Periselneris JN, Brown JS. Community-acquired pneumonia. Curr Opin Pulm Med 2015;21:212–8. [DOI] [PubMed] [Google Scholar]
- [2].Light RW. Parapneumonic effusions and empyema. Proc Am Thorac Soc 2006;3:75–80. [DOI] [PubMed] [Google Scholar]
- [3].Kim J, Park JS, Cho YJ, et al. Predictors of prolonged stay in patients with community-acquired pneumonia and complicated parapneumonic effusion. Respirology 2016;21:164–71. [DOI] [PubMed] [Google Scholar]
- [4].Luh SP, Hsu GJ, Cheng-Ren C. Complicated parapneumonic effusion and empyema: pleural decortication and video-assisted thoracic surgery. Curr Infect Dis Rep 2008;10:236–40. [DOI] [PubMed] [Google Scholar]
- [5].Ferreiro L, San Jose ME, Valdes L. Management of parapneumonic pleural effusion in adults. Arch Bronconeumol 2015;51:637–46. [DOI] [PubMed] [Google Scholar]
- [6].Davies CW, Kearney SE, Gleeson FV, et al. Predictors of outcome and long-term survival in patients with pleural infection. Am J Respir Crit Care Med 1999;160:1682–7. [DOI] [PubMed] [Google Scholar]
- [7].Santotoribio JD, Leon-Justel A, Delgado-Pecellin C, et al. What are the biochemical parameters of pleural fluid that best identify parapneumonic effusions? Ann Clin Biochem 2009;46:176–7. [DOI] [PubMed] [Google Scholar]
- [8].Manuel Porcel J, Vives M, Esquerda A, et al. Usefulness of the British Thoracic Society and the American College of Chest Physicians guidelines in predicting pleural drainage of non-purulent parapneumonic effusions. Respir Med 2006;100:933–7. [DOI] [PubMed] [Google Scholar]
- [9].Assicot M, Gendrel D, Carsin H, et al. High serum procalcitonin concentrations in patients with sepsis and infection. Lancet 1993;341:515–8. [DOI] [PMC free article] [PubMed] [Google Scholar]
- [10].Horie M, Ugajin M, Suzuki M, et al. Diagnostic and prognostic value of procalcitonin in community-acquired pneumonia. Am J Med Sci 2012;343:30–5. [DOI] [PubMed] [Google Scholar]
- [11].Ramirez P, Ferrer M, Marti V, et al. Inflammatory biomarkers and prediction for intensive care unit admission in severe community-acquired pneumonia. Crit Care Med 2011;39:2211–7. [DOI] [PubMed] [Google Scholar]
- [12].Ko YC, Wu WP, Hsu CS, et al. Serum and pleural fluid procalcitonin in predicting bacterial infection in patients with parapneumonic effusion. J Korean Med Sci 2009;24:398–402. [DOI] [PMC free article] [PubMed] [Google Scholar]
- [13].Determann RM, Achouiti AA, El Solh AA, et al. Infectious pleural effusions can be identified by sTREM-1 levels. Respir Med 2010;104:310–5. [DOI] [PubMed] [Google Scholar]
- [14].Niederman MS, Mandell LA, Anzueto A, et al. Guidelines for the management of adults with community-acquired pneumonia. Diagnosis, assessment of severity, antimicrobial therapy, and prevention. Am J Respir Crit Care Med 2001;163:1730–54. [DOI] [PubMed] [Google Scholar]
- [15].Lin MC, Chen YC, Wu JT, et al. Diagnostic and prognostic values of pleural fluid procalcitonin in parapneumonic pleural effusions. Chest 2009;136:205–11. [DOI] [PubMed] [Google Scholar]
- [16].Whiting PF, Weswood ME, Rutjes AW, et al. Evaluation of QUADAS, a tool for the quality assessment of diagnostic accuracy studies. BMC Med Res Methodol 2006;6:9. [DOI] [PMC free article] [PubMed] [Google Scholar]
- [17].Reitsma JB, Glas AS, Rutjes AW, et al. Bivariate analysis of sensitivity and specificity produces informative summary measures in diagnostic reviews. J Clin Epidemiol 2005;58:982–90. [DOI] [PubMed] [Google Scholar]
- [18].Porcel JM, Vives M, Cao G, et al. Biomarkers of infection for the differential diagnosis of pleural effusions. Eur Respir J 2009;34:1383–9. [DOI] [PubMed] [Google Scholar]
- [19].San Jose ME, Valdes L, Vizcaino LH, et al. Procalcitonin, C-reactive protein, and cell counts in the diagnosis of parapneumonic pleural effusions. J Investig Med 2010;58:971–6. [DOI] [PubMed] [Google Scholar]
- [20].Wang CY, Hsiao YC, Jerng JS, et al. Diagnostic value of procalcitonin in pleural effusions. Eur J Clin Microbiol Infect Dis 2011;30:313–8. [DOI] [PubMed] [Google Scholar]
- [21].Lee SH, Lee EJ, Min KH, et al. Procalcitonin as a diagnostic marker in differentiating parapneumonic effusion from tuberculous pleurisy or malignant effusion. Clin Biochem 2013;46:1484–8. [DOI] [PubMed] [Google Scholar]
- [22].Yeo CD, Kim JW, Cho MR, et al. Pleural fluid pentraxin-3 for the differential diagnosis of pleural effusions. Tuberc Respir Dis 2013;75:244–9. [DOI] [PMC free article] [PubMed] [Google Scholar]
- [23].Yan J, Li D, Xiong B. Effect of procalcitonin detection in distinguishing parapneumonic effusions from tuberculous pleural effusions. Mod Med J China 2015;17:21–3. [Google Scholar]
- [24].Khosla R, Khosla SG, Becker KL, et al. Pleural fluid procalcitonin to distinguish infectious from noninfectious etiologies of pleural effusions. J Hosp Med 2016;11:363–5. [DOI] [PubMed] [Google Scholar]
- [25].Chen XQ, Wang Z, Li X. Value of serum procalcitonin in the differentiation of causes of pleural exudates. J Clin Pulm Med 2013;18:1446–8. [Google Scholar]
- [26].Karkhanis VS, Joshi JM. Pleural effusion: diagnosis, treatment, and management. Open Access Emerg Med 2012;4:31–52. [DOI] [PMC free article] [PubMed] [Google Scholar]
- [27].Ito A, Ishida T, Tachibana H, et al. Serial procalcitonin levels for predicting prognosis in community-acquired pneumonia. Respirology 2016;21:1459–64. [DOI] [PubMed] [Google Scholar]
- [28].Gilbert D, Gelfer G, Wang L, et al. The potential of molecular diagnostics and serum procalcitonin levels to change the antibiotic management of community-acquired pneumonia. Diagn Microbiol Infect Dis 2016;86:102–7. [DOI] [PMC free article] [PubMed] [Google Scholar]
- [29].Glas AS, Lijmer JG, Prins MH, et al. The diagnostic odds ratio: a single indicator of test performance. J Clin Epidemiol 2003;56:1129–35. [DOI] [PubMed] [Google Scholar]
- [30].Zou MX, Zhou RR, Wu WJ, et al. The use of pleural fluid procalcitonin and C-reactive protein in the diagnosis of parapneumonic pleural effusions: a systemic review and meta-analysis. Am J Emerg Med 2012;30:1907–14. [DOI] [PubMed] [Google Scholar]
- [31].Higgins JP, Thompson SG. Quantifying heterogeneity in a meta-analysis. Stat Med 2002;21:1539–58. [DOI] [PubMed] [Google Scholar]


