

Abstract
Cancer cells survive cellular crisis through telomere maintenance mechanisms. We report telomere lengths in 18,430 samples, including tumors and non-neoplastic samples, across 31 cancer types. Tumor telomeres were shorter compared to normal tissues, and longer in sarcomas and gliomas compared to other cancers. Amongst 6,835 cancers, 73% expressed telomerase reverse transcriptase (TERT), which was associated with TERT point mutations, rearrangements, DNA amplifications, and transcript fusions, and predicted telomerase activity. TERT promoter methylation provided an additional deregulatory TERT expression mechanism. Five percent of cases, mostly with undetectable TERT, harbored ATRX or DAXX alterations, demonstrated elongated telomeres and increased telomeric repeat containing RNA (TERRA). The remaining 22% of tumors neither expressed TERT, nor harbored alterations in ATRX/DAXX. In this group, telomere length positively correlated with TP53 and RB1 mutations. Our analysis integrates TERT abnormalities, telomerase activity and genomic alterations with telomere length in cancer.
INTRODUCTION
Telomeres make up the terminal ends of each chromosome and are composed of repetitive DNA sequence (TTAGGG)n and bound proteins1. These complexes function by protecting the chromosome ends from being recognized as DNA double strand breaks and preventing inadvertent activation of detrimental DNA damage response pathways2. Telomeres shorten with each cell division which eventually triggers cellular senescence resulting in growth arrest3, a process that can be circumvented by the inactivation of p53 and Rb tumor suppressor proteins4–7. Further cell division leads to cellular crisis and ultimately cell death. Rare cells can overcome crisis through telomere maintenance.
Senescence and crisis are potent tumor suppressive mechanisms8, and maintenance of telomere length is therefore an important step in oncogenesis. Telomere shortening can be counteracted by activating telomerase9. The telomerase enzymatic subunit is encoded by TERT, and while it is transcriptionally silent in most non-neoplastic cells, reactivation may endow a small population of cells with the ability to survive crisis, at which point they become immortalized10. It has been proposed that up to 90% of human cancers reactivate telomerase11. Several mechanisms have since been associated with TERT reactivation, including TERT promoter mutations, TERT promoter rearrangements, and TERT DNA copy number amplifications12–15. Alternative lengthening of telomeres (ALT), a homologous recombination based process, is frequently observed in tumors with lack of telomerase activity and manifests with long but highly variable telomeres16,17. Deactivating mutations in ATRX and its binding partner DAXX were found tightly correlated with long telomeres in pancreatic neuroendocrine tumors18 and glioma19. Recent evidence suggested that loss of ATRX may contribute to ALT by promoting sustained sister telomere cohesion and chromatid exchange20.
Here, we analyzed 18,430 unique samples, including tumors (n=9,065), blood controls (n=7,643) and solid tissue controls (n=1,722), from 9,127 patients across 31 cancer types, to identify genomic and transcriptomic characteristics of telomere length.
RESULTS
Telomere length in human cancer and matching normal tissue
Telomere length (TL) is expected to vary between tumor types due to varying frequencies of ALT, different age distributions and variability of telomere lengths amongst cell of origin from different lineages. In order to quantify this heterogeneity, we estimated TL for 18,430 samples across 31 cancer cohorts available through The Cancer Genome Atlas (TCGA), including samples profiled using whole-genome sequencing (WGS, n=2,018); low-pass whole-genome sequencing (LPS, n=1,929); and whole-exome sequencing (WXS, n=14,483) (Figure 1a, Supplementary Table 1)21. The full dataset consisted of tumor samples, blood normal samples, and solid tissue controls (Supplementary Figure 1a). Matching tumor and normal (T/N) samples were available from 8,953 unique patients (Supplementary Figure 1b) and using tumor/normal TL ratios alleviated technical effects from differences in sequencing center and method (Supplementary Figure 2).
Figure 1. Telomere length in human cancer.
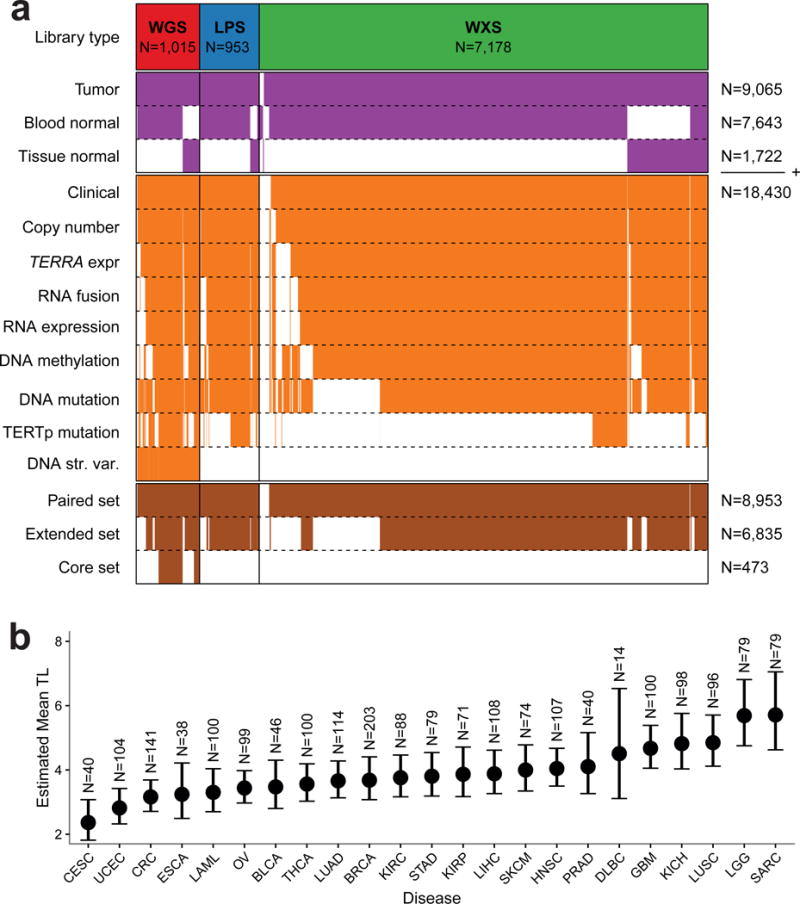
(a) Heatmap of patients in the unpaired set (in purple, N=18,430) and fully paired set (in brown, N=8,953). Each column represents a single patient. Rows in orange represent available data depending on platform. The extended set (N=6,835) and core set (N=473) are given in brown. (b) Linear mixed model mean TL estimates using the high-confidence WGS set (N=2,018) by sample type and for each tumor type. Error bars indicate 95% confidence interval. Estimates were adjusted for age, gender and sequencing center. Definitions for tumor type acronyms can be found in the Online Methods.
In order to compare TL across tumors and normal tissues, we used linear mixed modeling to adjust high-confidence WGS-based TL (n=2,018) for confounding effects (Supplementary Table 2). In addition to 734 blood normal samples, this analysis included 213 normal tissue samples of five different tissue types, including liver (n=21), lung (n=46) and kidney (n=81). We did not detect statistically significant differences between tissue types and confirmed considerable variability between samples from the same tissue type22 (Supplementary Figure 3a and 3b) and negative correlation between TL and age (Supplementary Figure 3c).
Across neoplastic samples cervical (2.36 Kb, 95%CI 1.82–3.07 Kb) and endometrial cancer (2.82 Kb, 95%CI 2.32–3.42 Kb) showed the shortest average TL whereas glioma (5.69 Kb, 95%CI 4.75–6.81 Kb) and sarcoma (5.71 Kb, 95%CI 4.63–7.05 Kb) showed the longest (Figure 1b). Tumors showed relative TL shortening (tumor TL < normal TL) compared to matched normals in 70% and relative TL elongation (tumor TL > normal TL) in 30% of our cohort (Supplementary Figure 1b). Tumor types that showed the highest rates of relative longer TL included testicular germ cell tumors (52%), lower grade glioma (54%) and sarcoma (55%), possibly reflecting the high telomerase activity seen in malignant testicular germ cell tumors23 and the high frequency of ALT in lower-grade glioma and sarcoma. Conversely, uveal melanoma (100%), kidney chromophobe (89%), kidney papillary (n=238/283, 84%) and lymphoma (84%) demonstrated the highest rate of relatively shorter TL.
Multiple modalities associated with TERT overexpression
To catalogue somatic alterations that may lead to overexpression of TERT in cancer, we performed a genomic and epigenetic TERT survey. We curated a core sample set that consisted of 473 T/N pairs with the most comprehensive molecular profiling and an extended set that consisted of 6,835 T/N pairs with varying numbers of cases profiled by each individual platform (Figure 1a, Online Methods). TERT promoter (TERTp) mutations, predominantly C250T and C228T, were detected in 27% of the extended set for the cases where TERTp status could be determined (n=1,581). In agreement with previous reports24,25; high incidence of TERTp mutations was found in bladder cancer (42/60, 70%), liver cancer (73/162, 45%), melanoma (93/129, 72%), lower grade glioma (127/285, 45%) and glioblastoma (25/28, 89%, Supplementary Figure 4a). We found TERT focal amplifications in four percent of all samples and these events were most frequently observed in ovarian cancer (6/27, 22%), lung adenocarcinoma (63/476, 13%) and lung squamous cell carcinoma (23/167, 14%), esophageal carcinoma (23/168, 14%) and adrenocortical carcinoma (11/75, 15%, Supplementary Figure 4b)14. Structural variants (SV) involving TERT or the TERT upstream regulatory region (TERTp) were detected in 15 samples (3%) respectively 17 samples (4%) of the core set (Figure 2a and Supplementary Table 3). TERT/TERTp structural variants were most frequent in sarcoma (10/39, 26%), hepatocellular carcinoma (7/50, 14%), kidney chromophobe (5/49, 10%) and prostate cancer (2/20, 10%)(Supplementary Figure 4c).
Figure 2. Multiple modalities associated with TERT overexpression.
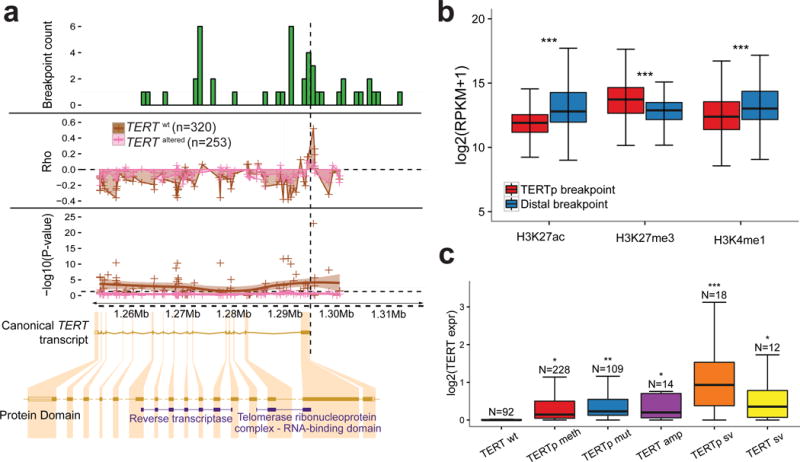
(a) Top: Histogram of DNA breakpoints in TERT in the core set (n=473). SpeedSeq detected 44 breakpoints aligning to TERT or the TERT promoter in 30 samples. Middle: Smoothed scatter plot of the correlation coefficient and significance of probe-expression correlations for TERT. Each point represents an Illumina 450k probe. The vertical dashed line represents the transcription start site. The analysis was performed separately for TERT wt and TERT altered samples. Bottom: The x-axis is represented by the canonical TERT transcript visualized using the Ensembl browser. Protein domains shown according to Pfam. (b) Boxplot of H3K27ac, H3K27me3 and H3K27me1 levels from the NIH Roadmap Epigenomics dataset at the locations of TERTp structural variant proximal and distal breakpoints (N=17). This dataset consists of 183 biological samples consolidated into 111 epigenomes (Suppl. Methods). P-values were calculated using two-sided t-tests. (c) Boxplot of TERT expression in groups of various TERT alterations. TERT expression in each TERT altered group was compared to the TERT wt group using a two-sided t-test. *** P<0.0001; ** P<0.001; * P<0.05; N.S. not significant.
TERT promoter rearrangements have been proposed to lead to juxtaposition of enhancer elements in neuroblastoma15. To investigate this hypothesis using our dataset, we overlaid the genomic positions with a database of 65,950 super enhancers across 107 tumor and normal cell types26. In the majority of TERTp structural variants (65%), at least one predicted super enhancer was found to directly overlap with the juxtaposed position (Supplementary Table 3). We compared the enhancer marks histone H3K27 acetylation (H3K27ac) and H3K4 mono-methylation (H3K4me1) signal27 for each of the breakpoints in the TERT promoter and the juxtaposed, distal, breakpoints across 111 epigenomes available from Roadmap Epigenomics Consortium28 and found significant enrichment for enhancer marks in the juxtaposed position compared to the TERT promoter (Figure 2b, Supplementary Figure 4d). Our data suggest that TERT promoter rearrangements may result in repositioning of enhancer elements that activate TERT transcription.
We next performed a supervised search for TERT gene fusions29,30. TERT fusion transcripts were detected in 3% of the extended set (Supplementary Figure 5a and Supplementary Table 3). TERT was always the 3′ partner gene, and in 13 of 19 fusions the 5′ partner gene resided on chromosome 5. All fusions demonstrated altered exon expression flanking the fusion point, and 16/19 TERT fusion breakpoints fell in the second intron. Both exons two and three map to the telomerase RNA binding domain and it is thus unlikely that the fusion product retains canonical TERT functionality31,32. We observed read coverage on exon 2 in 15 of 16 samples, suggesting that additional TERT transcripts were expressed.
Taken together, we found somatic TERT alterations including TERTp mutations, TERT amplifications and TERT structural variants involving gene promoter or gene body in 32% of core set samples. Somatic TERT alterations associated with detectable TERT transcripts in 93%. Next, we evaluated whether epigenetic mechanisms could also be related to TERT transcriptional activation. We correlated TERT expression to DNA methylation probes mapping to the TERT gene body (n=72) and promoter (n=3). We observed moderate correlations between TERTp DNA methylation and TERT expression in samples carrying a somatic TERT alteration (FDR>0.05, abs(Rho)<0.3; Figure 2a). In contrast, samples lacking somatic TERT alterations showed significant negative correlation between gene body methylation and expression, and positive correlation between promoter methylation and expression (Figure 2a). As previously described in pediatric brain tumors33, TERT promoter probe cg11625005 demonstrated a strong correlation with TERT expression (Rho=0.52, FDR<0.0001). Further comparison of this probe using 537 paired tumor and adjacent tissue normal samples showed a general absence of methylation of this probe in normal samples (Supplementary Figure 5b).
We found that 63% of TERT wild type tumors in the core set expressed TERT, of which 91% showed promoter DNA methylation compared to 40% of the TERT non-expressing samples. Altogether, 95% of TERT expressing samples showed TERTp mutations (31%), TERT amplification (3%), TERT structural variants (3%), TERTp structural variants (5%) or TERTp methylation (53%). Amongst different types of TERT aberrations, the TERTp sv group showed the highest transcription levels (two-sided t-test P<0.05, Figure 2c). TERTp methylation (two-sided t-test P<0.05) and TERTp mutations (two-sided t-test P<0.0001) were associated with relative TL shortening compared to other types of TERT alterations (Supplementary Figure 5c).
We next performed a similar analysis of TERC, the RNA subunit of the telomerase complex34. TERC was amplified in four percent of samples in the extended set, and most frequently in lung squamous cell carcinoma (n=68/167, 41%), esophageal cancer (n=36/168, 21%) and ovarian cancer (n=6/27, 22%). We did not identify mutations or structural variants targeting TERC. Focal TERC amplifications were associated with increased TERC expression (two-sided t-test P<0.0001) (Supplementary Figure 5d), and were enriched in TERT expressing samples (Odds Ratio (OR) 2.59, Fisher’s Exact P<0.0001).
Inferring telomerase activity using a gene expression signature
Previous studies have shown a complex role for transcription of the TERT gene and its various isoforms in determining telomerase activity35–37, in part because only the full length TERT transcript can encode enzymatically active protein38. The minus beta isoform skips exons 7 and 8 and prematurely stops at exon 10 and is thought to be the most abundant TERT splice variant in cancer (Supplementary Table 4)39,40. We evaluated the presence of the minus beta transcripts in 1,201 samples with sufficient exon 6 to 9 coverage using MISO41 (Supplementary Figure 6a). Full-length transcripts were detected in all samples and were significantly more abundant than minus beta transcripts (one-sample t-test P<0.0001, Mu=50%; Supplementary Figure 6b).
Given the limitations of TERT expression as measured by RNAseq in predicting telomerase activity, and lack of telomerase measurements in the TCGA proteomics datasets (data not shown), we inferred telomerase activity through a gene signature (Supplementary Table 4). The signature showed a positive correlation with telomerase enzymatic activities determined in urothelial cancer cell lines (n=11, Supplementary Figure 7a), without reaching statistical significance (P=0.07)35. Telomerase activity scores were significantly higher in tumor samples compared to various solid tissues (Supplementary Figure 7b), with kidney chromophobe carcinoma representing an exception. Both results suggested that the gene signature provided a general estimate of telomerase activity.
We found telomerase signature scores were significantly higher in TERT expressing cancers than non-expressing cancers in both core and extended set (both P<0.0001, Wilcoxon rank sum test). Samples with TERT amplification scored highest, followed by promoter methylation, gene body and promoter structural variation, and promoter mutation (Supplementary Figure 7c). TERC amplification was additionally associated with higher telomerase signature scores compared to non-amplified samples (two-sided t-test, P<0.0001), which may in part be explained by the co-expression patterns of TERT and TERC. Pan-cancer analysis using all 31 cancer types revealed a positive correlation between TERT expression and telomerase signature score (Rho=0.69, P<0.0001), with testicular germ cell tumors showing the highest average scores and pheochromocytoma and paraganglioma the lowest (Supplementary Figure 7d).
ATRX altered tumors show profound telomere elongation
To identify TERT-independent mechanisms involved in TL regulation, we associated somatic alterations to TL ratio in the extended set. We reduced the search space by selecting genes significantly mutated, genes focally deleted or gained, and genes from a manually compiled list of telomere associated genes (n=196; Supplementary Table 5). We found alterations of ATRX and IDH1 as the most significantly associated with relative TL elongation (both FDR<0.0001; Figure 3a). Since IDH1 mutations frequently co-occur with ATRX in glioma, we tested a model with both tumor type and IDH1 as covariates, and found IDH1 no longer associated with TL ratio (two-sided t-test P=0.15). Other hits (FDR<0.25) associated with relative TL elongation included TP53 (TL ratio 1.15, 95%CI 1.1–1.21, FDR<0.0001), BCOR (TL ratio 1.24, 95%CI 1.08–1.42, FDR=0.04), RB1 (TL ratio 1.14, 95%CI 1.04–1.25, FDR=0.05), CCNE1 (TL ratio 1.19, 95%CI 1.05–1.35, FDR=0.07) and TERC (TL ratio 1.14, 95%CI 1.02–1.27, FDR=0.16). Alterations of the VHL were found to be associated with relative TL shortening (TL ratio 0.7, 95%CI 0.61–0.8, FDR<0.0001). We repeated the analysis in each cancer type and found TP53 associated with relative TL elongation in six tumor types (Supplementary Figure 8a). Given the role of p53 in apoptosis regulation and senescence bypass, direct involvement of TP53 in telomere maintenance should be carefully tested in well-controlled conditions. A linear regression model showed that in addition to older age, positive TERRA expression, TP53 deletion, TP53 mutations, ATRX deletion, ATRX structural variants and absent/undetectable TERT expression were all independently associated with relative TL elongation (Figure 3b–c). Although DAXX has been linked to telomere length and ALT19,42, DAXX mutations (n=51/6,835) and deletions (n=5/6,835) did not associate with TL.
Figure 3. Multivariable Genomic Determinants of Telomere Length.
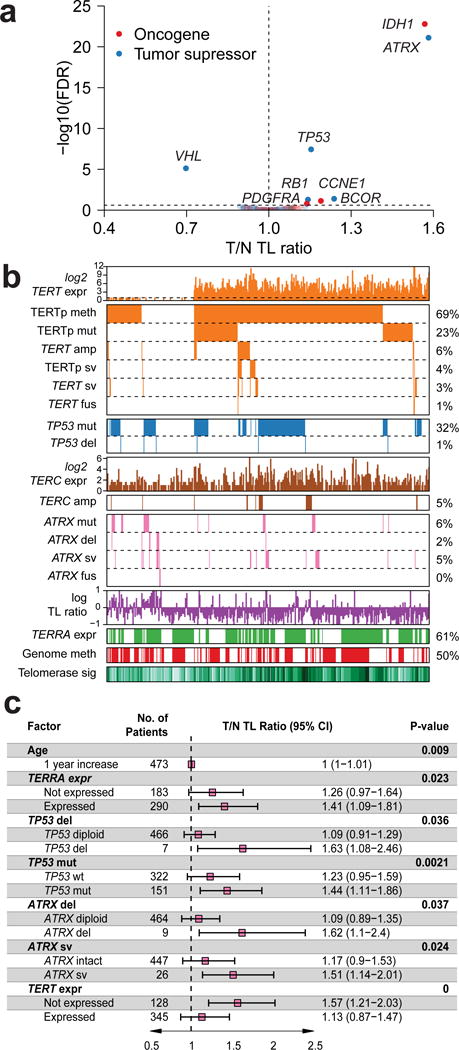
(a) Scatterplot showing gene to TL ratio associations using the extended set (N=6,835). P-values were calculated using a two-sided t-test and adjusted for multiple testing using FDR. (b) Heatmap of TERT, TERC, ATRX and TP53 expression and somatic alterations in the core set (N=473). TL ratio, TERRA expression and telomerase signature score are also shown. Each column represents a sample. (c) Linear regression analysis of TL ratio. Variables shown are independent predictors of TL in the core set (N=473). Variables from Figure 3b were selected using backwards elimination to derive the final model. R2 = 0.16.
Because of the strong correlation between ATRX and TL, we performed a thorough investigation of alterations affecting this gene. In addition to non-synonymous mutations and deletions, we detected ATRX structural variants from WGS data in 5% of the core set samples (n=26/473). In order to detect ATRX structural variants across the extended set, we used DNA copy number calls to detect breakpoints in ATRX (Supplementary Figure 8b). Despite the high detection threshold of this method (34% sensitivity, 100% specificity), ATRX structural variants were predicted in 70 of 6,835 samples (1%). ATRX fusion transcripts were found in seven extended set samples (Supplementary Figure 8c). ATRX was the 5′ gene partner in five fusion genes and the fusions were predicted to result in retaining less than 10% of the ATRX protein sequence. ATRX was the 3′ partner in two fusion transcripts and functional protein domains were retained in both.
We observed a significant decrease in ATRX expression in samples showing mutations, deletions, fusions and structural variants compared to cases with wild type ATRX (Figure 4a). We found that all of types of ATRX alteration associated with significantly longer TL compared to wild type ATRX, consistent with the previously established association between ATRX deactivation and ALT (Figure 4b).
Figure 4. ATRX altered tumors show profound telomere elongation.
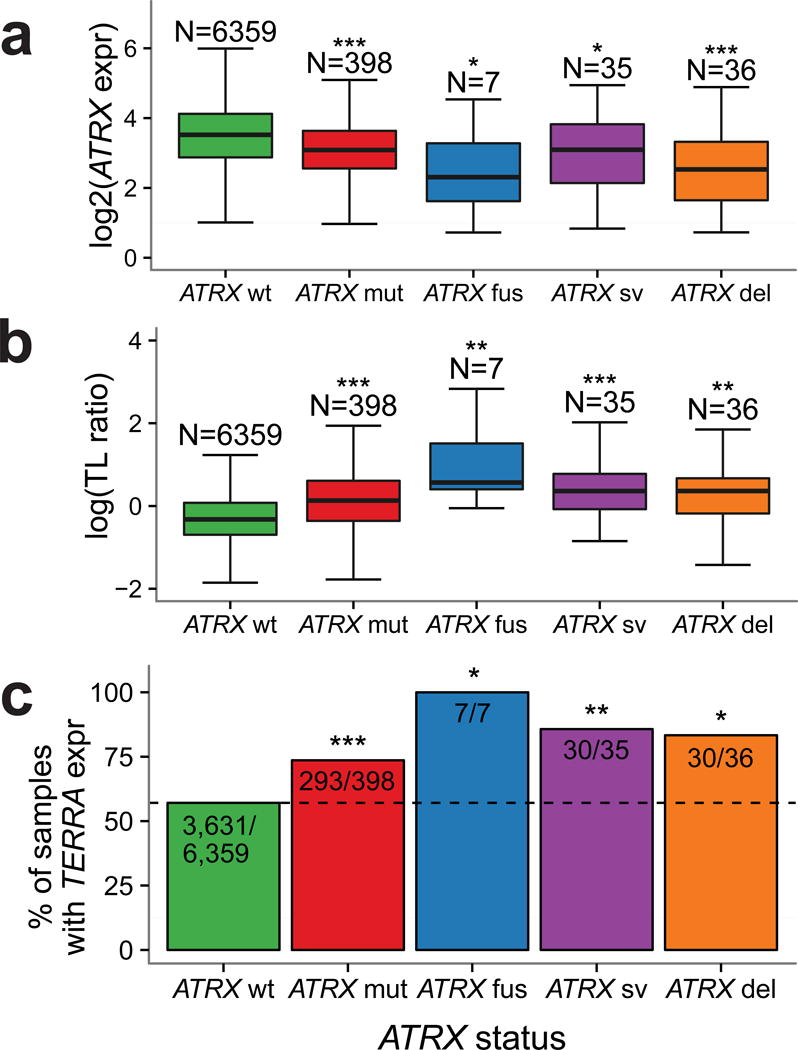
(a) Boxplot of ATRX expression in groups of ATRX alterations. Only non-synonymous mutations are considered. ATRX expression in ATRX altered groups was compared to the ATRX wt group using a two-sided t-test. (b) Boxplot of TL ratio in groups of ATRX alterations. TL ratio in ATRX altered groups was compared to the ATRX wt group using a two-sided t-test. (c) Barplot indicating the percentage of TERRA expressing tumors per group of ATRX alterations. Proportion of TERRA expressing samples in ATRX altered samples was compared to ATRX wt samples using a two-sided Fisher’s Exact test. *** P<0.0001; ** P<0.001; * P<0.05; N.S. not significant.
Recent studies found that ATRX knockdown resulted in elevated levels of telomeric repeat containing RNA (TERRA)43. We estimated TERRA levels using RNA sequencing in the extended set and in 566 non-neoplastic samples. Our results demonstrate a significantly higher fraction of TERRA expressing samples in all groups of ATRX altered samples (Figure 4c, Fisher’s Exact test P<0.05) compared to the group of ATRX wild type samples. TERRA expression was associated with relative TL elongation (two-sided t-test TL ratio 1.13, 95%CI 1.07–1.017, P<0.0001). Significantly more samples expressed TERRA in tumors lacking TERT expression, compared to samples expressing TERT (Fisher’s Exact OR 0.73, 95%CI 0.65–0.82, P<0.0001). In contrast, comparison of the TERRA levels of tumor samples to their matched normal controls (n=596, Fisher’s Exact test P=N.S.) showed no significant differences.
A substantial fraction of cancer samples lacks detectable TERT expression and mechanisms of ATRX deactivation
Due to the association between somatic ATRX and TERT alterations with TL, we grouped tumors in the extended set as TERT expressing (TERTexpr, n=5,001/6,835, 73%) and ATRX or DAXX altered (ATRX/DAXXalt, n=309/6,835, 5%). ATRX/DAXX mutations were found in 210 TERT expressing samples, representing 3% of the cohort. These events were in majority non-truncating, while ATRX/DAXX mutations in TERT-negative cases were mostly truncating (Supplementary Methods, Supplementary Figure 9a). TERT-expressing ATRX/DAXX mutants showed higher telomerase signature scores compared to ATRX/DAXX altered samples lacking TERT expression (Supplementary Figure 9b). Based on these observations we included these samples in the TERTexpr category. The remaining 22% of samples had neither detectable TERT expression, nor somatic alterations in ATRX or DAXX (wt/wt, n=1,525/6,835, Figure 5a). Both TERTexpr and wt/wt groups showed significantly higher telomerase signature scores than the ATRX/DAXXalt group (Figure 5b, two-sided t-test P<0.0001). The intermediate telomerase activity levels and variable TLs suggested that the wt/wt group comprises a heterogeneous set of tumors, some of which may have undergone ALT through mechanisms independent of ATRX and DAXX. The wt/wt samples were most frequent amongst pheochromocytoma (n=141/160, 88%), kidney papillary (n=113/161, 70%), kidney chromophobe (n=52/65, 80%) and thyroid cancer (n=343/449, 79%). Seven of the 101 wt/wt samples in the core set showed a somatic TERT alteration in absence of TERT expression, including a TERTp mutation (n=1), TERT amplification (n=2), TERTp or TERT structural variant (n=4).
Figure 5. A substantial fraction of cancer samples lacks detectable TERT expression and mechanisms of ATRX deactivation.
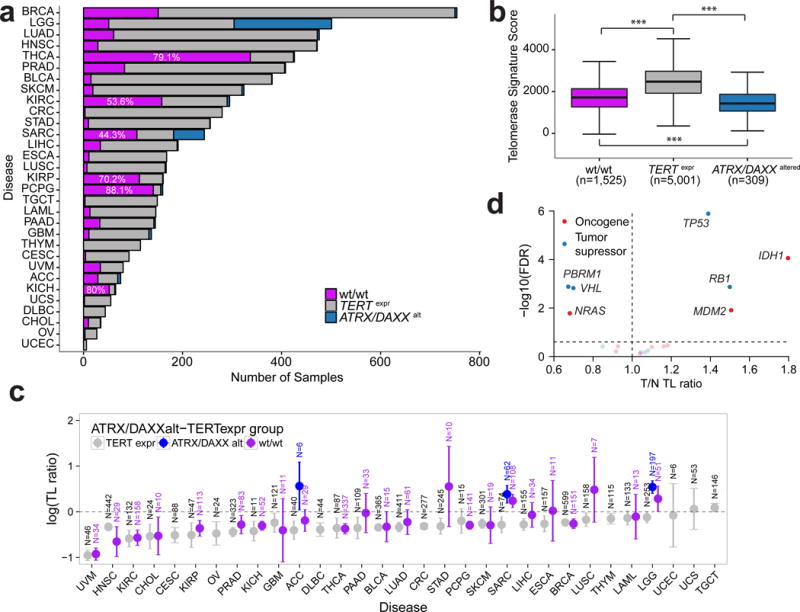
(a) Frequency of TERTexpr-ATRX/DAXXalt groups across cancer types in the extended set. Definitions for tumor type acronyms can be found in the Online Methods. (b) Telomerase signature score by TERTexpr-ATRX/DAXXalt groups. Telomerase signature score between groups was compared using two-sided t-tests. (c) T/N TL ratio by cancer type. TERTexpr-ATRX/DAXXalt groups are shown in different colors. Groups with less than 6 samples were omitted. Error bars indicate 95% confidence interval. Definitions for tumor type acronyms can be found in the Online Methods. (d) Scatterplot showing gene to T/N TL ratio associations within the wt/wt group (N=1,525). P-values were calculated using a two-sided t-test and adjusted for multiple testing using FDR. *** P<0.0001; ** P<0.001; * P<0.01; N.S. not significant.
TERTexpr samples showed relative TL attrition in most cancer types, ATRXalt samples tended to show relative TL elongation and wt/wt samples demonstrated cancer type dependent patterns (Figure 5c). For example, wt/wt sarcoma (TL ratio 1.27, 95%CI 1.1–1.47) and glioma (TL ratio 1.33, 95%CI 1.01–1.75) samples demonstrated relative TL elongation, whereas wt/wt thyroid (TL ratio 0.69, 95%CI 0.62–0.77), kidney chromophobe (TL ratio 0.74, 95%CI 0.67–0.81) and kidney clear cell (TL ratio 0.57, 95%CI 0.48–0.67) cancer samples showed relative TL attrition. Patterns of relative TL change from the wt/wt group may indicate that some tumors were detected before having acquired immortalized cells44, or that other mechanisms to develop ALT exist.
Because this analysis suggests that the prevalence of ALT may be underestimated by ATRX/DAXX inactivation alone, we sought to compare the prevalence of ATRX/DAXX alteration to published prevalence of ALT across 26 cancer types, including 40 histological subtypes (Supplementary Table 6)45. The prevalence of ALT exceeded that of ATRX/DAXX alterations in seven histological subtypes and was reduced in two, reinforcing the notion of cancer type specific and ATRX/DAXX independent ALT mechanisms.
To better understand alternative mechanisms that may contribute to telomere maintenance, we conducted an unsupervised search for TL ratio associated somatic alterations within the wt/wt group in the extended set. This analysis recovered strong associations between relatively long TL, IDH1 (TL ratio 1.8, 95%CI 1.39–2.33, FDR=0.0001), and TP53 (TL ratio 1.39, 95%CI 1.23–1.57, FDR<0.0001), both of which were also identified in the analysis of TL length in the entire dataset. The finding of IDH1 may reflect a glioma-specific effect. In addition to IDH1 and TP53, RB1 (TL ratio 1.5, 95%CI 1.2–1.87, FDR=0.001) and MDM2 (TL ratio 1.51, 95%CI 1.14–2, FDR=0.01) were revealed to associate with relatively long TLs. The finding of RB1 is consistent with experimental data demonstrating markedly elongated telomeres in Rb1 deficient mice independent of telomerase46,47. In the opposite direction, somatic alterations in PBRM1 (TL ratio 0.67, 95%CI 0.55–0.83, FDR=0.001), NRAS (TL ratio 0.68, 95%CI 0.52–0.9, FDR=0.02) and VHL (TL ratio 0.7, 95%CI 0.57–0.85, FDR=0.002) were associated with relative TL shortening (Figure 5d).
We compared global genomic characteristics between the three groups and found that wt/wt samples contained a lower number of copy number segments (two-sided t-test P<0.0001, Supplementary Figure 9c), and a reduced mutation rate (two-sided t-test P<0.0001, Supplementary Figure 9d) compared to TERTexpr and ATRX/DAXXalt samples. Survival analyses within cancer types showed that wt/wt samples perform better than TERTexpr samples in sarcoma and thyroid carcinoma (Supplementary Figure 9e). Telomerase activity score in wt/wt samples in these two cancer types were significantly lower (two-sided t-test P=7.0e-7 and P=7.8e-3, respectively), suggesting telomerase activity might represent a relevant prognostic factor in these cancers.
Telomere position effect
Provided the quantification of TL, we sought to relate TL to gene expression changes using the extended set and 566 adjacent tissue normal samples (Supplementary Table 7). We first investigated the telomere position effect (TPE), a phenomenon that describes TL mediated transcriptional regulation48. We found expression of genes close to telomeres to be negatively correlated with TL, and such effect attenuated with increased distance to telomeres (Figure 6a–b). Since tumors on average had shorter telomeres than matched normal samples, genes close to telomere showed higher expression in tumor than normal (Figure 6c). The TPE was no longer detectable beyond the distance of 10 million base pairs from telomeres (Figure 6a–b).
Figure 6. Telomere position effect.
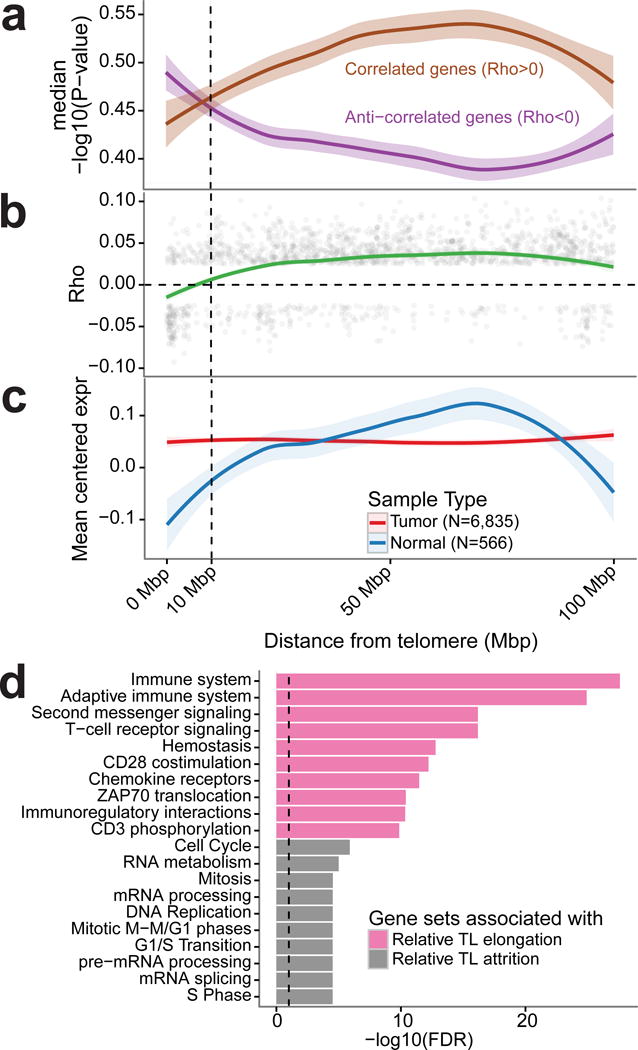
(a) Negative log10(P-value) for genes showing a correlation or an anti-correlation to tumor TL shown relative to the distance to the respective telomere. Spearman correlation tests were conducted individually within cancer types. P-values for N=3,477 genes were averaged across cancer types. (b) Spearman correlation coefficient across all cancer types for N=2,016 genes significantly associated to TL (FDR < 0.25) shown relative to the distance to the respective telomere. (c) Average gene expression (in TPM, transcripts per million) for tumor and normal samples relative to distance to the respective telomere. Mean expression was calculated for N=3,477 genes. (d) Reactome gene expression pathway analysis on the extended set (n=6,835 samples) of the top 500 genes most associated with relative TL elongation and relative TL shortening, respectively. Top ten pathways for each set of 500 genes shown.
To identify genesets associated with TL attrition and elongation in an unsupervised fashion, we associated gene expression to TL attrition and elongation. Pathway analysis of the top 500 correlated genes indicate that relative TL attrition and elongation were associated with immunoreactive and proliferative signatures, respectively (Figure 6d). These patterns may reflect differences in telomere maintenance rather than telomere attrition and elongation, and describe frequently observed patterns of expression across cancer, potentially related to more and less aggressive tumors49.
DISCUSSION
This study represents the largest in-depth integrative analysis of telomere length and related somatic alterations performed to date. As expected, tumor TL was shorter compared to normal tissue TL, and TL was inversely correlated with age in both tumor and non-neoplastic tissues. Amongst TERT expressing tumors, 32% carried at least one of three TERT abnormalities: promoter mutation, amplification or chromosomal rearrangement. Of TERT expressing and wild type tumors, 91% was TERT promoter methylated compared to 40% of tumors lacking TERT transcription. This paradoxical association between TERT promoter methylation and increased TERT expression may result from loss of CTCF binding, a transcriptional repressor reported to bind to the unmethylated TERT promoter50. Structural TERT variants have been documented15,51,52 and we detected these across several novel cancer types, including sarcoma, prostate and liver carcinoma. Hepatitis B virus and adeno-associated virus type 2 integration in TERT was found in about 5% of hepatocellular carcinomas53. The absence of similar observations in other virus related cancer types, including head and neck, bladder, and gastric cancers, suggest it is a liver cancer specific mechanism thus was not considered in our study.
Whether TERT expression directly translates to active telomerase activity is unclear. Only the full-length transcript and not known isoforms were found to activate telomerase32,40. TERC expression is additionally needed for telomerase activity54. An estimated 5–10% of TERC and TERRA carry the poly-A tails required for oligo-dT primer based RNA sequencing quantification55–57. We detected TERC and TERRA expression across our cohort, suggesting that if expression is sufficiently high, transcripts can be detected using conventional RNA sequencing approaches. Lacking telomerase activity data, we sought to infer telomerase activity using a gene signature driven approach. Our results suggested a positive correlation between TERT expression and telomerase activity, corroborating recent findings in bladder cancer35. We also observed a positive correlation between TERC expression and telomerase activity, as well as increased telomerase activity in TERT expressing tumors compared to ATRX/DAXX altered tumors and double wild-type tumors. This gene signature may serve as a useful proxy for estimating telomerase activity using transcriptional profiles.
Deactivation of ATRX and/or DAXX has been related to ALT19,20,58, and was observed in five percent of the cases in our core set. A detailed review of ATRX somatic changes revealed a large spectrum of potentially protein truncating changes, including inactivating mutations, deletions and structural variants. DAXX alterations were much less frequent. Our analysis reinforced the association of inactivate ATRX/DAXX and ALT, demonstrating relative TL elongation in samples affected by somatic alterations in one of these two genes and a higher frequency of TERRA expression in tumors with these alterations.
The twenty two percent of cases that lacked detectable TERT expression and known ALT related abnormalities provide an important result from our analysis. It is plausible that TERT transcription below the currently applied detection threshold may be sufficient for telomere maintenance, that not all tumors harbor immortalized cells with a telomere maintenance mechanism44, or that additional telomere maintenance mechanisms exist. Such mechanisms may involve some RB1 and TP53 alterations, as somatic changes in these genes were associated with telomere elongation within this group. Interestingly, double wild-type tumors were mostly pheochromocytoma and paraganglioma, kidney chromophobe and papillary thyroid tumors. Pheochromocytoma is generally (>90%) labeled benign. Chromophobe renal cell carcinoma and papillary thyroid cancer are malignant tumors but are generally well differentiated, infrequently metastasize and demonstrate a favorable outcome compared to other cancer types59–62. Future studies are needed to elucidate the telomere maintenance mechanisms, or lack thereof, in these tumor types.
In summary, our analysis has broadened the scope of potential TERT activating changes, completed the spectrum of ATRX truncating alterations and provided new insights into the telomere biology of tumors lacking these classic alterations. Combined these findings help us better understand telomere biology, and opens avenues for functional studies to help us understand how to target this crucial pathway in oncogenesis.
DATA AVAILABILITY
All TCGA data are publicly available through NCI Genomic Data Commons (https://gdc.cancer.gov/). Cases used in this study and their telomere length estimates are provided in Supplementary Table 1.
ONLINE METHODS
Sample selection
The 31 cancer types included in this study were: LAML acute myeloid leukemia; ACC Adrenocortical carcinoma; BLCA Bladder Urothelial Carcinoma; LGG Brain Lower Grade Glioma; BRCA Breast invasive carcinoma; CESC Cervical squamous cell carcinoma and endocervical adenocarcinoma; CHOL Cholangiocarcinoma; COAD Colon adenocarcinoma; ESCA Esophageal carcinoma; GBM Glioblastoma multiforme; HNSC Head and Neck squamous cell carcinoma; KICH Kidney Chromophobe; KIRC Kidney renal clear cell carcinoma; KIRP Kidney renal papillary cell carcinoma; LIHC Liver hepatocellular carcinoma; LUAD Lung adenocarcinoma; LUSC Lung squamous cell carcinoma; DLBC Lymphoid Neoplasm Diffuse Large B-cell Lymphoma; OV Ovarian serous cystadenocarcinoma; PAAD Pancreatic adenocarcinoma; PCPG Pheochromocytoma and Paraganglioma; PRAD Prostate adenocarcinoma; READ Rectum adenocarcinoma; SARC Sarcoma; SKCM Skin Cutaneous Melanoma; STAD Stomach adenocarcinoma; TGCT Testicular Germ Cell Tumors; THYM Thymoma; THCA Thyroid carcinoma; UCS Uterine Carcinosarcoma; UCEC Uterine Corpus Endometrial Carcinoma; UVM Uveal Melanoma.
We removed cases that were annotated as having a bad DNA quality or failing a QC step. We also removed technical replicates and samples from patients who had prior systematic treatment or revised pathological diagnosis. Tumor and control samples from each patient were paired, selecting a blood-derived control if both blood and solid tissue control were available. A comprehensive sample selection procedure can be found in the Supplementary Note and a schematic is shown in Supplementary Figure 1a.
Data Generation
Raw RNA and DNA sequencing data (n=35,978 samples) was downloaded from CGHub63 and processed through a flowr64 pipeline consisting of various components depending on the data type. Processed clinical, gene expression, DNA methylation, copy number segmentation and mutation data were downloaded and compiled from previously published TCGA papers, the Firehose data portal (Broad Institute, Cambridge, MI) and the TCGA data portal (NIH, Washington, DC). GISTIC65 was employed on the processed segmentation files to infer somatic copy number changes. A more detailed description of the data collection and generation process is described in the Supplementary Note.
Telomere length quantification
Quantification of telomere length (TL) was performed using the TelSeq tool21. Briefly, this tool counts the number of reads containing any (range k to ∞) amount of telomeric repeats (nk), or TTAGGG[k,∞), and the GC-adjusted coverage s. The quotient of the number of telomeric repeats and the GC-adjusted coverage is then multiplied by the average chromosome length c (c=332720800/46000, in Kbp), resulting in the estimated telomere length in Kbp l.
We used a k of 7, as per the author’s recommendations. Using the default settings from TelSeq, this calculation is done individually for each read group within a sample. In order to calculate the average TL for each sample, the weighted average length was used, supplying the total number of reads in each read group as weight.
RNA-seq BAM files were also processed using TelSeq (k=7) to obtain an estimate of TERRA expression. Because TERRA expression demonstrated a bimodal distribution, and over 40% of samples lacked any detectable TERRA expression, TERRA expression was dichotomized using a cutoff of zero.
TERT promoter mutation detection
We used GATK66 pileup to determine bases mapping to each position 200 bp upstream of the TERT transcription start site (chr5:1295162-1295404, hg19) in 1,771 tumor samples and matched normal controls from 20 cancer types where whole genome or low-pass whole genome sequencing data was available.
We first performed an unsupervised screen, testing each of 200 sites in every tumor and matched normal. For each site we required a minimum coverage of 10 reads, minimum variant allele fraction of 25% in tumor and maximum variant allele fraction of 2% in normal. Fisher’s test was used to determine significance and a threshold of 0.05 was used. Samples with TERT expression below a threshold of 2 reads were filtered from the analysis. Four sites demonstrated significance in at least one sample: C228, C250, C242/243 and C169. We then determined the nucleotides called in each of the affected sites, and found that all affected sites underwent a C>T transition.
Next, we performed a supervised analysis using the four sites above in all tumor samples to determine TERT promoter status. For each tumor sample, we required a minimum coverage of 6bp across all aforementioned sites in order to call TERTp status. Because all GBM samples lacked any coverage at the C169 site, this site was excluded in this tumor type. In order to call the mutation, we required at least 15% variant reads.
There was sufficient coverage for TERTp mutation calling in 903 samples, and we detected TERTp mutations in n=183, including C228T (n=128), C250T (n=49), C242/243T (n=5) and C169T (n=1). Next, we combined these calls with n=1077 TERTp calls obtained by targeted sequencing from adrenocortical carcinoma (n=91), lower grade glioma (n=287), hepatocellular carcinoma (n=196), melanoma (n=119) and papillary thyroid carcinoma (n=384) for a grand total of N=1807 TERTp mutation calls. In cases where WGS and targeted sequencing based calls disagreed we selected the mutated variant.
Structural variant detection
We used SpeedSeq67 in order to call structural variants in WGS-based BAM files. The SpeedSeq pipeline was built using our in-house pipeline building tool Flowr64, and ran on a high performance computing cluster at the UT MD Anderson Cancer Center. BAM files were realigned using BWA-MEM68. The resulting calls in VCF format were filtered against matching normal. Only somatic events with at least 3 supporting reads were retained.
Because we were only interested in variants involving TERT (chr5:1253287-1315162, including 20kb upstream of the TSS) and ATRX (chrX:76760356-77041719), variants not overlapping one of these regions were excluded. An overview of all included variants can be found in Supplementary Table 2.
Fusion transcript detection
All fusion transcripts were detected using the pipeline of RNA-seq Data Analysis (PRADA) as previously described29,30. Briefly, chimeric fusion transcripts were detected from the realigned bam files mapped to a combined genome and transcriptome reference, based on the evidence of both discordant read pairs and fusion-spanning reads, where discordant read pairs represent the paired read-ends that map uniquely to two protein coding genes, fusion-spanning reads mapped to the exon–exon junctions between two coding genes. Then the confidence of the detected fusion were evaluated based on the number of junction spanning reads and discordant read pairs, gene partner uniqueness, gene homology, open reading frame preservation, transcript allele fraction and presence of DNA breakpoints in adjacent distal regions. A complete overview of all gene fusions can be found on our fusion web portal (http://tumorfusions.org/). All fusions harboring TERT or ATRX transcripts were considered bona fide fusion calls based on the criteria described previously and therefore included in this study. A summary of included fusions can be found in Supplementary Table 2.
TERT isoform detection
PRADA aligned RNA-seq BAM files were available for n=6,625 (97% of the extended set) samples, missing data on ovarian carcinoma (OV, n=27) and prostate cancer (PRAD, n=175).
We applied the mixture of isoforms (MISO) model41 to each BAM to infer the relative abundance of full-length and minus beta TERT transcripts in each sample. Because the detection of isoforms is limited by the high GC-content of TERT combined with a 3′ bias by regular polyA enrichment RNAseq protocol and unevenly spread expression across exons, we limited the analysis to exons 6–9 only and applied a coverage threshold of at least twelve reads within this region. These filters reduced the sample cohort to 24% (n=1,201) of 5,001 tumors classified as TERT expressing in the extended set. The exon model used to infer isoform abundance has been included in Supplementary Table 4. Briefly, the minus beta isoform skips exons 7 and 8, and samples demonstrating predominantly minus beta transcripts should therefore demonstrate low coverage in exons 7 and 8 relative to 6 and 9, and show junction spanning reads between exons 6 and 9.
Structural variant breakpoint super enhancer and ChIP-seq analysis
Super enhancer coordinates were downloaded from dbSuper26 as of March 15th, 2016. At this time, the database consisted of 65,950 super-enhancers across 107 tissue and/or cell types. After excluding low-complexity regions and telo- and centromeres, regions in this database spanned approximately 18% of the genome. We used the UCSC genome browser69 to browse the database, and inspected the position of each of the juxtaposed genomic coordinates. This analysis found overlapping super-enhancers in 11/17 TERTp structural variants, and this was significantly more than expected by chance (Chi-Square test P=0.001).
Publicly available ChIP sequencing data was downloaded from the NIH Roadmap Epigenomics Mapping Consortium70. This dataset consists of 183 biological samples, from multiple individuals, sequencing centers, tissue and/or cell types and was further consolidated into 111 unique epigenomes. We identified N=44 tissue and/or cell types with H3K27ac (enhancer) sequencing, N=53 tissue and/or cell types with H3K4me1 (enhancer) sequencing and N=55 tissue and/or cell types with H3K27me3 sequencing (inactive promoter). Altogether we collected data from 71 distinct tissue and/or cell types across these three marks. Collected BED files were converted to BAM format and a total number of reads was computed for each sample and mark.
ChIP-seq data was downloaded as previously described. For each structural variant proximal (adjacent to the TERT promoter) and distal breakpoint (juxtaposed to the TERT promoter) we calculated the number of reads mapping to each of three histone marks (H3K27ac, H3K27me3 and H3Kme1) individually within each tissue and cell/type. Breakpoint coordinates were flanked on either side to form a 2kbp bin. Read counts were normalized to RPKM based on the total number of reads for each mark and sample. We then compared the RPKM between distal and proximal breakpoints for each histone mark for each set of breakpoint coordinates individually (Supplementary Figure 4d), and subsequently with all breakpoints pooled together (Figure 2b). P-values were calculated using a two-sided t-test for each mark individually.
Telomerase activity signature inference
Microarray gene expression data from eight dedifferentiented liposarcoma samples were downloaded from the Gene Expression Ominibus (GEO, GSE20559). We performed a differential expression analysis comparing four telomerase positive and four telomerase negative (ALT) samples and identified 1302 genes associated with telomerase positive tumors (fold-change ≥ 1.5). Intersecting with 420 genes associated with embryonic stem cells71, which are known to be telomerase positive, further refined this geneset and resulted in a list of 43 genes (Supplementary Table 4). Validation of the resulting gene signature using matched telomerase activity and RNA sequencing data from eleven urothelial cell carcinoma cell lines provided some evidence that this gene signature may be able to predict telomerase activity (Rho=0.58, P-value = 0.07, Supplementary Figure 7a). A detailed description of the strategy used to infer a telomerase activity signature may be found in the Supplementary Note.
Candidate gene selection and telomere length association
In order to narrow down the list of candidate gene and increase the FDR adjusted significance threshold, we took the union of the MutSig2CV72 gene list (FDR < 0.05, downloaded and compiled from publicly available Firehose analyses) from all cancer types, and combined this list with genes within significant GISTIC 2.0 peaks (FDR < 0.10) after filtering peaks larger than 1 Mbp.
Each gene was annotated as putative tumor suppressor or putative oncogene depending on the mutational patterns (see Supplementary Note) or whether it was found within an amplification or deletion peak. In those cases where the mutation-based classification did not agree with the copy number based classification (eg. gene with highly frequent hotspot mutations was found in a deletion peak), we selected to prefer the mutation-based classification. Genes lacking classification and genes where the mutation-based classification demonstrated contradicting evidence (eg. genes that could be classified as either tumor suppressor or oncogene) were dropped, unless the gene was present on a list of telomere related genes, in which case it was annotated as significantly mutated gene. The list of candidate genes was further reduced by removing multiple genes from the same peak, additionally leaving only those genes closely tied to telomere function when multiple genes present in the peak (eg. shelterin complex genes) and genes that were also found in the MutSig2CV gene list. The final list of genes can be found in Supplementary Table 5.
For each candidate gene and sample we determined whether it was altered or not depending on the classification. For genes classified as tumor suppressors we classified samples as altered when they showed a somatic mutation, a focal deletion or both. For genes classified as oncogenes we classified the sample as altered when they showed a somatic mutation, focal amplification or both. For genes classified as significantly mutated gene only somatic mutations were counted. Each candidate gene was then correlated to the TL ratio in all samples and within diseases individually. This analysis was repeated specifically within samples classified as double wild type.
Statistical analysis
Summary statistics of telomere length was provided in mean, SD, and range by tumor type and tissue type. Telomere length was transformed to the logarithmic scale due to skewness.
A linear mixed model was used to estimate mean telomere length of tumor and normal samples for each tumor type. Age, center and gender were included as a covariate in all models. Interaction between disease type and center, gender, and age were assessed and none was significant. Patient was modeled as a random effect in the mixed model to account for correlation between samples from the same patient.
Linear regression was used to correlate TL ratio to various biomarkers. Backwards elimination was then used to select the best model with only significant factors. All tests were two-sided and p-values of 0.05 or less were considered statistically significant.
Spearman correlation was used to associate TERT expression and methylation, and to correlate gene expression and TL. A two-sided t-test was used to correlate somatic alterations and TL. P-values were adjusted for multiple testing using the Benjamini-Hochberg false discovery rate (FDR). An FDR of 0.25 or lower was considered statistically significant.
Survival curves were estimated and plotted using the Kaplan-Meier method. Log-rank tests were used to compare curves between groups. Univariate and multivariate Cox modeling were used to compute hazard ratios and confidence intervals.
All statistical analyses were carried out using SAS version 9 (SAS Institute, Cary, NC) and R (R Foundation for Statistical Computing, Vienna, Austria).
URLs
PRADA fusion portal www.tumorfusions.org
Supplementary Material
Acknowledgments
We thank Dian Jiao and Daniel Jackson at the High Performance Computing facility at MD Anderson Cancer Center for assistance with data downloading and storage. We thank Dr. Ian R. Watson (McGill University) and Dr. Terrence Wu (MD Anderson Cancer Center) for insights on TCGA melanoma project; Dr. David Wheeler (Baylor College of Medicine) for insights on TCGA liver cancer project. We thank Dr. Sumit Borah and Dr. Thomas R. Cech (University of Colorado) for sharing telomerase enzymatic activity data of the 23 urothelial cancer cell lines. We thank Dr. Dominique Broccoli (Mercer University) for sharing the 14 gene signature from GSE20559. We thank Dr. Xiaojing Wang (Baylor College of Medicine) for help with CPTAC data and Andrea Barbo (MD Anderson Cancer Center) for statistical advice. We thank Bradley Murray (Broad Institute) for suggestions regarding the analysis of copy number data. We acknowledge the contributions from the TCGA Research Network. This project is supported by grants from the National Institutes of Health P30 CA16672, P30 CA034196, R01 CA190121, and P01 CA085878; and the Cancer Prevention & Research Institute of Texas (CPRIT) R140606. This work is dedicated to all patients who consented to have their samples analyzed by The Cancer Genome Atlas Network.
Footnotes
AUTHOR CONTRIBUTIONS
F.P.B. was involved in all aspects of data analysis. W.W. performed linear mixed modeling. M.T. and S.B.A. analyzed whole genome sequencing data. E.M. analyzed gene expression data. X.H. and Q.W. performed gene fusion analysis. K.A. was involved in methylation and epigenetics analysis. S.S., X.S. and J.Z. collected and analyzed low pass sequencing data. T.L. collected clinic data of the solid tissue samples. Z.S. designed the telomerase signature score. F.P.B., Z.S. and R.G.W.V conceived the study and wrote the paper. Z.S and R.G.W.V supervised the study.
COMPETING FINANCIAL INTERESTS
The authors declare no competing financial interests.
References
- 1.O’Sullivan RJ, Karlseder J. Telomeres: protecting chromosomes against genome instability. Nat Rev Mol Cell Biol. 2010;11:171–81. doi: 10.1038/nrm2848. [DOI] [PMC free article] [PubMed] [Google Scholar]
- 2.de Lange T. How telomeres solve the end-protection problem. Science. 2009;326:948–52. doi: 10.1126/science.1170633. [DOI] [PMC free article] [PubMed] [Google Scholar]
- 3.Olovnikov AM. A theory of marginotomy. The incomplete copying of template margin in enzymic synthesis of polynucleotides and biological significance of the phenomenon. J Theor Biol. 1973;41:181–90. doi: 10.1016/0022-5193(73)90198-7. [DOI] [PubMed] [Google Scholar]
- 4.Shay JW, Pereira-Smith OM, Wright WE. A role for both RB and p53 in the regulation of human cellular senescence. Exp Cell Res. 1991;196:33–9. doi: 10.1016/0014-4827(91)90453-2. [DOI] [PubMed] [Google Scholar]
- 5.Stewart SA, Weinberg RA. Telomeres: cancer to human aging. Annu Rev Cell Dev Biol. 2006;22:531–57. doi: 10.1146/annurev.cellbio.22.010305.104518. [DOI] [PubMed] [Google Scholar]
- 6.Maser RS, DePinho RA. Connecting chromosomes, crisis, and cancer. Science. 2002;297:565–9. doi: 10.1126/science.297.5581.565. [DOI] [PubMed] [Google Scholar]
- 7.Sahin E, DePinho RA. Axis of ageing: telomeres, p53 and mitochondria. Nat Rev Mol Cell Biol. 2012;13:397–404. doi: 10.1038/nrm3352. [DOI] [PMC free article] [PubMed] [Google Scholar]
- 8.Hackett JA, Greider CW. Balancing instability: dual roles for telomerase and telomere dysfunction in tumorigenesis. Oncogene. 2002;21:619–26. doi: 10.1038/sj.onc.1205061. [DOI] [PubMed] [Google Scholar]
- 9.Greider CW, Blackburn EH. Identification of a specific telomere terminal transferase activity in Tetrahymena extracts. Cell. 1985;43:405–13. doi: 10.1016/0092-8674(85)90170-9. [DOI] [PubMed] [Google Scholar]
- 10.Morales CP, et al. Absence of cancer-associated changes in human fibroblasts immortalized with telomerase. Nat Genet. 1999;21:115–8. doi: 10.1038/5063. [DOI] [PubMed] [Google Scholar]
- 11.Shay JW, Bacchetti S. A survey of telomerase activity in human cancer. Eur J Cancer. 1997;33:787–91. doi: 10.1016/S0959-8049(97)00062-2. [DOI] [PubMed] [Google Scholar]
- 12.Huang FW, et al. Highly recurrent TERT promoter mutations in human melanoma. Science. 2013;339:957–9. doi: 10.1126/science.1229259. [DOI] [PMC free article] [PubMed] [Google Scholar]
- 13.Horn S, et al. TERT promoter mutations in familial and sporadic melanoma. Science. 2013;339:959–61. doi: 10.1126/science.1230062. [DOI] [PubMed] [Google Scholar]
- 14.Zhang A, et al. Frequent amplification of the telomerase reverse transcriptase gene in human tumors. Cancer Res. 2000;60:6230–5. [PubMed] [Google Scholar]
- 15.Peifer M, et al. Telomerase activation by genomic rearrangements in high-risk neuroblastoma. Nature. 2015;526:700–704. doi: 10.1038/nature14980. [DOI] [PMC free article] [PubMed] [Google Scholar]
- 16.Bryan TM, Englezou A, Dalla-Pozza L, Dunham MA, Reddel RR. Evidence for an alternative mechanism for maintaining telomere length in human tumors and tumor-derived cell lines. Nat Med. 1997;3:1271–4. doi: 10.1038/nm1197-1271. [DOI] [PubMed] [Google Scholar]
- 17.Dilley RL, Greenberg RA. ALTernative Telomere Maintenance and Cancer. Trends Cancer. 2015;1:145–156. doi: 10.1016/j.trecan.2015.07.007. [DOI] [PMC free article] [PubMed] [Google Scholar]
- 18.Jiao Y, et al. DAXX/ATRX, MEN1, and mTOR pathway genes are frequently altered in pancreatic neuroendocrine tumors. Science. 2011;331:1199–203. doi: 10.1126/science.1200609. [DOI] [PMC free article] [PubMed] [Google Scholar]
- 19.Heaphy CM, et al. Altered telomeres in tumors with ATRX and DAXX mutations. Science. 2011;333:425. doi: 10.1126/science.1207313. [DOI] [PMC free article] [PubMed] [Google Scholar]
- 20.Ramamoorthy M, Smith S. Loss of ATRX Suppresses Resolution of Telomere Cohesion to Control Recombination in ALT Cancer Cells. Cancer Cell. 2015;28:357–69. doi: 10.1016/j.ccell.2015.08.003. [DOI] [PMC free article] [PubMed] [Google Scholar]
- 21.Ding Z, et al. Estimating telomere length from whole genome sequence data. Nucleic Acids Res. 2014;42:e75. doi: 10.1093/nar/gku181. [DOI] [PMC free article] [PubMed] [Google Scholar]
- 22.Dlouha D, Maluskova J, Kralova Lesna I, Lanska V, Hubacek JA. Comparison of the relative telomere length measured in leukocytes and eleven different human tissues. Physiol Res. 2014;63(Suppl 3):S343–50. doi: 10.33549/physiolres.932856. [DOI] [PubMed] [Google Scholar]
- 23.Albanell J, et al. Telomerase activity in germ cell cancers and mature teratomas. J Natl Cancer Inst. 1999;91:1321–6. doi: 10.1093/jnci/91.15.1321. [DOI] [PubMed] [Google Scholar]
- 24.Killela PJ, et al. TERT promoter mutations occur frequently in gliomas and a subset of tumors derived from cells with low rates of self-renewal. Proc Natl Acad Sci U S A. 2013;110:6021–6. doi: 10.1073/pnas.1303607110. [DOI] [PMC free article] [PubMed] [Google Scholar]
- 25.Vinagre J, et al. Frequency of TERT promoter mutations in human cancers. Nat Commun. 2013;4:2185. doi: 10.1038/ncomms3185. [DOI] [PubMed] [Google Scholar]
- 26.Khan A, Zhang X. dbSUPER: a database of super-enhancers in mouse and human genome. Nucleic Acids Res. 2016;44:D164–71. doi: 10.1093/nar/gkv1002. [DOI] [PMC free article] [PubMed] [Google Scholar]
- 27.Calo E, Wysocka J. Modification of enhancer chromatin: what, how, and why? Mol Cell. 2013;49:825–37. doi: 10.1016/j.molcel.2013.01.038. [DOI] [PMC free article] [PubMed] [Google Scholar]
- 28.Roadmap Epigenomics C, et al. Integrative analysis of 111 reference human epigenomes. Nature. 2015;518:317–30. doi: 10.1038/nature14248. [DOI] [PMC free article] [PubMed] [Google Scholar]
- 29.Torres-Garcia W, et al. PRADA: pipeline for RNA sequencing data analysis. Bioinformatics. 2014;30:2224–6. doi: 10.1093/bioinformatics/btu169. [DOI] [PMC free article] [PubMed] [Google Scholar]
- 30.Yoshihara K, et al. The landscape and therapeutic relevance of cancer-associated transcript fusions. Oncogene. 2015;34:4845–54. doi: 10.1038/onc.2014.406. [DOI] [PMC free article] [PubMed] [Google Scholar]
- 31.Yates A, et al. Ensembl 2016. Nucleic Acids Research. 2016;44:D710–D716. doi: 10.1093/nar/gkv1157. [DOI] [PMC free article] [PubMed] [Google Scholar]
- 32.Hrdlicková R, Nehyba J, Bose HR. Alternatively spliced telomerase reverse transcriptase variants lacking telomerase activity stimulate cell proliferation. Mol Cell Biol. 2012;32:4283–96. doi: 10.1128/MCB.00550-12. [DOI] [PMC free article] [PubMed] [Google Scholar]
- 33.Castelo-Branco P, et al. Methylation of the TERT promoter and risk stratification of childhood brain tumours: an integrative genomic and molecular study. Lancet Oncol. 2013;14:534–42. doi: 10.1016/S1470-2045(13)70110-4. [DOI] [PubMed] [Google Scholar]
- 34.Blasco MA. Telomeres and human disease: ageing, cancer and beyond. Nat Rev Genet. 2005;6:611–22. doi: 10.1038/nrg1656. [DOI] [PubMed] [Google Scholar]
- 35.Borah S, et al. Cancer. TERT promoter mutations and telomerase reactivation in urothelial cancer. Science. 2015;347:1006–10. doi: 10.1126/science.1260200. [DOI] [PMC free article] [PubMed] [Google Scholar]
- 36.Counter CM, et al. Telomerase activity is restored in human cells by ectopic expression of hTERT (hEST2), the catalytic subunit of telomerase. Oncogene. 1998;16:1217–22. doi: 10.1038/sj.onc.1201882. [DOI] [PubMed] [Google Scholar]
- 37.Rohde V, et al. Expression of the human telomerase reverse transcriptase is not related to telomerase activity in normal and malignant renal tissue. Clin Cancer Res. 2000;6:4803–9. [PubMed] [Google Scholar]
- 38.Hrdlickova R, Nehyba J, Bose HR., Jr Alternatively spliced telomerase reverse transcriptase variants lacking telomerase activity stimulate cell proliferation. Mol Cell Biol. 2012;32:4283–96. doi: 10.1128/MCB.00550-12. [DOI] [PMC free article] [PubMed] [Google Scholar]
- 39.Kilian A, et al. Isolation of a candidate human telomerase catalytic subunit gene, which reveals complex splicing patterns in different cell types. Hum Mol Genet. 1997;6:2011–9. doi: 10.1093/hmg/6.12.2011. [DOI] [PubMed] [Google Scholar]
- 40.Wong MS, Wright WE, Shay JW. Alternative splicing regulation of telomerase: a new paradigm? Trends Genet. 2014;30:430–8. doi: 10.1016/j.tig.2014.07.006. [DOI] [PMC free article] [PubMed] [Google Scholar]
- 41.Katz Y, Wang ET, Airoldi EM, Burge CB. Analysis and design of RNA sequencing experiments for identifying isoform regulation. Nat Methods. 2010;7:1009–15. doi: 10.1038/nmeth.1528. [DOI] [PMC free article] [PubMed] [Google Scholar]
- 42.Schwartzentruber J, et al. Driver mutations in histone H3.3 and chromatin remodelling genes in paediatric glioblastoma. Nature. 2012;482:226–31. doi: 10.1038/nature10833. [DOI] [PubMed] [Google Scholar]
- 43.Flynn RL, et al. Alternative lengthening of telomeres renders cancer cells hypersensitive to ATR inhibitors. Science. 2015;347:273–7. doi: 10.1126/science.1257216. [DOI] [PMC free article] [PubMed] [Google Scholar]
- 44.Reddel RR. The role of senescence and immortalization in carcinogenesis. Carcinogenesis. 2000;21:477–84. doi: 10.1093/carcin/21.3.477. [DOI] [PubMed] [Google Scholar]
- 45.Heaphy CM, et al. Prevalence of the alternative lengthening of telomeres telomere maintenance mechanism in human cancer subtypes. Am J Pathol. 2011;179:1608–15. doi: 10.1016/j.ajpath.2011.06.018. [DOI] [PMC free article] [PubMed] [Google Scholar]
- 46.Gonzalo S, et al. Role of the RB1 family in stabilizing histone methylation at constitutive heterochromatin. Nat Cell Biol. 2005;7:420–8. doi: 10.1038/ncb1235. [DOI] [PubMed] [Google Scholar]
- 47.García-Cao M, Gonzalo S, Dean D, Blasco MA. A role for the Rb family of proteins in controlling telomere length. Nat Genet. 2002;32:415–9. doi: 10.1038/ng1011. [DOI] [PubMed] [Google Scholar]
- 48.Robin JD, et al. Telomere position effect: regulation of gene expression with progressive telomere shortening over long distances. Genes Dev. 2014;28:2464–76. doi: 10.1101/gad.251041.114. [DOI] [PMC free article] [PubMed] [Google Scholar]
- 49.Martinez E, et al. Comparison of gene expression patterns across 12 tumor types identifies a cancer supercluster characterized by TP53 mutations and cell cycle defects. Oncogene. 2015;34:2732–40. doi: 10.1038/onc.2014.216. [DOI] [PMC free article] [PubMed] [Google Scholar]
- 50.Renaud S, et al. Dual role of DNA methylation inside and outside of CTCF-binding regions in the transcriptional regulation of the telomerase hTERT gene. Nucleic Acids Res. 2007;35:1245–56. doi: 10.1093/nar/gkl1125. [DOI] [PMC free article] [PubMed] [Google Scholar]
- 51.Valentijn LJ, et al. TERT rearrangements are frequent in neuroblastoma and identify aggressive tumors. Nat Genet. 2015;47:1411–1414. doi: 10.1038/ng.3438. [DOI] [PubMed] [Google Scholar]
- 52.Davis CF, et al. The somatic genomic landscape of chromophobe renal cell carcinoma. Cancer Cell. 2014;26:319–30. doi: 10.1016/j.ccr.2014.07.014. [DOI] [PMC free article] [PubMed] [Google Scholar]
- 53.Khoury JD, et al. Landscape of DNA virus associations across human malignant cancers: analysis of 3,775 cases using RNA-Seq. J Virol. 2013;87:8916–26. doi: 10.1128/JVI.00340-13. [DOI] [PMC free article] [PubMed] [Google Scholar]
- 54.Xi L, Cech TR. Inventory of telomerase components in human cells reveals multiple subpopulations of hTR and hTERT. Nucleic Acids Res. 2014;42:8565–77. doi: 10.1093/nar/gku560. [DOI] [PMC free article] [PubMed] [Google Scholar]
- 55.Chapon C, Cech TR, Zaug AJ. Polyadenylation of telomerase RNA in budding yeast. RNA. 1997;3:1337–51. [PMC free article] [PubMed] [Google Scholar]
- 56.Porro A, Feuerhahn S, Reichenbach P, Lingner J. Molecular dissection of telomeric repeat-containing RNA biogenesis unveils the presence of distinct and multiple regulatory pathways. Mol Cell Biol. 2010;30:4808–17. doi: 10.1128/MCB.00460-10. [DOI] [PMC free article] [PubMed] [Google Scholar]
- 57.Feuerhahn S, Iglesias N, Panza A, Porro A, Lingner J. TERRA biogenesis, turnover and implications for function. FEBS Lett. 2010;584:3812–8. doi: 10.1016/j.febslet.2010.07.032. [DOI] [PubMed] [Google Scholar]
- 58.Clynes D, et al. Suppression of the alternative lengthening of telomere pathway by the chromatin remodelling factor ATRX. Nat Commun. 2015;6:7538. doi: 10.1038/ncomms8538. [DOI] [PMC free article] [PubMed] [Google Scholar]
- 59.Przybycin CG, et al. Chromophobe renal cell carcinoma: a clinicopathologic study of 203 tumors in 200 patients with primary resection at a single institution. Am J Surg Pathol. 2011;35:962–70. doi: 10.1097/PAS.0b013e31821a455d. [DOI] [PubMed] [Google Scholar]
- 60.Guo Z, Lloyd RV. Pheochromocytomas and Paragangliomas: An Update on Recent Molecular Genetic Advances and Criteria for Malignancy. Adv Anat Pathol. 2015;22:283–93. doi: 10.1097/PAP.0000000000000086. [DOI] [PubMed] [Google Scholar]
- 61.Davies L, Welch HG. Increasing incidence of thyroid cancer in the United States, 1973–2002. JAMA. 2006;295:2164–7. doi: 10.1001/jama.295.18.2164. [DOI] [PubMed] [Google Scholar]
- 62.Lenders JWM, Eisenhofer G, Mannelli M, Pacak K. Phaeochromocytoma. Lancet. 2005;366:665–75. doi: 10.1016/S0140-6736(05)67139-5. [DOI] [PubMed] [Google Scholar]
- 63.Wilks C, et al. The Cancer Genomics Hub (CGHub): overcoming cancer through the power of torrential data. Database (Oxford) 2014;2014 doi: 10.1093/database/bau093. [DOI] [PMC free article] [PubMed] [Google Scholar]
- 64.Seth S, et al. Flowr: Robust and efficient pipelines using a simple language-agnostic approach. bioRxiv. 2015 [Google Scholar]
- 65.Mermel CH, et al. GISTIC2.0 facilitates sensitive and confident localization of the targets of focal somatic copy-number alteration in human cancers. Genome Biol. 2011;12:R41. doi: 10.1186/gb-2011-12-4-r41. [DOI] [PMC free article] [PubMed] [Google Scholar]
- 66.McKenna A, et al. The Genome Analysis Toolkit: a MapReduce framework for analyzing next-generation DNA sequencing data. Genome Res. 2010;20:1297–303. doi: 10.1101/gr.107524.110. [DOI] [PMC free article] [PubMed] [Google Scholar]
- 67.Chiang C, et al. SpeedSeq: ultra-fast personal genome analysis and interpretation. Nat Methods. 2015;12:966–8. doi: 10.1038/nmeth.3505. [DOI] [PMC free article] [PubMed] [Google Scholar]
- 68.Li H. Aligning sequence reads, clone sequences and assembly contigs with BWA-MEM. 2013 [Google Scholar]
- 69.Kent WJ, et al. The human genome browser at UCSC. Genome Res. 2002;12:996–1006. doi: 10.1101/gr.229102. [DOI] [PMC free article] [PubMed] [Google Scholar]
- 70.Consortium, R.E. et al. Integrative analysis of 111 reference human epigenomes. Nature. 2015;518:317–30. doi: 10.1038/nature14248. [DOI] [PMC free article] [PubMed] [Google Scholar]
- 71.Ben-Porath I, et al. An embryonic stem cell-like gene expression signature in poorly differentiated aggressive human tumors. Nat Genet. 2008;40:499–507. doi: 10.1038/ng.127. [DOI] [PMC free article] [PubMed] [Google Scholar]
- 72.Lawrence MS, et al. Mutational heterogeneity in cancer and the search for new cancer-associated genes. Nature. 2013;499:214–8. doi: 10.1038/nature12213. [DOI] [PMC free article] [PubMed] [Google Scholar]
Associated Data
This section collects any data citations, data availability statements, or supplementary materials included in this article.
Supplementary Materials
Data Availability Statement
All TCGA data are publicly available through NCI Genomic Data Commons (https://gdc.cancer.gov/). Cases used in this study and their telomere length estimates are provided in Supplementary Table 1.