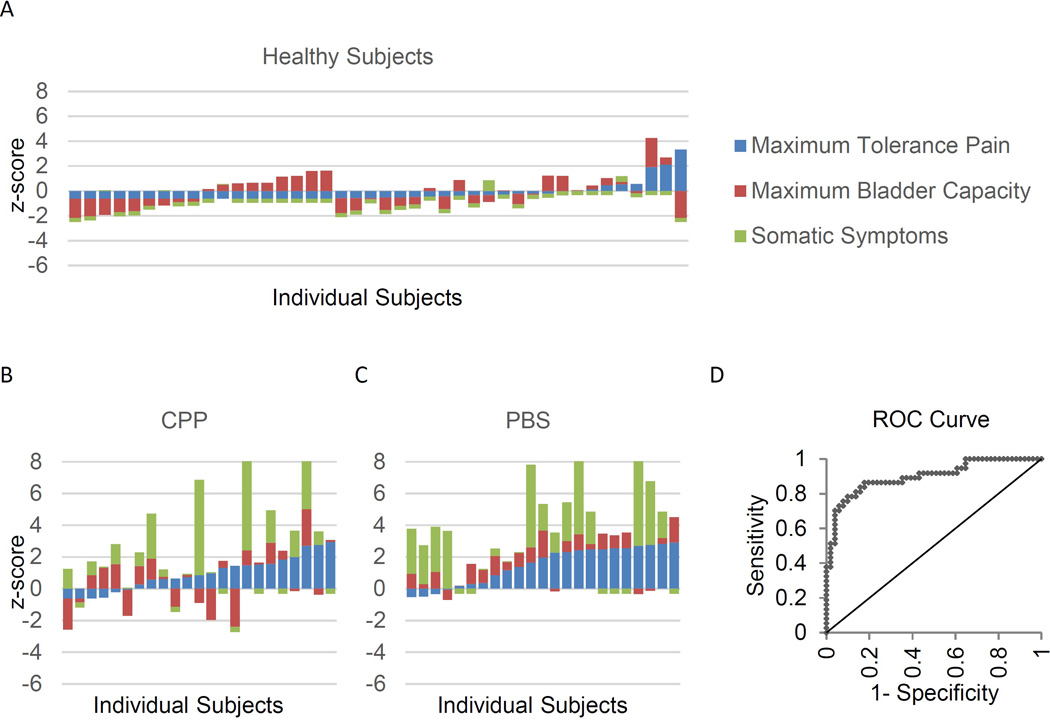
Figure 2.

Stacked bar chart of standardized relative severity of bladder pain, bladder capacity and somatic complaint, individual level data. Results scaled for estimated frequency of CPP and PBS in the general population (e.g. 0 = mean, 1 = 1 standard deviation higher than the general population). A–C: Scores of individual participants were z-scored to represent the prevalence using weighted-average scaling assuming 11% CPP only and 4% CPP with PBS.29,30 Each bar represents a single subject. The total height or depth of the bar represents the number of standard deviations above or below the population average. D: ROC curve for using these three parameters to predict an ICSI score ≥6.
