

Abstract
Purpose
We have previously demonstrated that ritonavir targeting of glycolysis is growth inhibitory and cytotoxic in a subset of multiple myeloma cells. In this study, our objective was to investigate the metabolic basis of resistance to ritonavir and to determine the utility of cotreatment with the mitochondrial complex I inhibitor metformin to target compensatory metabolism.
Experimental Design
We determined combination indices for ritonavir and metformin, impact on myeloma cell lines, patient samples, and myeloma xenograft growth. Additional evaluation in breast, melanoma, and ovarian cancer cell lines was also performed. Signaling connected to suppression of the prosurvival BCL-2 family member MCL-1 was evaluated in multiple myeloma cell lines and tumor lysates. Reliance on oxidative metabolism was determined by evaluation of oxygen consumption, and dependence on glutamine was assessed by estimation of viability upon metabolite withdrawal in the context of specific metabolic perturbations.
Results
Ritonavir-treated multiple myeloma cells exhibited increased reliance on glutamine metabolism. Ritonavir sensitized multiple myeloma cells to metformin, effectively eliciting cytotoxicity both in vitro and in an in vivo xenograft model of multiple myeloma and in breast, ovarian, and melanoma cancer cell lines. Ritonavir and metformin effectively suppressed AKT and mTORC1 phosphorylation and prosurvival BCL-2 family member MCL-1 expression in multiple myeloma cell lines in vitro and in vivo.
Conclusions
FDA-approved ritonavir and metformin effectively target multiple myeloma cell metabolism to elicit cytotoxicity in multiple myeloma. Our studies warrant further investigation into repurposing ritonavir and metformin to target the metabolic plasticity of myeloma to more broadly target myeloma heterogeneity and prevent the reemergence of chemoresistant aggressive multiple myeloma.
Introduction
Multiple myeloma is a largely incurable plasma cell malignancy accounting for 11,000 deaths annually in the United States (1, 2). Median survival remains 5 to 7 years primarily due to the development of chemoresistance, necessitating the need for new therapeutic strategies (1, 2). Targeting abnormal cancer cell metabolism could potentially provide a broader means to targeting the cellular and molecular heterogeneity of myeloma that is in part responsible for the reemergence of chemoresistant aggressive multiple myeloma. Tumor cells generate ATP, biosynthetic intermediates, and reducing equivalents by abnormally engaging biochemical pathways such as glycolysis, glutaminolysis, and the pentose phosphate pathway. To target cancer cell metabolism effectively for therapy, one must identify tumor-specific primary metabolic pathways and alternative compensatory metabolic pathways.
Multiple myeloma is one of several cancers that exhibits abnormal glucose metabolism (3). Aggressive late-stage myeloma exhibits elevated glucose uptake evident from increased PET positivity (4), which correlates with lower event-free survival (5, 6). Glucose regulates multiple biochemical, cellular and molecular pathways to maintain viability and proliferation, and induce chemoresistance in various cancers (7, 8) including multiple myeloma (3), thus supporting the utility of targeting abnormal glucose metabolism for therapy. We have demonstrated that multiple myeloma cells are glycolytic and rely on the insulin-responsive glucose transporter GLUT4, which is constitutively localized in the plasma membrane in multiple myeloma (3). Targeting this rate-limiting step in glucose metabolism by knockdown or inhibition of GLUT4 leads to apoptosis in and/or cytostasis of a subset of multiple myeloma cells. Our previous studies demonstrated the utility of targeting GLUT4 with the HIV protease inhibitor ritonavir (9–11). Ritonavir binds GLUT4 to reversibly inhibit glucose transport in a noncompetitive manner (9–11). In the current study, we sought to determine the metabolic basis for continued survival and resistance of multiple myeloma cells to ritonavir. Inhibition of glucose metabolism can lead to compensatory engagement of mitochondrial metabolism and use of alternative carbon sources to counteract the loss of glucose-derived metabolites to maintain survival. We have previously demonstrated that ritonavir in combination with complex I inhibitor metformin is cytotoxic in CLL (12). In this study, we investigate metabolic compensation in multiple myeloma cells, exploring a role for glutamine and fatty acid oxidation in maintaining survival of ritonavir-treated cells and the utility of combining ritonavir with metformin to target compensatory mitochondrial complex 1 activity in in vitro and in vivo myeloma xenograft studies with closer evaluation of dosing regimens easily translatable to humans.
Materials and Methods
Cell culture
KMS11, L363, and JJN3 cell lines were obtained from Dr. Michael Kuehl (National Cancer Institute, Bethesda, MD). We have not authenticated these cell lines in our laboratory. KMS11 cells were engineered to express GFP, hereafter referred to as KMS11-GFP cells to aid in detection in in vivo studies. Diffuse large B-cell lymphoma (DLBCL) and mantle cell lines were obtained from Dr. Leo Gordon (Northwestern University, Chicago, IL) and Dr. Varsha Gandhi (MD Anderson Cancer Center, Houston, TX) respectively. All cell lines were cultured in complete RPMI-1640 (Invitrogen) with glutamine supplemented with 10% FBS, 2 mmol/L glutamine, 100 U/mL penicillin, 100 mg/mL streptomycin, 2.5 μg/mL fungizone, 0.5 μg/mL plasmocin (InvivoGen) and maintained at 37°C with 5% CO2. NCI-60 breast, ovarian, and melanoma cell line experimentation was performed by Northwestern University Center for Developmental Therapeutics. For glucose and/or glutamine deprivation experiments, cells were cultured in glucose and glutamine-free medium (Rainbow Scientific, Inc.) supplemented with dialyzed FBS (Invitrogen) and supplemented with indicated concentrations of glucose or glutamine.
Isolation of primary myeloma cells
Approval for collection of all primary samples was obtained from the Institutional Review Board of Northwestern University. Patients provided written informed consent in all cases at time of enrollment in accordance with the Declaration of Helsinki. An AutoMacs cell sorter (Miltenyi Biotec) was used to purify CD138+ cells from multiple myeloma patient bone marrow aspirate as described previously (3). Normal peripheral blood mononuclear cells (PBMC) were harvested by layering whole blood over a Ficoll histopaque (Sigma) gradient and subject to standard buffy coat purification.
Chemicals and reagents
Ritonavir was purchased from Euroasia Inc., and metformin, dimethyl α-ketoglutarate (DMK) and 6-Diazo-5-oxo-L-norleucine from Sigma-Aldrich. The following antibodies were purchased: MCL-1 (Santa Cruz Biotechnology) and GAPDH from Millipore; pAKT (S473), AKT, pAMPK (T172), AMPK, mTORC1, and pmTORC1 from Cell Signaling Technology. Antisera to human GLUT4 was generously provided by Dr. S. Cushman (National Institute of Diabetes and Digestive and Kidney Diseases, Bethesda, MD). Oligomycin, carbonyl cyanide p-trifluoro-methoxyphenyl hydrazone, antimycin, and rotenone were purchased from Sigma.
Cell growth, proliferation, and death assays
CellTiter 96 AQueous Non-Radioactive Cell Proliferation Assay (Promega) was used to determine cell growth according to the manufacturer’s instructions. Cell proliferation and viability were quantified using a Beckman Coulter ViCell automated cell viability analyzer. Annexin V/DAPI staining was used to assess cell death via flow cytometry with a BD Biosciences LSR Fortessa Analyzer. During treatments, cells were maintained in RPMI-1640 media supplemented with 2 mmol/L glutamine, 5% dialyzed FBS, and 5 mmol/L glucose. Gentamycin was added to all media at a concentration of 50 μg/mL in keeping with the NCI60 protocol.
Oxygen consumption
Seahorse bioscience extracellular flux (XF24) analyzer was utilized to measure oxygen consumption rates (OCR). Myeloma cells subject to specific treatments were harvested, washed with PBS, and then suspended in glucose and glutamine-free DMEM (Sigma) supplemented with 1% dialyzed FBS + 5 mL penicillin/streptomycin (ph 7.5) and 5 mmol/L glucose or 2 mmol/L glutamine as required. Cells were plated in five replicates in 24-well plates custom designed for XF24 analysis at a density of 0.4× 10⁶ cells per well after precoating plates with Cell-Tak (Becton Dickinson) following the manufacturer’s recommendations. OCR was evaluated over time basally as well as after injection of oligomycin, (final concentration 5 μmol/L), carbonyl cyanide p-trifluoro-methoxyphenyl hydrazone (FCCP; final concentration 5 μmol/L), and antimycin + rotenone (final concentration of each 2 μmol/L).
Mice and drug administration
Five- to 6-week-old NOD/SCID CB17 – strain 394 (white) mice were used in this study. A total of 1 × 10⁷ KMS11-GFP cells suspended in 100 μL of RPMI-1640 and 100 μL of Matrigel were injected in the back of mice. Following tumor engraftment (one week), mice were administered ritonavir by oral gavage and/or metformin by intraperitoneal injection (i.p.). Ritonavir was dissolved in 5% ethanol: 95% propylene glycol with two molar equivalents of p-toluene sulfonic acid. p-Toluene sulfonic acid was weighed and added to the solution and stirred overnight at room temperature. Ritonavir was administered daily by oral gavage. Metformin (125 mg/kg, equivalent to a human dose of 10 mg/kg by normalization to surface area) was delivered via i.p. daily for the duration of the experiment. In combinatorial treatment regimens, the second drug was administered after one week.
Treatments were started after the average size tumor reached 125 to 250 mm3. Tumor volume was calculated using: volume (mm3) = 0.5 (W2 × L). Percent inhibition of tumor growth was calculated as follows: 1 − (mean tumor volume of vehicle-treated group mean tumor volume of ritonavir-treated group) × 100.
Immunoblot analysis
Mouse tumors were lysed in Complete Lysis-M buffer (Roche Applied Science) supplemented with phosphatase inhibitor cocktail tablets (Roche Applied Science), 1 mmol/L DTT (Sigma-Aldrich), and 0.5% NP-40 (CalBiochem) following homogenization. Cell line cytosolic lysates were prepared using the Complete Lysis-M buffer (Roche Applied Science) supplemented with phosphatase inhibitor cocktail tablets (Roche Applied Science). Immunoblotting was carried out according to standard protocols with horseradish peroxidase-linked secondary antibodies (Cell Signaling Technology).
IHC
IHC staining was performed on formalin-fixed, paraffin-embedded 4-μm sections of mouse xenograft tumors. The tissue sections were deparaffinized, and incubated in 1% hydrogen peroxidase for 10 minutes to quench endogenous tissue peroxidase. Antigen retrieval was carried out in citric buffer in microwave (high power) for 10 minutes. The tissue sections were then incubated with the anti-Glut1 or anti-Glut4 antibody overnight at +4°C. The slides were stained using a standard EnVision + ystem-HRP kit (DAKO) according to the manufacture’s protocol. IHC reactions were developed with diamino-benzidine as the chromogenic peroxidase substrate, and slides were counter-stained with hematoxylin. Images were taken using an Olympus BX40 microscope.
Results
Multiple myeloma cells resistant to ritonavir rely on glutamine metabolism
To start to investigate basis for resistance to ritonavir in multiple myeloma cells, we first determined the impact of ritonavir alone on a panel of multiple myeloma cell lines. Multiple myeloma cells treated with ritonavir for 72 hours exhibit varying levels of cell death as evaluated by Annexin V/DAPI staining (Fig. 1A). To examine the basis for resistance to ritonavir in multiple myeloma, we explored the ability of cells to utilize alternative substrates and oxidative phosphorylation (OXPHOS). Because myeloma cells are known to be highly reliant on glutamine (13), we tested the impact of glutamine withdrawal in the context of glucose deprivation on multiple myeloma cell viability. Indeed, removal of both glucose and glutamine elicited significant apoptosis in a panel of multiple myeloma cell lines (Fig. 1B). To further confirm reliance on glutamine in ritonavir-treated cells, the KMS11 multiple myeloma cell line was treated with ritonavir in the absence of glutamine with or without the addition of cell permeant DMK. DMK rescued ritonavir-treated glutamine-deprived KMS11 cells (Fig. 1C). Evaluation of the contribution of fatty acid oxidation by treatment with etomoxir indicated minimal contribution to maintaining cellular viability of ritonavir-treated KMS11 cells (data not shown).
Figure 1.
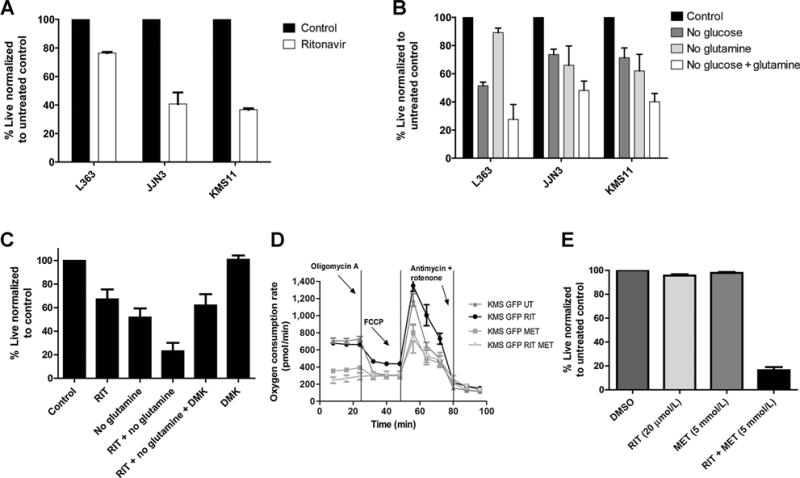
A and B, ritonavir-treated multiple myeloma cells increase reliance on glutamine metabolism that is targeted with metformin. Impact of ritonavir on multiple myeloma cell viability: A, L363, JJN3, and KMS11 cell lines were cultured in the presence or absence of ritonavir (RIT) (40 μmol/L) for 72 hours or (B) in the absence of glucose (5 mmol/L)/glutamine (2 mmol/L) or both as indicated for 48 hours and viability assessed by Annexin V–DAPI staining and flow cytometry. C, glutamine deprived ritonavir-treated KMS11 cells are rescued by cell permeant DMK: KMS11 cells were cultured in presence or absence of glucose (5 mmol/L), ritonavir (40 μmol/L), glutamine (2 mmol/L), or DMK-1.25 mmol/L as indicated for 48 hours. Cell viability was assessed by Annexin V/DAPI staining. Data are mean ± SEM (n = 3). D, KMS11-GFP cells maintain oxygen consumption upon ritonavir treatment that can be targeted by cotreatment with metformin (MET). KMS11-GFP cells were treated with 20 μmol/L ritonavir and/or 5 mmol/L metformin for 17 hours following which OCR was evaluated in equal numbers of viable cells using a seahorse bioenergetics bioanalzyer. Specific perturbations, that is, oligomycin, FCCP, and antimycin/rotenone were injected and OCR measured over time. One of the three representative experiments is shown that was derived from an average of 5 wells per treatment condition ± SEM. E, KMS11-GFP cells exhibit significant apoptosis upon cotreatment with ritonavir and metformin. KMS11-GFP cells were treated with 20 μmol/L ritonavir and/or 5 mmol/L metformin for 72 hours and viability assessed by Annexin V/DAPI staining. Data are mean ± SEM (n = 3).
Oxygen consumption is maintained in ritonavir-treated KMS11-GFP cells and can be targeted with complex I inhibitor metformin
Although our results suggest a role for glutamine in sustaining multiple myeloma cell viability, there are additional mitochondrial metabolites that can sustain OXPHOS. We therefore rationalized that treatment with a complex 1 inhibitor would block any resistance-promoting OXPHOS. To this end, we first evaluated oxygen consumption in KMS11-GFP cells treated with ritonavir with or without metformin (that is known to target complex 1; refs. 14–16) using a seahorse bioenergetics analyzer. Cells treated for 17 hours with ritonavir, metformin, or the combination were evaluated for OCR at baseline and following the addition of oligomycin A, to determine the amount of oxygen consumption coupled to ATP synthesis; FCCP, to determine maximal respiratory capacity; and finally, antimycin and rotenone to determine the spare respiratory capacity (Fig. 1D). Our results demonstrate that OCR is indeed maintained in KMS11-GFP cells upon treatment with ritonavir (Fig. 1D). The combination of ritonavir with metformin, however, completely suppressed OCR in the KMS11-GFP cells. In addition, evaluation of viability demonstrated that ritonavir in combination with metformin elicits significant apoptosis in KSM11-GFP cells (Fig. 1E).
Ritonavir in combination with metformin synergistically elicits apoptosis in multiple myeloma cell lines and patient samples
We next investigated the efficacy of ritonavir and metformin in a panel of multiple myeloma cell lines, myeloma patient samples (CD138-positive plasma cells isolated from patient bone marrow aspirates), and normal PBMCs. Following treatment with the compounds alone or in combination for 72 hours in cell lines and PBMC and for the indicated time periods in patient samples, we assessed viability by the MTS assay or Annexin V/DAPI staining. The combination of ritonavir with metformin elicited significant reduction in multiple myeloma cell lines and patient sample viability in contrast with normal PBMC (Fig. 2). Estimation of combination indices (CI values) by the method of Chou (17) by evaluation of Annexin V/DAPI staining in three multiple myeloma cell lines treated with ritonavir or metformin or the combination for 72 hours demonstrated that ritonavir synergizes with metformin to elicit cytotoxicity in multiple myeloma with CI values in the range of 0.3 to 0.6 at ED50 (Fig. 2, Table 1).
Figure 2.
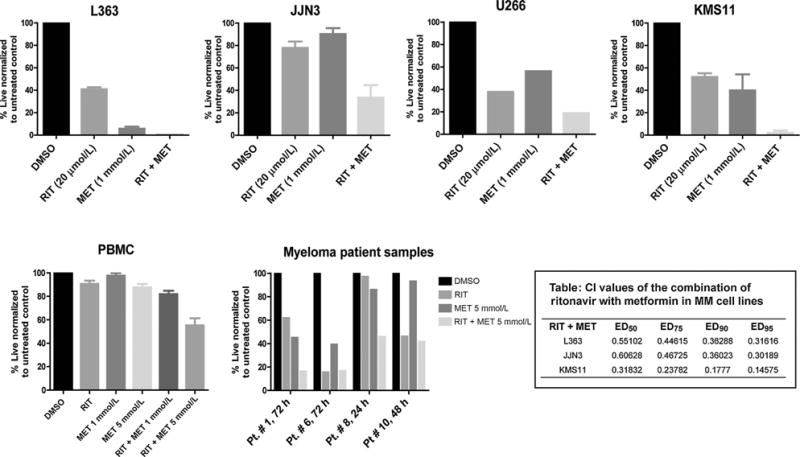
Myeloma cell lines and patient samples exhibit significant apoptosis upon cotreatment with ritonavir and metformin. Indicated multiple myeloma (MM) cell lines were treated for 72 hours with 20 μmol/L ritonavir and/or 1 mmol/L metformin and the impact on cell proliferation determined by MTS assay. Data are mean ± SEM (n = 3). PBMCs were treated for 72 hours with 20 μmol/L ritonavir and 1 and/or 5 mmol/L metformin and the impact on cell viability was evaluated by Annexin V/DAPI staining. Data are mean ± SEM (n = 5) Myeloma patient samples were treated with 20 μmol/L ritonavir and 5 mmol/L metformin for the indicated periods and impact on cell viability determined by Annexin V/DAPI staining. Table, the CI values at ED50, ED75, ED90, and ED95 indicate a synergistic interaction between ritonavir and metformin in L363, JJN3, and KMS11 cell lines. CI calculation of drug combination was based on the IC50s for inducing apoptosis evaluated by Annexin V/DAPI staining, that is, 45 μmol/L for ritonavir and 10 mmol/L for metformin. CompuSyn Version 1 was used to calculate the CI value that measures the degree of interaction between two or more drugs, where a CI < 1 indicates synergism.
Ritonavir and metformin combination therapy is effective in an in vivo xenograft model of multiple myeloma
To investigate the efficacy of combinatorial treatment in vivo, we generated KMS11-GFP–expressing xenograft tumors. KMS11-GFP cells were inoculated on the backs of mice to generate myeloma xenografts. Following detection of palpable tumors, animals were administered one of the following treatments: (i) metformin vehicle; (ii) ritonavir vehicle; (iii) ritonavir (50 mg/kg); (iv) metformin (125 mg/kg); (v) ritonavir (50 mg/kg) for one week followed by cotreatment with metformin (125 mg/kg); or (vi) metformin (125 mg/kg) for one week followed by cotreatment with ritonavir (50 mg/kg). These doses were chosen to approximate physiologically achievable dosing. A ritonavir dose of 100 mg/kg leads to a Cmax of 33 μmol/L in mice; however, humans administered ritonavir exhibit a Cmax of 15 μmol/L (18). We therefore chose a dose of 50 mg/kg. Average tumor volumes over time and fold change in tumor growth for the KMS11-GFP tumors are plotted in Fig. 3A and B, respectively. Vehicle-treated KMS11-GFP tumors continued to grow and reached 2,500 mm3 average volume at day 14. Consistent with the previous in vitro findings, KMS11-GFP tumors regressed from 2,500 mm3 to 1,500 mm3 after ritonavir treatment (Fig. 3A–C). It has been shown that metformin decreases tumor burden by targeting complex 1 activity (14). Surprisingly, metformin-treated KMS11-GFP tumors remained smaller than vehicle-treated animals until day 14 but grew exponentially after day 14 (Fig. 3A). Consistent with our in vitro findings, tumors regressed significantly in animals that received the combination therapy. Interestingly, tumor regression in mice treated with the combination therapy was greater in mice given metformin first before the addition of ritonavir (Fig. 3A).
Figure 3.
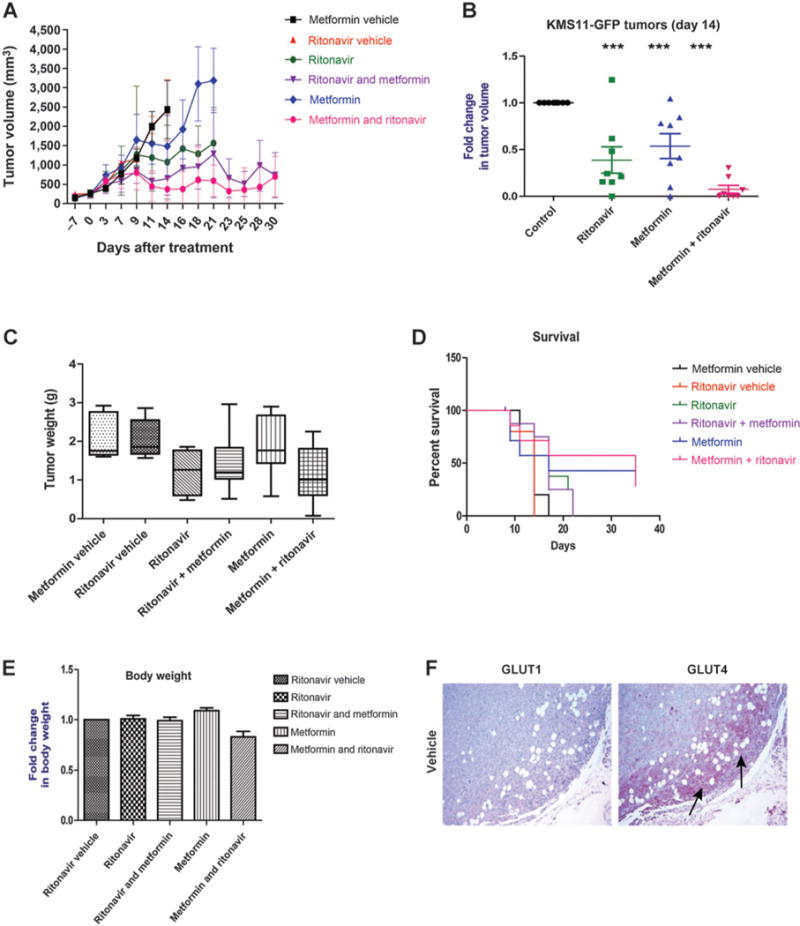
KMS11-GFP tumors regress postcombinatorial therapy with ritonavir and metformin in vivo. KMS11-GFPs were injected into the backs of BNX-SCID mice. Once palpable tumors (125–250 mm3) were detected, mice were administered respective vehicles, ritonavir (50 mg/kg), metformin (125 mg/kg), or the combination. Combination treatments were started by administering one drug first for one week followed by the addition of the other. Injection of tumor cells and initiation of treatment were on day “−7” and day “0,” respectively. A, mean of KMS11-GFP tumor volumes at indicated days posttreatment. B, fold change in tumor volume was calculated by normalizing mean tumor volume at day 14 posttreatment to mean tumor volume of vehicle treated mice on day 14. C, mean tumor weights at the time of sacrifice. D, percent survival of mice after each treatment. E, fold change in body weight of mice after respective treatments. Asterisks indicate that the difference is significant;***, P value ≤ 0.05, 0.01, and 0.001, respectively. NS depicts that the difference between groups shown is not significant. F, GLUT4 is evident along the invasion front of the tumor is removed upon cotreatment with metformin and ritonavir. Immunodetection of GLUT1 and GLUT4 in a representative vehicle-treated KMS11-GFP tumor. Staining performed as described in Materials and Methods and representative images are shown. GLUT1 expression throughout tumor or GLUT4 expression at the leading edge of the tumor (indicated by arrows) is evident.
We also analyzed the effects of the combinatorial therapy on tumor weight (Fig. 3C). Tumor weights were reduced after ritonavir and the combination treatments (Fig. 3C), with the pretreated metformin + ritonavir group demonstrating the largest reduction in tumor weight. Body weights of the animals were not significantly decreased after combination therapy (Fig. 3E) in comparison with the vehicle-treated animals, suggesting that this dosing regimen is well tolerated and does not impact whole body glucose homeostasis significantly. Next, we sought to compare the survival of mice following treatments (Fig. 3D). Consistent with the efficacy of the treatments, none of the vehicle-treated mice survived after day 14, whereas 50% or more ritonavir- or metformin-treated animals survived longer (day 21 Consistent with the finding that tumors regressed after combination therapy, greater than 50% of mice that received this combination were surviving through the end of the study 35 days posttreatment; Fig. 3E), providing evidence that combination therapy improves survival of multiple myeloma xenograft-bearing mice.
GLUT4 exhibits increased expression at the leading invasion front
IHC evaluation of GLUT1 and GLUT4 in xenograft tumors demonstrates for the first time GLUT4 at the leading invasion front of tumors while GLUT1 was more homogenously distributed (Fig. 3F) further supporting the utility of targeting GLUT4 in multiple myeloma.
Combination therapy reduces pAKT, pAMPK, pmTORC1, and MCL-1 expression in vitro in cell lines and in a mouse xenograft model of multiple myeloma
To begin to evaluate the mechanistic basis for efficacy of ritonavir and metformin, we interrogated multiple myeloma cell lines and cytosolic tumor lysates for protein expression of specific effectors known to regulate metabolism and or cell survival. Prosurvival BCL-2 family member MCL-1 is regulated by glucose (3, 19) via the AKT/mTORC1 axis (19). Examination of AKT and mTORC1 phosphorylation both in vitro in cell lines and in tumor lysates exhibited suppression upon cotreatment with ritonavir and metformin correlating with suppression of MCL-1 expression (Fig. 4A–C). Ritonavir and metformin did not impact MCL-1 mRNA levels (data not shown; estimation performed at the 72 hours time point). We also interrogated MCL-1 stability as a mode of regulation by the ritonavir metformin combination. Cotreatment with proteosome inhibitor bortezomib or MG-132 and inhibition of GSK-3β (that is involved in regulating MCL-1 stability) did not reverse the suppression of MCL-1 detected upon cotreatment with ritonavir and metformin (data not shown). Given the central role of AKT in promoting glycolysis (20) and of AMPK in promoting oxidative metabolism (21), we hypothesized that AMPK may be maintained in ritonavir-treated cells consistent with their ability to maintain OXPHOS upon ritonavir treatment. Indeed, treatment with ritonavir maintained pAMPK expression levels in tumors (4/5 animals, Fig. 4C). We importantly note that cotreatment led to significant suppression of pAMPK and pAKT both in vitro in cell lines and in 5 of 5 animals (Fig. 4A and C), correlating with significant reduction in tumor burden that we detected with this treatment regimen. Treatment with metformin alone led to slight increases in total AMPK and reduction in pAKT levels across the animals tested; however, it is the combination of metformin and ritonavir that effectively reduces both pAMPK and pAKT levels, further supporting the growth inhibitory and apoptosis inducing effects of this combinatorial regimen.
Figure 4.
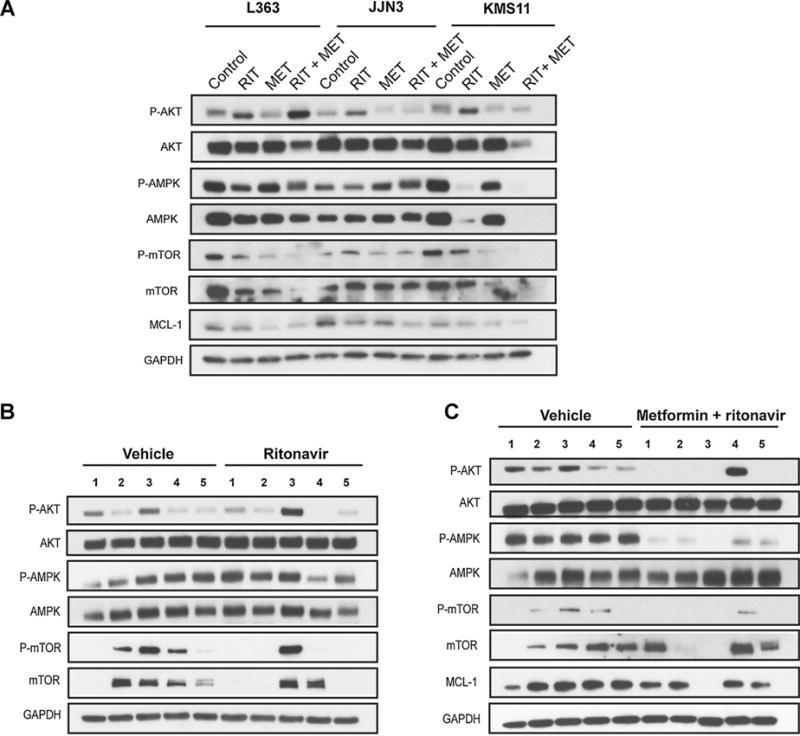
Combination of ritonavir and metformin effectively reduces MCL-1 expression and AMPK and AKT phosphorylation in multiple myeloma. A, L363, JJN3, and KMS11 cell lines were treated with ritonavir (40 μmol/L) or metformin (5 mmol/L) or both for 72 hours. Protein lysates were analyzed for the expression of indicated proteins or GAPDH (loading control) by immunoblot analyses. B and C, combined administration of ritonavir and metformin effectively reduces MCL-1 expression and AMPK and AKT phosphorylation in multiple myeloma xenograft in vivo. Cytosolic lysates of KMS11-GFP tumors were evaluated for the indicated proteins by immunoblot analysis. Data from 4 or 5 tumors from representative mice are shown.
Ritonavir and metformin combination therapy is growth inhibitory in other hematologic malignancies and solid tumors
We have previously demonstrated the efficacy of ritonavir and metformin cotreatment in CLL (12) and hypothesized that this combination would be efficacious in other cancers. To understand whether the combinatorial treatment is effective in other hematologic malignancies, we investigated the effects of the combinatorial therapy in cell lines derived from DLBCL and mantle cell lymphomas (Fig. 5A and B). Similar to our findings in multiple myeloma cell lines, the growth of these cell lines was reduced in a dose-dependent manner upon coadministration of ritonavir and metformin. We additionally, evaluated the effects of the combination therapy in solid tumors using cell lines derived from melanomas (Fig. 6) as well as breast and ovarian cancers (Supplementary Fig. S1). The combinatorial regimen was growth inhibitory in all melanoma cell lines and a majority of the breast and ovarian cancer lines.
Figure 5.
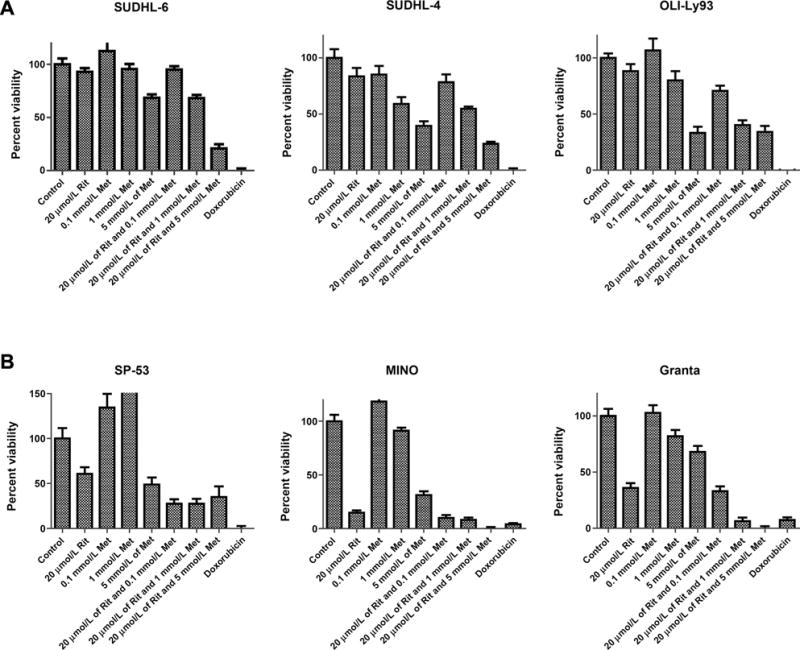
Combination of ritonavir and metformin is growth inhibitory in other hematologic malignancies. Cells derived from DLBCL (A) and mantle cell lymphomas (B) were cultured in the presence of 20 μmol/L ritonavir, increasing concentrations of metformin, or the combination for 72 hours. Impact of treatments on cell proliferation was evaluated by MTS assay. Doxorubicin (10 μmol/L) was used as a positive control.
Figure 6.
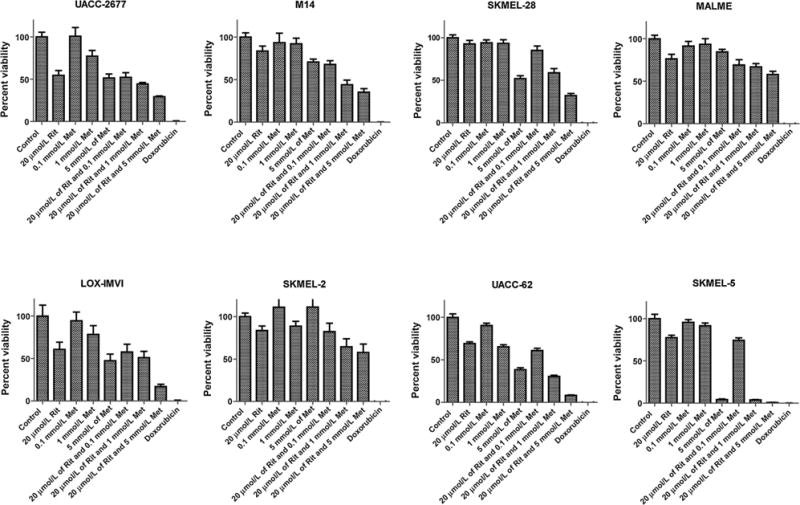
Combination of ritonavir and metformin is growth inhibitory in melanoma. Melanoma cancer cell lines were cultured in the presence of 20 μmol/L ritonavir, and/or increasing concentrations of metformin for 72 hours. Impact of treatments on cell proliferation was evaluated by an MTS assay. Doxorubicin (10 μmol/L) was used as a positive control.
Discussion
In the early 1900s, Otto Warburg made the seminal discovery that tumor cells engage aerobic glycolysis even under normoxia (22). More recent studies have demonstrated the utilization of aerobic glycolysis by tumor cells despite the presence of functional mitochondria, suggesting inherent survival and/or proliferation benefits for tumor cells engaging this mode of glucose metabolism (23). Although numerous studies provide significant rationale to target glycolysis for cancer therapy, the caveat remains in the identification of tumor-specific targets and a need for increased understanding of the compensatory metabolic circuitry that tumor cells engage to circumvent perturbations in any given metabolic pathway.
We have previously determined that treatment of myeloma cell lines and patient samples with physiologically achievable doses of the GLUT4 inhibitor ritonavir exerts glucose transport-specific antimyeloma effects (3). The selectivity of ritonavir for GLUT4 has been proven in vitro (9–11) and in vivo by the evaluation of ritonavir’s impact on glucose tolerance in GLUT4 knockout mice (10). In fact, it is the selective inhibition of GLUT4 that is responsible for the ensuing insulin resistance and dyslipidemia observed upon chronic administration of ritonavir (24). Although the specificity for GLUT4 (in contrast with GLUTs1, 2, 3, 4, and 8) exhibited by this class of drugs (9) and greater potency of ritonavir versus indinavir (another GLUT4 inhibitor; ref. 9) has been established in other cell types, we cannot rule out minimal effects on other transporters within multiple myeloma cells. Although ritonavir has also been described to inhibit STAT3 and ERK1/2 in multiple myeloma (25), our previous study established that inhibition of glucose uptake and glycolysis is required to elicit the growth-inhibitory effects of ritonavir (3). In the current study, we investigated the metabolic basis for resistance to ritonavir and found ritonavir-treated or glucose-deprived cells to maintain survival associated with increased reliance on mitochondrial OXPHOS.
Our results demonstrating increased apoptosis in ritonavir-treated KMS11 cells that are glutamine deprived suggest a role for compensatory glutamine metabolism. More importantly, the rescue of ritonavir-treated and glutamine-deprived KMS11 cells with cell permeant α-ketoglutarate suggests a role for glutaminolysis in maintaining survival of ritonavir-treated multiple myeloma. Increased engagement of OXPHOS in KMS11 is further supported by the observation that ritonavir-treated cells maintain OCR and exhibit increased sensitivity to the mitochondrial complex I inhibitor metformin. Although one cannot rule out the contribution of fatty acid oxidation in maintaining multiple myeloma survival upon ritonavir treatment, our results demonstrate efficacy of the combination of ritonavir and metformin in four multiple myeloma cell lines exhibiting disparate genetic backgrounds. These results collectively underscore the utility of this strategy to target both glycolysis and resistance promoting OXPHOS to elicit cytotoxicity in the broader spectrum of multiple myeloma cell types.
Metformin is an FDA-approved antidiabetic drug that has anticancer chemosensitizing properties now proven in various in vitro and preclinical in vivo studies (14, 26). Several epidemiologic studies have also correlated metformin treatment with reduced risk of cancer in diabetics (27, 28) and in cancer patients (29). Metformin is a mitochondrial complex 1 inhibitor that can be used to target OXPHOS (14–16). In addition, metformin impacts whole body glucose homeostasis by regulation of glucose production and insulin secretion (30) that can prove to be beneficial in regulating elevated levels of circulating glucose that may result from ritonavir treatment.
Evaluation of cell lines and tumor lysates importantly demonstrated that cotreatment of multiple myeloma with ritonavir and metformin led to suppression of the AKT and mTORC1 pathways known to regulate synthesis of MCL-1 (19). MCL-1 is particularly important in the development of resistance, as the inability to decrease MCL-1 expression correlates to resistance to bortezomib (31), rapamycin (32), cyclin-dependent kinase inhibitors (33), and the BCL-2/BCL-XL/BCL-w selective antagonist ABT 737 (34) in multiple myeloma and various cancers. Importantly, higher MCL-1 expression levels correlate with lower event-free survival in multiple myeloma (35), underscoring the need for effective strategies to target MCL-1. We and others have demonstrated a link between glucose and maintenance of MCL-1 (3, 19, 36). Therefore, there is reason to believe that suppression of MCL-1 seen in four of the five tumors in ritonavir-treated mice may be linked to suppression of glucose uptake and responsible for the ensuing reduction in tumor burden. In targeting metabolism, one would anticipate changes in the activity of AMPK, which like AKT has a prosurvival role in multiple myeloma (37, 38). Regulation of AMPK was inconsistent between cell lines and tumor lysates that could be due to effects of the drugs in the context of the in vivo microenvironment. What is particularly interesting is the maintenance of pAMPK in ritonavir-treated KMS11 tumor xenografts. In normal cells, AMPK is known to be activated under conditions of cellular stress such as upon glucose withdrawal to promote catabolic ATP synthesis, and mitochondrial biogenesis associated with activation of SIRT1 and PGC1α promoting increased oxidative metabolism (39). The maintenance of pAMPK in ritonavir only-treated mice may contribute to the resistance of the multiple myeloma xenograft tumors in vivo to ritonavir therapy alone, which is targeted upon cotreatment with metformin.
There are several models of multiple myeloma but none quite exactly recapitulate the in vivo bone marrow engagement and progression of multiple myeloma. The subcutaneous xenograft model of multiple myeloma has previously been used to test drugs such as bortezomib (40) and thus this model is able to provide an idea of the efficacy of this regimen in vivo. Our examination of GLUT4 localization in the tumors demonstrates for the first time expression of GLUT4 at the invasion front. GLUT4 could thus potentially be involved in promoting a highly active metabolic phenotype at the invasion front to promote dissemination promoting development of multiple myeloma skeletal lesions. Therefore, it will be important to test the impact of ritonavir and metformin on dissemination and bone engagement in a tail vein disseminated model of myeloma (41) or in the spontaneous Vk*MYC genetically engineered mouse model of myeloma (42).
Among the multiple myeloma cell lines tested in our study, JJN3 cells exhibit the t(14;16) translocation associated with deregulation of cMAF, U266 cells express mutant BRAF and the t(11;14) translocation associated with deregulation of cyclin D1, L363 cells express mutant NRAS and the t(14;16) translocation, whereas KMS11 cells express the t(4;14) and t(14;16) translocations associated with deregulation of FGFR3 and cMAF (43, 44). Multiple myeloma is thus characterized by variety of genetic abnormalities in addition to exhibiting clonal heterogeneity within a given tumor. Any given patient thus requires therapy targeting diverse translocations and mutations to circumvent selection of aggressive clonal subpopulations (45). For example, in patients with multiple myeloma expressing BRAF mutations, we have learnt that although BRAF inhibitors effectively inhibit MAPK in the multiple myeloma cells expressing activating BRAF mutations, cells within the same patient expressing WT BRAF or KRAS increased activation of MAPK, essentially selecting for these subpopulations (45). Our data suggest that targeting abnormal cellular metabolism can circumvent the selective pressures associated with targeting individual upstream drivers of pathways that promote proliferation and survival by targeting the metabolism sustaining diverse genetic backgrounds. The reliance of multiple myeloma cells on GLUT4 that is targeted with ritonavir that then elicits sensitivity to metformin allows for the selectivity of this strategy toward tumor cells.
The chronic use of ritonavir as part of a combinatorial antiretroviral treatment regimen for HIV despite its GLUT4-inhibitory effects is proof of principle that humans can tolerate drugs that target GLUT4 (46). In the aforementioned HIV study, patients on 600 mg ritonavir twice a day were additionally dosed at 1,500 mg/day with metformin to treat diabetic symptoms (46). This treatment combination was thus found to be well tolerated in humans (46). Metformin is normally dosed at 500 mg twice daily (47) and ritonavir is administered at 600 mg twice daily (18). The dosing of metformin and ritonavir that we utilized in our in vivo mouse study is comparable with clinically achievable doses in humans, thus can potentially be evaluated in humans for cancer therapy. Our rationale for treating with metformin before ritonavir was to approximate how the drugs would be administered in humans. This in fact turned out to be fortuitous as it appears like this dosing pattern may have better efficacy. We are unclear as to the mechanism but this order of administration may lead to better control of glucose homeostasis and circulating insulin levels in vivo.
Our studies also demonstrate the utility of combining metformin with ritonavir in a wide range of malignancies, that is, mantle cell lymphoma, DLBCL melanoma, ovarian, breast cancer and just recently our group reported efficacy in CLL (12). These observations, in addition to our findings, warrant further preclinical investigation into repurposing ritonavir and metformin for short-term combinatorial and/or chemo-sensitization regimens for the treatment of GLUT4-dependent tumors such as multiple myeloma. Our study also conceptually bolsters closer investigation into the development of agents that target GLUT4 in combination with agents that target compensatory mitochondrial activity for cancer therapy.
Supplementary Material
Translational Relevance.
Multiple myeloma (MM) is a largely incurable plasma cell malignancy primarily due to the development of resistance and confounded by underlying clonal molecular heterogeneity. We have previously demonstrated the therapeutic utility of targeting abnormal glucose metabolism and multiple myeloma growth and/or survival with the GLUT4 inhibitor ritonavir. Our recent studies have determined that a subset of myeloma cells survive glucose deprivation/ritonavir treatment likely by engagement of mitochondrial oxidative phosphorylation. We therefore tested combined use of ritonavir with the antidiabetic metformin, which targets mitochondrial complex 1. Administration of FDA-approved ritonavir with metformin effectively elicited apoptosis in vitro in multiple myeloma cell lines and patient samples and reduced tumor burden in an in vivo xenograft model of multiple myeloma. In addition, this combinatorial regimen was effective in breast, melanoma, and ovarian cancer cell lines. Importantly, diabetic HIV patients have previously been administered this combinatorial regimen, supporting the investigation of repurposing ritonavir and metformin for multiple myeloma therapy.
Acknowledgments
The authors thank Dr. Anthea Hammond for editing the article and Natalie Pulliam for assistance with purification of primary myeloma cells. The authors also acknowledge flow-cytometry services provided by the Robert H. Lurie Comprehensive Cancer Center Flow Cytometry Core Facility, which was funded by the NCI CCSG P30 CA060553 core grant.
Grant Support
This work was supported by Robert H.L.C.C center gift fund (to S.T. Rosen), Wendy Will Case Cancer Foundation grant SP0012544 (to M. Shanmugam), American Cancer Society (IL division grant #188679; to M. Shanmugam), and the American Cancer Society (Research scholar grant RSG-11-254-01-CSM; to M. Shanmugam). All animal studies were performed by Dr. Irawati Kandela and IHC staining by Andrey Ugolkov at the Northwestern University Center for Developmental Therapeutics core funded by the Robert H. Lurie Cancer Center, generously supported by NCI CCSG P30 CA060553 core grant.
Footnotes
Note: Supplementary data for this article are available at Clinical Cancer Research Online (http://clincancerres.aacrjournals.org/).
Disclosure of Potential Conflicts of Interest
No potential conflicts of interest were disclosed.
Authors’ Contributions
Conception and design: S. Dalva-Aydemir, M. Shanmugam
Development of methodology: S. Dalva-Aydemir, I.K. Kandela, N.S. Raje, M. Shanmugam
Acquisition of data (provided animals, acquired and managed patients, provided facilities, etc.): K.U.A. Adekola, I.K. Kandela, S. Singhal, M. Shanmugam Analysis and interpretation of data (e.g., statistical analysis, biostatistics, computational analysis): S. Dalva-Aydemir, R. Bajpai, M. Martinez, K.U.A. Adekola, I.K. Kandela, C. Wei, M. Shanmugam
Writing, review, and/or revision of the manuscript: K.U.A. Adekola, J.E. Koblinski, N.S. Raje, S.T. Rosen, M. Shanmugam
Administrative, technical, or material support (i.e., reporting or organizing data, constructing databases): M. Martinez, M. Shanmugam
Study supervision: M. Shanmugam
Other (Western blotting experiments with tumor lysates and cell lines): R. Bajpai
Other (bench research): S. Dalva-Aydemir, R Bajpai, C. Wei, M. Martinez, K.U.A. Adekola, C. Wei, M. Shanmugam
References
- 1.Richardson PG, Schlossman R, Hideshima T, Anderson KC. New treatments for multiple myeloma. Oncology. 2005;19:1781–92. [PubMed] [Google Scholar]
- 2.Munshi N. Plasma cell disorders: an historical perspective. Hematology. 2008;2008:297. doi: 10.1182/asheducation-2008.1.297. [DOI] [PubMed] [Google Scholar]
- 3.McBrayer SK, Cheng JC, Singhal S, Krett NL, Rosen ST, Shanmugam M. Multiple myeloma exhibits novel dependence on GLUT4, GLUT8, and GLUT11: implications for glucose transporter-directed therapy. Blood. 2012;119:4686–97. doi: 10.1182/blood-2011-09-377846. [DOI] [PMC free article] [PubMed] [Google Scholar]
- 4.Bredella MA, Steinbach L, Caputo G, Segall G, Hawkins R. Value of FDG PET in the assessment of patients with multiple myeloma. AJR Am J Roentgenol. 2005;184:1199–204. doi: 10.2214/ajr.184.4.01841199. [DOI] [PubMed] [Google Scholar]
- 5.Zamagni E, Patriarca F, Nanni C, Zannetti B, Englaro E, Pezzi A, et al. Prognostic relevance of 18-F FDG PET/CT in newly diagnosed multiple myeloma patients treated with up-front autologous transplantation. Blood. 2011;118:5989–95. doi: 10.1182/blood-2011-06-361386. [DOI] [PubMed] [Google Scholar]
- 6.Bartel TB, Haessler J, Brown TL, Shaughnessy JD, Jr, van Rhee F, Anaissie E, et al. F18-fluorodeoxyglucose positron emission tomography in the context of other imaging techniques and prognostic factors in multiple myeloma. Blood. 2009;114:2068–76. doi: 10.1182/blood-2009-03-213280. [DOI] [PMC free article] [PubMed] [Google Scholar]
- 7.Vander Heiden MG, Plas DR, Rathmell JC, Fox CJ, Harris MH, Thompson CB. Growth factors can influence cell growth and survival through effects on glucose metabolism. Mol Cell Biol. 2001;21:5899–912. doi: 10.1128/MCB.21.17.5899-5912.2001. [DOI] [PMC free article] [PubMed] [Google Scholar]
- 8.Xu RH, Pelicano H, Zhou Y, Carew JS, Feng L, Bhalla KN, et al. Inhibition of glycolysis in cancer cells: a novel strategy to overcome drug resistance associated with mitochondrial respiratory defect and hypoxia. Cancer Res. 2005;65:613–21. [PubMed] [Google Scholar]
- 9.Murata H, Hruz PW, Mueckler M. The mechanism of insulin resistance caused by HIV protease inhibitor therapy. J Biol Chem. 2000;275:20251–4. doi: 10.1074/jbc.C000228200. [DOI] [PubMed] [Google Scholar]
- 10.Vyas AK, Koster JC, Tzekov A, Hruz PW. Effects of the HIV protease inhibitor ritonavir on GLUT4 knock-out mice. J Biol Chem. 2010;285:36395–400. doi: 10.1074/jbc.M110.176321. [DOI] [PMC free article] [PubMed] [Google Scholar]
- 11.Hertel J, Struthers H, Horj CB, Hruz PW. A structural basis for the acute effects of HIV protease inhibitors on GLUT4 intrinsic activity. J Biol Chem. 2004;279:55147–52. doi: 10.1074/jbc.M410826200. [DOI] [PMC free article] [PubMed] [Google Scholar]
- 12.Adekola KU, Dalva Aydemir S, Ma S, Zhou Z, Rosen ST, Shanmugam M. Investigating and targeting chronic lymphocytic leukemia metabolism with the human immunodeficiency virus protease inhibitor ritonavir and metformin. Leuk Lymphoma. 2014:1–10. doi: 10.3109/10428194.2014.922180. [DOI] [PMC free article] [PubMed] [Google Scholar]
- 13.Roberts RS, Hsu HW, Lin KD, Yang TJ. Amino acid metabolism of myeloma cells in culture. J Cell Sci. 1976;21:609–15. doi: 10.1242/jcs.21.3.609. [DOI] [PubMed] [Google Scholar]
- 14.Cheong JH, Park ES, Liang J, Dennison JB, Tsavachidou D, Nguyen-Charles C, et al. Dual inhibition of tumor energy pathway by 2-deoxyglucose and metformin is effective against a broad spectrum of preclinical cancer models. Mol Cancer Ther. 2011;10:2350–62. doi: 10.1158/1535-7163.MCT-11-0497. [DOI] [PMC free article] [PubMed] [Google Scholar]
- 15.Owen MR, Doran E, Halestrap AP. Evidence that metformin exerts its antidiabetic effects through inhibition of complex 1 of the mitochondrial respiratory chain. Biochem J. 2000;348(Pt 3):607–14. [PMC free article] [PubMed] [Google Scholar]
- 16.El-Mir MY, Nogueira V, Fontaine E, Averet N, Rigoulet M, Leverve X. Dimethylbiguanide inhibits cell respiration via an indirect effect targeted on the respiratory chain complex I. J Biol Chem. 2000;275:223–8. doi: 10.1074/jbc.275.1.223. [DOI] [PubMed] [Google Scholar]
- 17.Chou TC. Theoretical basis, experimental design, and computerized simulation of synergism and antagonism in drug combination studies. Pharmacol Rev. 2006;58:621–81. doi: 10.1124/pr.58.3.10. [DOI] [PubMed] [Google Scholar]
- 18.Gatti G, Di Biagio A, Casazza R, De Pascalis C, Bassetti M, Cruciani M, et al. The relationship between ritonavir plasma levels and side-effects: implications for therapeutic drug monitoring. AIDS. 1999;13:2083–9. doi: 10.1097/00002030-199910220-00011. [DOI] [PubMed] [Google Scholar]
- 19.Coloff JL, Macintyre AN, Nichols AG, Liu T, Gallo CA, Plas DR, et al. Akt-dependent glucose metabolism promotes Mcl-1 synthesis to maintain cell survival and resistance to Bcl-2 inhibition. Cancer Res. 2011;71:5204–13. doi: 10.1158/0008-5472.CAN-10-4531. [DOI] [PMC free article] [PubMed] [Google Scholar]
- 20.Elstrom RL, Bauer DE, Buzzai M, Karnauskas R, Harris MH, Plas DR, et al. Akt stimulates aerobic glycolysis in cancer cells. Cancer Res. 2004;64:3892–9. doi: 10.1158/0008-5472.CAN-03-2904. [DOI] [PubMed] [Google Scholar]
- 21.Jager S, Handschin C, St-Pierre J, Spiegelman BM. AMP-activated protein kinase (AMPK) action in skeletal muscle via direct phosphorylation of PGC-1alpha. Proc Natl Acad Sci U S A. 2007;104:12017–22. doi: 10.1073/pnas.0705070104. [DOI] [PMC free article] [PubMed] [Google Scholar]
- 22.Warburg O. On the origin of cancer cells. Science. 1956;123:309–14. doi: 10.1126/science.123.3191.309. [DOI] [PubMed] [Google Scholar]
- 23.Fantin VR, St-Pierre J, Leder P. Attenuation of LDH-A expression uncovers a link between glycolysis, mitochondrial physiology, and tumor maintenance. Cancer Cell. 2006;9:425–34. doi: 10.1016/j.ccr.2006.04.023. [DOI] [PubMed] [Google Scholar]
- 24.Carr A, Samaras K, Burton S, Law M, Freund J, Chisholm DJ, et al. A syndrome of peripheral lipodystrophy, hyperlipidaemia and insulin resistance in patients receiving. HIV protease inhibitors. AIDS. 1998;12:F51–8. doi: 10.1097/00002030-199807000-00003. [DOI] [PubMed] [Google Scholar]
- 25.Ikezoe T, Saito T, Bandobashi K, Yang Y, Koeffler HP, Taguchi H. HIV-1 protease inhibitor induces growth arrest and apoptosis of human multiple myeloma cells via inactivation of signal transducer and activator of transcription 3 and extracellular signal-regulated kinase 1/2. Mol Cancer Ther. 2004;3:473–9. [PubMed] [Google Scholar]
- 26.Iliopoulos D, Hirsch HA, Struhl K. Metformin decreases the dose of chemotherapy for prolonging tumor remission in mouse xenografts involving multiple cancer cell types. Cancer Res. 2011;71:3196–201. doi: 10.1158/0008-5472.CAN-10-3471. [DOI] [PMC free article] [PubMed] [Google Scholar]
- 27.Libby G, Donnelly LA, Donnan PT, Alessi DR, Morris AD, Evans JM. New users of metformin are at low risk of incident cancer: a cohort study among people with type 2 diabetes. Diabetes Care. 2009;32:1620–5. doi: 10.2337/dc08-2175. [DOI] [PMC free article] [PubMed] [Google Scholar]
- 28.Evans JM, Donnelly LA, Emslie-Smith AM, Alessi DR, Morris AD. Metformin and reduced risk of cancer in diabetic patients. BMJ. 2005;330:1304–5. doi: 10.1136/bmj.38415.708634.F7. [DOI] [PMC free article] [PubMed] [Google Scholar]
- 29.Lai SW, Liao KF, Chen PC, Tsai PY, Hsieh DP, Chen CC. Antidiabetes drugs correlate with decreased risk of lung cancer: a population-based observation in Taiwan. Clin Lung Cancer. 2012;13:143–8. doi: 10.1016/j.cllc.2011.10.002. [DOI] [PubMed] [Google Scholar]
- 30.Ben Sahra I, Le Marchand-Brustel Y, Tanti JF, Bost F. Metformin in cancer therapy: a new perspective for an old antidiabetic drug? Mol Cancer Ther. 2010;9:1092–9. doi: 10.1158/1535-7163.MCT-09-1186. [DOI] [PubMed] [Google Scholar]
- 31.Podar K, Gouill SL, Zhang J, Opferman JT, Zorn E, Tai YT, et al. A pivotal role for Mcl-1 in Bortezomib-induced apoptosis. Oncogene. 2008;27:721–31. doi: 10.1038/sj.onc.1210679. [DOI] [PubMed] [Google Scholar]
- 32.Mills JR, Hippo Y, Robert F, Chen SM, Malina A, Lin CJ, et al. mTORC1 promotes survival through translational control of Mcl-1. Proc Natl Acad Sci U S A. 2008;105:10853–8. doi: 10.1073/pnas.0804821105. [DOI] [PMC free article] [PubMed] [Google Scholar]
- 33.Eguchi T, Itadani H, Shimomura T, Kawanishi N, Hirai H, Kotani H. Expression levels of p18INK4C modify the cellular efficacy of cyclin-dependent kinase inhibitors via regulation of Mcl-1 expression in tumor cell lines. Mol Cancer Ther. 2009;8:1460–72. doi: 10.1158/1535-7163.MCT-08-1159. [DOI] [PubMed] [Google Scholar]
- 34.Nguyen M, Marcellus RC, Roulston A, Watson M, Serfass L, Murthy Madiraju SR, et al. Small molecule obatoclax (GX15-070) antagonizes MCL-1 and overcomes MCL-1-mediated resistance to apoptosis. Proc Natl Acad Sci U S A. 2007;104:19512–7. doi: 10.1073/pnas.0709443104. [DOI] [PMC free article] [PubMed] [Google Scholar]
- 35.Wuilleme-Toumi S, Robillard N, Gomez P, Moreau P, Le Gouill S, Avet-Loiseau H, et al. Mcl-1 is overexpressed in multiple myeloma and associated with relapse and shorter survival. Leukemia. 2005;19:1248–52. doi: 10.1038/sj.leu.2403784. [DOI] [PubMed] [Google Scholar]
- 36.Zhao Y, Altman BJ, Coloff JL, Herman CE, Jacobs SR, Wieman HL, et al. Glycogen synthase kinase 3alpha and 3beta mediate a glucose-sensitive antiapoptotic signaling pathway to stabilize Mcl-1. Mol Cell Biol. 2007;27:4328–39. doi: 10.1128/MCB.00153-07. [DOI] [PMC free article] [PubMed] [Google Scholar]
- 37.Hsu J, Shi Y, Krajewski S, Renner S, Fisher M, Reed JC, et al. The AKT kinase is activated in multiple myeloma tumor cells. Blood. 2001;98:2853–5. doi: 10.1182/blood.v98.9.2853. [DOI] [PubMed] [Google Scholar]
- 38.Baumann P, Mandl-Weber S, Emmerich B, Straka C, Schmidmaier R. Inhibition of adenosine monophosphate-activated protein kinase induces apoptosis in multiple myeloma cells. Anti-cancer Drugs. 2007;18:405–10. doi: 10.1097/CAD.0b013e32801416b6. [DOI] [PubMed] [Google Scholar]
- 39.O’Neill LA, Hardie DG. Metabolism of inflammation limited by AMPK and pseudo-starvation. Nature. 2013;493:346–55. doi: 10.1038/nature11862. [DOI] [PubMed] [Google Scholar]
- 40.LeBlanc R, Catley LP, Hideshima T, Lentzsch S, Mitsiades CS, Mitsiades N, et al. Proteasome inhibitor PS-341 inhibits human myeloma cell growth in vivo and prolongs survival in a murine model. Cancer Res. 2002;62:4996–5000. [PubMed] [Google Scholar]
- 41.Santo L, Hideshima T, Kung AL, Tseng JC, Tamang D, Yang M, et al. Preclinical activity, pharmacodynamic, and pharmacokinetic properties of a selective HDAC6 inhibitor, ACY-1215, in combination with bortezomib in multiple myeloma. Blood. 2012;119:2579–89. doi: 10.1182/blood-2011-10-387365. [DOI] [PMC free article] [PubMed] [Google Scholar]
- 42.Chesi M, Robbiani DF, Sebag M, Chng WJ, Affer M, Tiedemann R, et al. AID-dependent activation of a MYC transgene induces multiple myeloma in a conditional mouse model of post-germinal center malignancies. Cancer Cell. 2008;13:167–80. doi: 10.1016/j.ccr.2008.01.007. [DOI] [PMC free article] [PubMed] [Google Scholar]
- 43.Bergsagel PL, Kuehl WM. Chromosome translocations in multiple myeloma. Oncogene. 2001;20:5611–22. doi: 10.1038/sj.onc.1204641. [DOI] [PubMed] [Google Scholar]
- 44.Keats Lab, Translational Genomics Research Institute (TGEN) website https://myelomagenomics.tgen.org/. Accessed January 30, 2015.
- 45.Lohr JG, Stojanov P, Carter SL, Cruz-Gordillo P, Lawrence MS, Auclair D, et al. Widespread genetic heterogeneity in multiple myeloma: implications for targeted therapy. Cancer Cell. 2014;25:91–101. doi: 10.1016/j.ccr.2013.12.015. [DOI] [PMC free article] [PubMed] [Google Scholar]
- 46.Kohli R, Shevitz A, Gorbach S, Wanke C. A randomized placebo-controlled trial of metformin for the treatment of HIV lipodystrophy. HIV Med. 2007;8:420–6. doi: 10.1111/j.1468-1293.2007.00488.x. [DOI] [PubMed] [Google Scholar]
- 47.Tucker GT, Casey C, Phillips PJ, Connor H, Ward JD, Woods HF. Metformin kinetics in healthy subjects and in patients with diabetes mellitus. Br J Clin Pharmacol. 1981;12:235–46. doi: 10.1111/j.1365-2125.1981.tb01206.x. [DOI] [PMC free article] [PubMed] [Google Scholar]
Associated Data
This section collects any data citations, data availability statements, or supplementary materials included in this article.