Supplemental Digital Content is available in the text
Keywords: body mass index, dose–response meta-analysis, mortality from lung cancer
Abstract
Background:
Whether body mass index (BMI) is associated with the risk of mortality from lung cancer (LC) is controversial, and the shape of dose–response relationship on this topic is not well-established. Thus, a dose–response meta-analysis was performed to clarify this association.
Methods:
A search of PubMed and EMBASE was conducted, and 2-stage random-effect dose–response model was used to yield summary relative risks and its shape.
Results:
Fifteen prospective cohort studies were eligible for inclusion criteria. The combined relative risks per 5 kg/m2 in BMI for risk of LC mortality is 0.94 (95% confidence interval] 0.92–0.96), and nonlinear association was found (Pnonlinearity < .0001), which indicated that compared with higher BMI, lower BMI showed higher LC mortality risk. Subgroup analyses revealed that this obesity paradox remained regardless of number of cases, follow-up duration, and study location, but this relationship was not observed among nonsmokers.
Conclusion:
A nonlinear association between BMI and the risk of LC mortality was found, and higher BMI participants have a lower risk of LC death than slim people.
1. Introduction
In recent years, both developed and developing countries are confronted with common health problems, and overweight and obesity brought burden to 1 billion people.[1] Overweight and obesity are major risk factors regarding chronic diseases, including cancer and cardiovascular disease.[2–4] Lung cancer (LC) tops the list of all cancer mortality[5] among malignancies, and whether obesity is 1 of the risk factor for LC-associated mortality obtained research interest.[6–9]
The relationship of obesity with the risk of LC mortality in previous studies showed inconsistency.[8,10] Some studies revealed a better prognosis among obese LC patients than normal-weight individuals[8,9,11]; nevertheless, other researches illustrated both lower body mass index (BMI) and higher BMI increased the risk of mortality from LC.[12] Additionally, Dehal et al[13] observed no association between obesity and the risk of LC mortality, which had been further verified in a prospective cohort study reporting that long-term annual change in BMI did not have an effect on the risk of mortality from LC.[14] A 2016 meta-analysis[6] conducted categorical analyses (eg, obesity vs normal weight) to clarify this association, which yielded an independent protective relationship between premorbid obesity and the risk of LC mortality, but mixed subjects with LC or not brought potential bias. Furthermore, several modifiers, such as sex,[2,8] smoking,[15,16] chronic obstructive pulmonary disease,[17] and asthma,[18] to some extent, affected results. Previous observational research frequently described the relationship of BMI with risk of cancer mortality as a U[19–21] or J shape in females[22]; however, limited sample size leaded to a lack of reliability of curve pattern.
So far, as we know, there is no available dose–response meta-analysis regarding this topic. Accordingly, the aims of this study were to reveal the relationship between BMI and the risk of mortality from LC, and to investigate precisely the shape of this association.
2. Methods
2.1. Ethics
Our study used previously published studies, and therefore, ethical approval was not necessary. In addition, all studies involved in our meta-analysis received ethics approval and patient consent was obtained.
2.2. Search strategy
This meta-analysis was conducted on the basis of PRISMA statement.[23] An electronic literature search of PubMed and EMBASE databases was performed through January 2017, and the search strategy was illustrated in detail in Supplementary list S1. We performed a manual search of previous reference lists and reviews too. Unpublished reports had not attempted to identify.
2.3. Inclusion criteria
Two investigators independently selected the suitable publications according to the following inclusion criteria: exposure—BMI at least 3 quantitative categories; outcome—adjusted relative risk (RR) with 95% confidence interval (CI) on the relations of BMI and the risk of mortality of LC; additional data—the number of death cases and its total subjects or person-years; prospective cohort studies were included. Letters, conferences, reviews, and meta-analyses were excluded.
2.4. Data extraction and quality assessment
One investigator conducted data extraction, and then another investigator independently checked for accuracy. The following information was extracted: first author, publication year, study location, sample size, death cases, BMI categories, mean follow-up duration, LC assessment, BMI assessment, and maximally adjusted risk estimate with corresponding 95% CI and adjustment factors.
Two investigators assessed the quality of included research using the Newcastle–Ottawa quality assessment scale independently. After evaluating its 3 aspects (selection, comparability, and outcome), each study could be assigned 9 stars at most (4 stars for selection; 3 stars for comparability; 2 stars for outcome). The quality of studies was ranked as low quality (below 3 stars), moderate quality (4–6 stars), and high quality (7–9 stars). Any conflicts on data extraction and quality assessment were solved by further discussion.
2.5. Data synthesis and statistical analysis
In this meta-analysis, RR with 95% CI were considered as common measures of the relationship between BMI and LC mortality risk, and a 2-stage dose–response meta-analysis was performed to assess this association. Firstly, the generalized least square regression described by Orsini et al[24] was used to calculate the category-specific linear trend and 95% CIs for every 5 kg/m2 increase within each study from the natural logs of adjusted hazard ratios (HRs) and CIs across the categories of BMI. Secondly, the random-effects model[25] was used to pool HRs and 95% CIs. This method requires additional data, such as the distribution of LC death cases, person-years, and RRs of each BMI categories. Person-years at every exposure level were often derived from follow-up duration and the number of participants when direct data were not reported. (And) We defined the mean or median of the quantitative categories as each exposure level, if not reported, the estimated midpoint was instead. Meanwhile, if lowest or highest boundaries were opened as cut-off values of BMI defined by WHO-recommended standard (eg, <18.5 kg/m2, 18.5–25 kg/m2, >30 kg/m2), we set the extreme value as adjacent boundary value (eg, >25 kg/m2 considered as 30 kg/m2). The between-study heterogeneity was assessed by Q statistic (Pheterogeneity < .10, suggesting statistically significance) and the I2 statistic[26] (an I2 of <50%, 50%–75%, or >75%, indicating low, moderate, or high heterogeneity, respectively). Potential nonlinear relationship between BMI and the risk of LC mortality was explored using restricted cubic splines, with 3 knots at percentiles 10%, 50%, and 90% of the distribution.[27,28] A Pnonlinearity value for curve linearity or nonlinearity was calculated by testing the null hypothesis that the estimated value of the second spline is equal to 0.[28] Random-effects dose–response models using logarithms of RRs and CIs, the number of cases, and the number of participants across BMI categories were also performed assuming linearity in the potential relationships. A goodness-of-fit chi-square value with Pgoodness-of-fit was calculated to test the suitability of the model.
To identify the potential modifiers, the stratified analyses were conducted by sex, smoking status, cases, study locations, and assessment of BMI, respectively. To further analyze the heterogeneity between eligible studies, sensitivity analysis was performed by ignoring a single study in turn. Potential publication bias was assessed by Begg rank-correlation test [29] and Egger linear regression test.[30] All analyses were conducted using STATA version12.0 (StataCorp, College Station, TX). P < .05 was considered statistically significant.
3. Results
3.1. Literature search
The flow of literature search exhibited in Fig. 1. Electronic search identified 397 citations and 372 citations from PubMed and EMBASE, respectively. After removing duplications, 508 citations were identified. A total of 468 citations were excluded after reviewing their titles and abstracts, and 25 citations were excluded after assessing in detail by reading full texts. Ultimately, 15 cohort studies were included in this meta-analysis.
Figure 1.
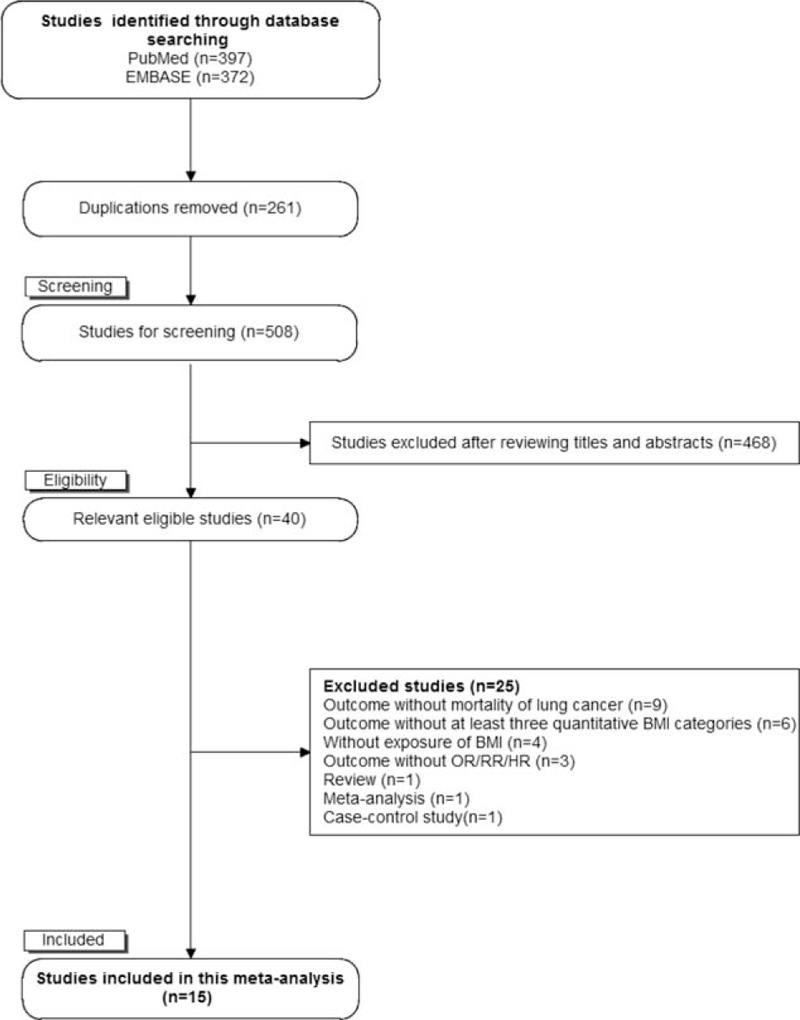
The flowchart of selecting eligible studies.
3.2. Study characteristics
The characteristics of 15 eligible researches are showed in Table 1. The included studies were published from 2002[31] to 2015.[7,14] Five studies were conducted in Europe,[7,14,32–34] 6 in America,[2,8,11,13,35,36] and 4 in Asia.[9,31,37,38] The sample size ranged from 2054[11] to 1,200,000[33] across studies, and the mean follow-up years of included studies varied from 3 years[38] to 28.1 years.[34] Except for 1 article based on community,[9] others were all population-based.[2,7,8,11,13,14,31–38] This meta-analysis included 27,229 death cases after more than 200 million person-years. The most participants in eligible studies were diagnosed by International Classification of Disease (ICD) 9 or 10 codes. BMI in all the studies was calculated as weight in kilograms divided by the square of height in meters, which was assessed by self-reported,[8] questionnaire,[2,9,33,35] and objective text.[13,32,34]
Table 1.
Characteristics of included studies regarding BMI and mortality from lung cancer.
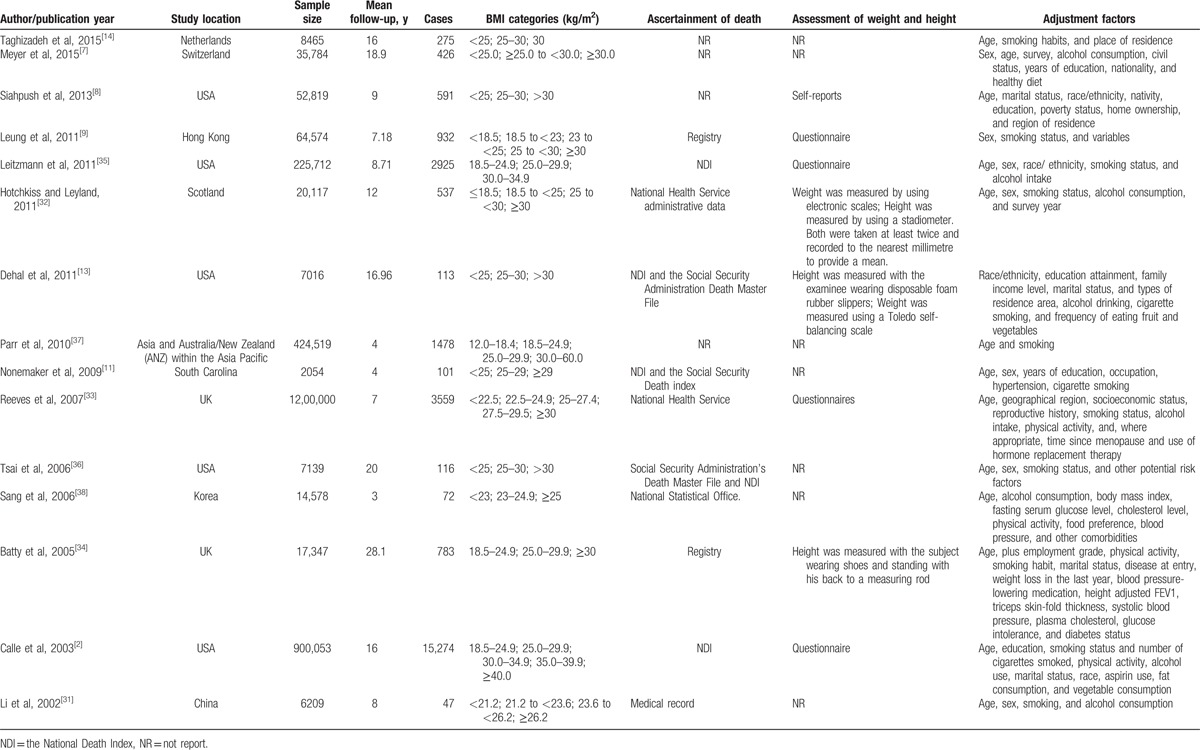
As for quality assessment, 7 studies were found to be of high quality[2,9,13,32–35]; the others were considered of moderate quality, which indicated that the quality of these eligible studies was generally good.
3.3. Association of BMI and lung cancer mortality
A total of 15,191,571 subjects and 28,273 death cases from LC among 15 studies were eligible for the relationship between BMI and LC mortality risk, and pooled RR for every 5 kg/m2 increment was 0.94 (95% CI 0.92–0.96, n = 15) (Fig. 2), with evidence of high heterogeneity (I2 = 94.70%, Pheterogeneity < .0001). A nonlinear association (goodness-of-fit χ214 = 125.11, Pgoodness-of-fit < .0001, Pnonlinearity < .0001) (Fig. 3) was found between BMI and the risk of mortality from LC. Compared with higher BMI, lower BMI showed higher LC mortality risk, indicating obesity exerts a protective effect on LC-associated death risk. No heterogeneity among this fitted spline was found (heterogeneity χ249 = 524.84, Pheterogeneity < .0001).
Figure 2.
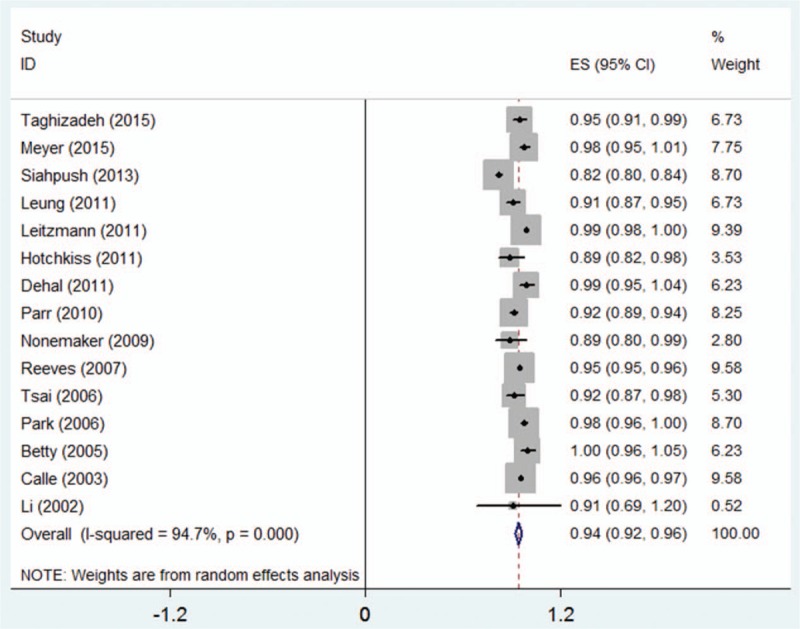
Two-stage dose–response meta-analysis on BMI and the risk of mortality from LC. The squares represent the relative risk (RR) per 5 kg/m2 increase for each individual study, with the area reflecting the weight assigned to the study. The horizontal line across each square represents the 95% confidence interval. The diamond represents the summary RR per 5 kg/m2 in BMI, with width representing 95% confidence interval. BMI = body mass index, LC = lung cancer.
Figure 3.
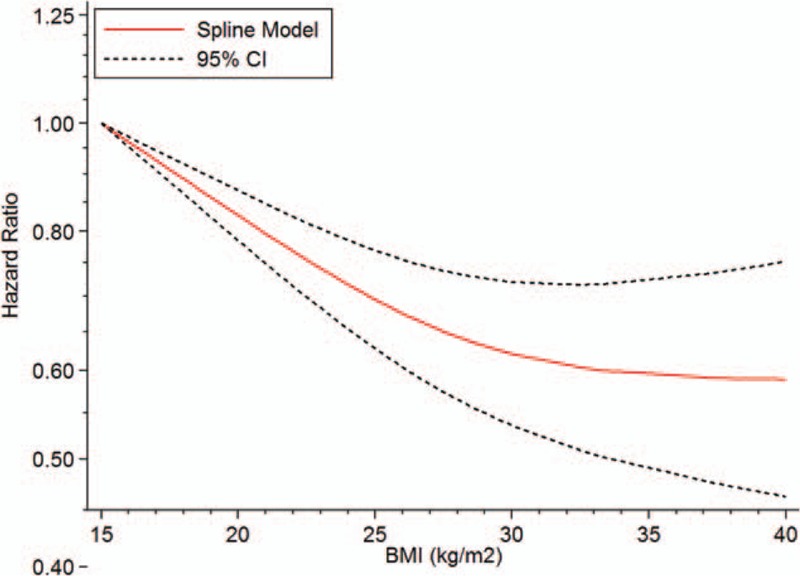
The dose–response analyses on BMI (kg/m2) and the risk of mortality from LC. BMI = body mass index, LC = lung cancer.
3.4. Subgroup analysis
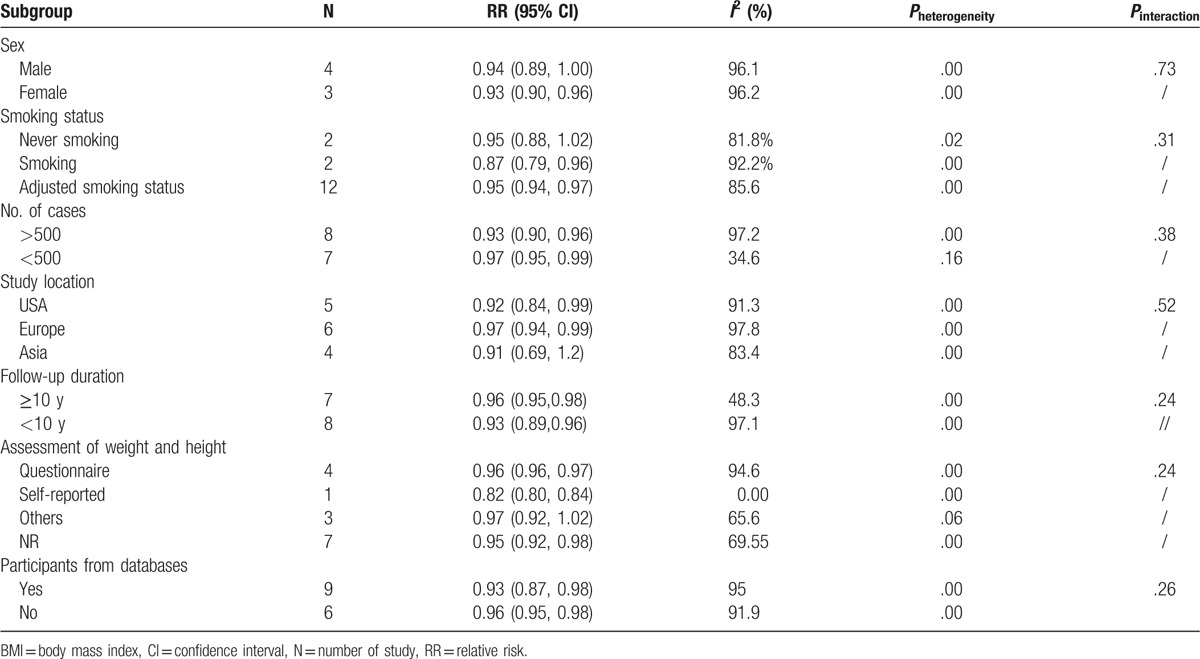
Several subgroup analyses on association between an increment of 5 kg/m2 and the risk of mortality from LC were conducted. Among all subgroups, there was no modification effect and difference observed on the basis of sex, smoking status, number of cases, study location, country, follow-up duration, and assessment of weight and height (all Pinteraction > .05) (Table 2). Nevertheless, female and smokers benefit from high BMI than male and nonsmoking people, respectively. Asian study also observed this obesity paradox.
Table 2.
Subgroup analyses regarding BMI and LC mortality.
3.5. Sensitivity analysis and publication bias
Sensitivity analysis by ignoring a single study in turn did not significantly change the total risk estimate of mortality of LC, which ranged from 0.94 (95% CI 0.92–0.96) to 0.96 (95% CI 0.95–0.97) (Supplementary Fig. 1. Nevertheless, when omitting the study reported by Siahpush et al,[8] the risk value deviated to 0.96 (95% CI 0.95–0.97), implying a potential influence factor. No evidence of public bias was found by both Egger test and Begg test (all P > .05) (Supplementary Fig. 2).
4. Discussion
A nonlinear relationship between BMI and mortality from LC risk was detected in this dose–response meta-analysis. Those with higher BMI obtained better survival; however, underweight or normal BMI suffered inversely and significantly associated with risk of LC mortality. In other words, there is an obesity paradox, which was consistent with previous studies.[7,9,11,32,33,36,37]
High heterogeneity in quantitative synthesis was observed, which remained when conducting subgroup analyses. Nevertheless, fitted dose–response curve with no heterogeneity was also identified. The sample size of eligible study made a contribution to lack of consistence in pooled results, because it ranged from 6209[31] to 1,200,000.[33] Additionally, considering those LC patients who died from LC often after a long time, most of included studies[7–9,11,13,14,32,36,38] extracted participants based on a series of databases, contributing to the inconsistence of results. However, we failed to yielded homogenous results when conducting subgroup analyses by this factor.
The interactions of smoking status influenced this relationship, which is 1 of the most crucial confounding factors. A collaborative analysis of 57 prospective studies indicated BMI was associated inversely with respiratory disease and LC. In the interaction by smoker, they found that these inverse associations were much stronger for smokers than nonsmokers.[4] We yielded similar results in our subgroup analysis, suggesting that BMI is inversely associated with risk of mortality from LC among smokers, and failed to obtain the statistical outcome among nonsmokers. On one hand, smoking plays an interventional effect by causing weight loss[39] and by increasing LC or its poor prognosis risk.[40] On the other hand, it was illustrated that cotinine concentration in serum was higher among obese than among lean people, which is a biological LC carcinogen.[41] Additionally, sex, follow-up duration, and number of cases were taken into account, but no significant difference was found between every subgroup.
The plausible mechanisms on association of BMI and the risk of mortality from LC were unclear. Obesity may exert a protective effect on respiratory-related incident or its mortalities, including tuberculosis[42] and other respiratory mortalities.[4] Immunity-based theory was proposed, underlying immune surveillance enhancement could blind the truth.[9] Meanwhile, more number of people had increased exposure to potentially harmful environment, which may lead to the increased risk of death from LC.
The strength of this dose–response meta-analysis was to clarify the association and its shape between BMI and the risk of mortality from LC. To the best of our knowledge, we are the first to identify these. We employed the dose–response meta-analysis to achieve a reliable model, and various subgroup or sensitivity analyses were conducted to explore the potential confounding factors. Previous meta-analysis[6] also tried to address these issues, but categorical analyses showed deficiency of power. Most important, their study entitled “Premorbid body mass index and mortality in patients with LC: a systematic review and meta-analysis” was confused among subjects with LC or not. In fact, most of their included studies included cancer-free patients. In addition, our eligible studies were awarded moderate to high-quality assessment. Moreover, included studies had adjusted major confounders such as age, sex, smoking status, and so on. Prospective cohort studies have the advantage of less bias than case-control studies. Multiple studies published in recent 1 or 2 years have been included in our meta-analysis in an attempt to update and validate the associations.
Still, it will have some limitations. Firstly, we never tried to search unpublished studies, leading to missing relevant studies. Then, death certificate was used to ascertain the causes of death in some studies, which is inaccurate in some conditions.[43] Lastly, although we could not find any publication bias in Begg test and Egger test, the publication bias must exist in this meta-analysis.
5. Conclusions
This meta-analysis found a nonlinear association between BMI and the risk of LC mortality. Obesity or overweight have a low risk of LC death, especially in females and smokers. Further prospective studies are needed to explain mechanisms for the protective effective of obesity, and heterogeneity from smoking status.
Supplementary Material
Footnotes
Abbreviations: BMI = body mass index, CI = confidence interval, LC = lung cancer, RR = relative risk.
The authors declare that there are no conflicts of interest.
Supplemental Digital Content is available for this article.
References
- [1].Glade MJ. Food, nutrition, and the prevention of cancer: a global perspective. American Institute for Cancer Research/World Cancer Research Fund, American Institute for Cancer Research, 1997. Nutrition 1999;15:523–6. [DOI] [PubMed] [Google Scholar]
- [2].Calle EE, Rodriguez C, Walker-Thurmond K, et al. Overweight, obesity, and mortality from cancer in a prospectively studied cohort of U.S. adults. N Engl J Med 2003;348:1625–38. [DOI] [PubMed] [Google Scholar]
- [3].McGee DL. Body mass index and mortality: a meta-analysis based on person-level data from twenty-six observational studies. Ann Epidemiol 2005;15:87–97. [DOI] [PubMed] [Google Scholar]
- [4].Whitlock G, Lewington S, Sherliker P, et al. Body-mass index and cause-specific mortality in 900,000 adults: collaborative analyses of 57 prospective studies. Lancet 2009;373:1083–96. [DOI] [PMC free article] [PubMed] [Google Scholar]
- [5].Siegel RL, Miller KD, Jemal A. Cancer statistics, 2016. CA Cancer J Clin 2016;66:7–30. [DOI] [PubMed] [Google Scholar]
- [6].Gupta A, Majumder K, Arora N, et al. Premorbid body mass index and mortality in patients with lung cancer: a systematic review and meta-analysis. Lung Cancer 2016;102:49–59. [DOI] [PubMed] [Google Scholar]
- [7].Meyer J, Rohrmann S, Bopp M, et al. Impact of smoking and excess body weight on overall and site-specific cancer mortality risk. Cancer Epidemiol Biomarkers Prev 2015;24:1516–22. [DOI] [PubMed] [Google Scholar]
- [8].Siahpush M, Singh GK, Tibbits M, et al. It is better to be a fat ex-smoker than a thin smoker: findings from the 1997-2004 National Health Interview Survey-National Death Index linkage study. Tobacco Control 2014;23:395–402. [DOI] [PubMed] [Google Scholar]
- [9].Leung CC, Lam TH, Yew WW, et al. Lower lung cancer mortality in obesity. Int J Epidemiol 2011;40:174–82. [DOI] [PubMed] [Google Scholar]
- [10].Koster A, Leitzmann MF, Schatzkin A, et al. The combined relations of adiposity and smoking on mortality. Am J Clin Nutr 2008;88:1206–12. [DOI] [PMC free article] [PubMed] [Google Scholar]
- [11].Nonemaker JM, Garrett-Mayer E, Carpenter MJ, et al. The risk of dying from lung cancer by race: a prospective cohort study in a biracial cohort in Charleston, South Carolina. Ann Epidemiol 2009;19:304–10. [DOI] [PubMed] [Google Scholar]
- [12].Kitsantas P, Wu H. Body mass index, smoking, age and cancer mortality among women: a classification tree analysis. J Obstetrics Gynaecol Res 2013;39:1330–8. [DOI] [PubMed] [Google Scholar]
- [13].Dehal A, Garrett T, Tedders SH, et al. Body mass index and death rate of colorectal cancer among a national cohort of U.S. adults. Nutr Cancer 2011;63:1218–25. [DOI] [PubMed] [Google Scholar]
- [14].Taghizadeh N, Boezen HM, Schouten JP, et al. BMI and lifetime changes in BMI and cancer mortality risk. PLoS One 2015;10.e0125261. [DOI] [PMC free article] [PubMed] [Google Scholar]
- [15].Doll R, Hill AB. Smoking and carcinoma of the lung: preliminary report. Br Med J 1950;2:739–48. [DOI] [PMC free article] [PubMed] [Google Scholar]
- [16].Liu BQ, Peto R, Chen ZM, et al. Emerging tobacco hazards in China: 1. Retrospective proportional mortality study of one million deaths. BMJ 1998;317:1411–22. [DOI] [PMC free article] [PubMed] [Google Scholar]
- [17].Turner MC, Chen Y, Krewski D, et al. Chronic obstructive pulmonary disease is associated with lung cancer mortality in a prospective study of never smokers. Am J Respir Crit Care Med 2007;176:285–90. [DOI] [PubMed] [Google Scholar]
- [18].Turner MC, Chen Y, Krewski D, et al. Cancer mortality among US men and women with asthma and hay fever. Am J Epidemiol 2005;162:212–21. [DOI] [PubMed] [Google Scholar]
- [19].Flegal KM, Graubard BI, Williamson DF, et al. Excess deaths associated with underweight, overweight, and obesity. JAMA 2005;293:1861–7. [DOI] [PubMed] [Google Scholar]
- [20].MacMahon S, Baigent C, Duffy S, et al. Body-mass index and cause-specific mortality in 900,000 adults: collaborative analyses of 57 prospective studies. Lancet 2009;373:1083–96. [DOI] [PMC free article] [PubMed] [Google Scholar]
- [21].Klenk J, Nagel G, Ulmer H, et al. Body mass index and mortality: results of a cohort of 184,697 adults in Austria. Eur J Epidemiol 2009;24:83–91. [DOI] [PubMed] [Google Scholar]
- [22].Katzmarzyk PT, Craig CL, Bouchard C. Original article underweight, overweight and obesity: relationships with mortality in the 13-year follow-up of the Canada Fitness Survey. J Clin Epidemiol 2001;54:916–20. [DOI] [PubMed] [Google Scholar]
- [23].Moher D, Liberati A, Tetzlaff J, et al. Preferred reporting items for systematic reviews and meta-analyses: the PRISMA statement. Int J Surg (London, England) 2010;8:336–41. [DOI] [PubMed] [Google Scholar]
- [24].Orsini N, Bellocco R, Greenland S. Generalized least squares for trend estimation of summarized dose–response data. Stata J 2006;6:40–57. [Google Scholar]
- [25].DerSimonian R, Laird N. Meta-analysis in clinical trials. Control Clin Trials 1986;7:177–88. [DOI] [PubMed] [Google Scholar]
- [26].Higgins JP, Thompson SG, Deeks JJ, et al. Measuring inconsistency in meta-analyses. BMJ (Clinical research ed) 2003;327:557–60. [DOI] [PMC free article] [PubMed] [Google Scholar]
- [27].Orsini N, Li R, Wolk A, et al. Meta-analysis for linear and nonlinear dose–response relations: examples, an evaluation of approximations, and software. Am J Epidemiol 2012;175:66–73. [DOI] [PMC free article] [PubMed] [Google Scholar]
- [28].Desquilbet L, Mariotti F. Dose–response analyses using restricted cubic spline functions in public health research. Stat Med 2010;29:1037–57. [DOI] [PubMed] [Google Scholar]
- [29].Begg CB, Mazumdar M. Operating characteristics of a rank correlation test for publication bias. Biometrics 1994;50:1088–101. [PubMed] [Google Scholar]
- [30].Egger M, Davey Smith G, Schneider M, et al. Bias in meta-analysis detected by a simple, graphical test. BMJ (Clinical research ed) 1997;315:629–34. [DOI] [PMC free article] [PubMed] [Google Scholar]
- [31].Li K, Yao C, Dong L. [Co-relationship between body mass index and mortality in the middle-aged and elderly population of Beijing City]. Zhonghua yu fang yi xue za zhi [Chin J Prevent Med] 2002;36:34–7. [PubMed] [Google Scholar]
- [32].Hotchkiss JW, Leyland AH. The relationship between body size and mortality in the linked Scottish Health surveys: cross-sectional surveys with follow-up. Int J Obesity 2011;35:838–51. [DOI] [PMC free article] [PubMed] [Google Scholar]
- [33].Reeves GK, Pirie K, Beral V, et al. Cancer incidence and mortality in relation to body mass index in the Million Women Study: cohort study. BMJ 2007;335:1134. [DOI] [PMC free article] [PubMed] [Google Scholar]
- [34].Batty GD, Shipley MJ, Jarrett RJ, et al. Obesity and overweight in relation to organ-specific cancer mortality in London (UK): findings from the original Whitehall study. Int J Obesity 2005;29:1267–74. [DOI] [PubMed] [Google Scholar]
- [35].Leitzmann MF, Moore SC, Koster A, et al. Waist circumference as compared with body-mass index in predicting mortality from specific causes. PLoS One 2011;6:e18582. [DOI] [PMC free article] [PubMed] [Google Scholar]
- [36].Tsai SP, Donnelly RP, Wendt JK, et al. Obesity and mortality in a prospective study of a middle-aged industrial population. J Occup Environ Med 2006;48:22–7. [DOI] [PubMed] [Google Scholar]
- [37].Parr CL, Batty GD, Lam TH, et al. Body-mass index and cancer mortality in the Asia-Pacific Cohort Studies Collaboration: pooled analyses of 424,519 participants. Lancet Oncol 2010;11:741–52. [DOI] [PMC free article] [PubMed] [Google Scholar]
- [38].Sang MP, Min KL, Soon AS, et al. Impact of prediagnosis smoking, alcohol, obesity, and insulin resistance on survival in male cancer patients: National Health Insurance Corporation Study. J Clin Oncol 2006;24:5017–24. [DOI] [PubMed] [Google Scholar]
- [39].Williamson DF, Madans J, Anda RF, et al. Smoking cessation and severity of weight gain in a national cohort. N Engl J Med 1991;324:739–45. [DOI] [PubMed] [Google Scholar]
- [40].Fucito LM, Czabafy S, Hendricks PS, et al. Pairing smoking-cessation services with lung cancer screening: a clinical guideline from the Association for the Treatment of Tobacco Use and Dependence and the Society for Research on Nicotine and Tobacco. Cancer 2016;122:1150–9. [DOI] [PMC free article] [PubMed] [Google Scholar]
- [41].Lukanova A, Toniolo P, Akhmedkhanov A, et al. A prospective study of insulin-like growth factor-I, IGF-binding proteins-1, -2 and -3 and lung cancer risk in women. Int J Cancer 2001;92:888–92. [DOI] [PubMed] [Google Scholar]
- [42].Leung CC, Lam TH, Chan WM, et al. Lower risk of tuberculosis in obesity. Arch Intern Med 2007;167:1297–304. [DOI] [PubMed] [Google Scholar]
- [43].Kircher T, Nelson J, Burdo H. The autopsy as a measure of accuracy of the death certificate. N Engl J Med 1985;313:1263–9. [DOI] [PubMed] [Google Scholar]
Associated Data
This section collects any data citations, data availability statements, or supplementary materials included in this article.


