Abstract
The aim of the study was to evaluate splenic glucose metabolism in macrophage activation syndrome (MAS), characterized by overwhelming systemic inflammation. Splenic 18F-fluorodeoxyglucose (FDG) uptake was compared in patients with MAS and sepsis using positron emission tomography/computed tomography (PET/CT).
Clinical and FDG-PET/CT findings from patients with MAS and those with culture-proven sepsis were evaluated. The standardized uptake value (SUV) for the spleen and liver were measured. The maximum of the spleen to liver SUV ratio (SLRmax) was calculated as spleen SUVmax/liver SUVmean. The radiological splenic volume was also measured, and splenic metabolic volume (MV) was defined as the total splenic volume with an SLRmean > 1.14. The association between clinical features, laboratory variables, and SLRmax was analyzed.
The median SLRmax and splenic MV were significantly higher in patients with MAS (n = 38) than they were in those with sepsis (n = 15) (SLRmax: 1.51 vs 1.09, P = .001; MV: 346.0 vs 154.0, P = .015). Multivariate analyses revealed that SLRmax > 1.31 was useful for discriminating between MAS and sepsis. SLRmax positively correlated with ferritin and lactate dehydrogenase level in MAS. Furthermore, MAS patients with high splenic FDG uptake (SLRmax > 1.72) had higher in-hospital mortality compared to those with moderate to low splenic FDG uptake (P = .013).
This study was the first to demonstrate that splenic FDG uptake is significantly elevated in patients with MAS compared to those with sepsis. This may be useful to differentiate between MAS and sepsis, and to predict poor prognosis in patients with MAS.
Keywords: glycolysis, macrophage activation syndrome, sepsis, spleen glucose metabolism
1. Introduction
Macrophage activation syndrome (MAS) is a “cytokine storm syndrome” of excessive immune activation that leads to high fever, cytopenia, hepatosplenomegaly, and multiorgan injury.[1,2] Although MAS is characterized by the uncontrolled expansion and activation of T lymphocytes and macrophages,[3] the underlying pathogenesis of MAS remains unknown. MAS can arise in clinical settings with systemic inflammation owing to infection, malignancy, or autoimmune diseases. MAS is known as a secondary form of hemophagocytic lymphohistiocytosis (HLH), because in both HLH and MAS, severe hemophagocytosis (i.e., phagocytosis of erythrocytes, platelets, and leukocytes by histocytes) in the bone marrow is often observed.[4] However, the role of bone marrow biopsy in the diagnosis of MAS is limited because hemophagocytosis is occasionally not detected in the early stages, and mild hemophagocytosis can be observed in many other inflammatory diseases.[5] Consequently, the diagnosis of MAS in patients with systemic inflammatory conditions has been very challenging for clinicians. Multiple biomarkers including interleukin (IL)-18, soluble IL-2 receptor, and natural killer cell activity have been evaluated.[6] Unfortunately, these biomarkers are not well-validated and accessible to clinicians in their daily practice; thus, evaluation of other markers associated with macrophage activation to identify MAS is necessary.
It has been reported that MAS is a fatal disease with a poor prognosis and, as such, early recognition and treatment are critical for the survival of the patient.[7,8] However, because there is no disease-specific clinical manifestation in MAS, it is often difficult to differentiate MAS from systemic inflammatory diseases such as sepsis, since fever, hypotension, tachycardia, and thrombocytopenia can be present in both diseases. Indeed, being able to accurately differentiate between MAS and sepsis is critical, as the treatment strategies for these 2 diseases are very different. Although potent immune suppression with glucocorticoid, cyclophosphamide, or etoposide is helpful in patients with MAS, it can be harmful in patients with sepsis.
Recent studies have suggested that 18F-fluorodeoxyglucose (FDG) positron emission tomography/computed tomography (PET/CT) may be useful for detecting inflammatory conditions according to FDG uptake in the inflamed tissues of individuals with vasculitis, myositis, and arthritis.[9,10] Furthermore, we recently demonstrated that FDG uptakes are increased in spleen of patients with febrile autoimmune diseases than in patients with localized infections.[11] It suggests that spleen glucose metabolism is increased in autoimmune diseases because of abnormal immune cell activation. Therefore, spleen FDG uptake might be a biomarker to systemic immune activation. However, it is not clear whether spleen FDG uptake can differentiate systemic autoimmune diseases from systemic infection because both conditions are associated with systemic immune activation. In the present study, we compared splenic FDG uptake on PET/CT to differentiate patients with MAS from those with sepsis, and to determine whether these data can predict the prognosis of patients with MAS.
2. Materials and methods
2.1. Patient selection
The medical records of MAS patients who underwent 18F-FDG PET/CT and were admitted to Severance Hospital, Seoul, South Korea, from December 2005 to December 2015, were retrospectively reviewed. The inclusion criteria were as follows: (i) patients with documented fever (≥37.8°C) during hospital admission and (ii) patients diagnosed with MAS according to the 2016 European League Against Rheumatism/American College of Rheumatology/Paediatric Rheumatology International Trials Organisation Collaborative Initiative classification criteria for MAS (i.e., patients with fever, a ferritin level ≥ 684 ng/mL, and who fulfilled more than 2 of the following criteria: platelet count ≤ 181,000/μL, aspartate aminotransferase (AST) level > 48 units/L, triglyceride level >156 mg/dL, and fibrinogen level ≤ 360 mg/dL).[12,13] Patients were excluded if they fulfilled the classification criteria for MAS with a definite focus of infection and/or residual cancer. As a result, a total of 38 patients with MAS were enrolled. For comparison, 15 patients with sepsis who had a positive blood culture at the time of PET/CT imaging and 40 randomly selected healthy control subjects who had undergone a routine health check-up were also enrolled. This study was approved by the Institutional Review Board of Severance Hospital (IRB approval number 4-2016-1114) and conducted in accordance with the principles set forth in the Declaration of Helsinki.
2.2. Clinical and laboratory data collection
We collected the following clinical data: age, sex, in-hospital duration, and mortality. As for the laboratory data, we reviewed the white blood cell (WBC), neutrophil, lymphocyte, monocyte, and platelet counts, as well as the hemoglobin, erythrocyte sedimentation rate (ESR), C-reactive protein (CRP), blood urea nitrogen, creatinine, AST, alanine aminotransferase (ALT), total bilirubin, total protein, albumin, ferritin, and lactate dehydrogenase (LDH) levels, which were measured within 3 days of the 18F-FDG PET/CT scan. In-hospital mortality was defined as all-cause mortality during hospital admission.
2.3. Evaluation of the hemophagocytic syndrome score (HScore) in patients with MAS and with sepsis
We further evaluated the HScore in our study population to validate patients classified as having MAS according to the 2016 EULAR/ACR/PRINTO classification criteria. As previously described, the HScore and probability of having hemophagocytic syndrome were calculated by using the calculator available online (http://saintantoine.aphp.fr/score/).[14]
2.4. 18F-FDG PET/CT image acquisition and assessment
18F-FDG PET/CT scans were performed using a dedicated PET/CT scanner (Discovery STe, GE Healthcare or Biograph 40 TruePoint, Siemens Medical Systems). All patients fasted for 6 hours prior to the 18F-FDG PET/CT scan, and a blood glucose level below 140 mg/dL was confirmed. The PET/CT scan was performed 60 minutes after the intravenous administration of 5.5 MBq/kg of 18F-FDG. The CT scan was performed at 30 mA and 130 kVp on the Discovery STe scanner or at 36 mA and 120 kVp on the Biograph TruePoint scanner. The PET scan was performed with an acquisition time of 2.5 minutes per bed position in the 3-dimensional mode. PET images were reconstructed using an ordered-subset expectation maximisation algorithm with attenuation correction.
Semi-quantitative and volumetric measurements, including the maximum standardized uptake value (SUVmax), mean SUV (SUVmean), spleen radiologic volume (RV), and spleen metabolic volume (MV), were performed using the MIMvista software (MIMvista Corp., Cleveland, OH). The spleen radiologic volume was calculated by drawing a volume of interest (VOI) manually using the CT image obtained during PET/CT image acquisition. Spleen SUVs were obtained on 3 non-adjacent slices and bone-marrow SUVs were obtained separately from the lumbar vertebrae 1–5 and averaged. Three spherical 1-cm sized VOI were drawn in the liver, 2 in the right lobe and 1 in the left lobe. The SUVmean of the liver was calculated as the mean SUV value of 3 VOIs. The maximum of the spleen to liver SUV ratio (SLRmax) was calculated by dividing the spleen SUVmax by the liver SUVmean, and the maximum of the bone marrow to liver SUV ratio (BLRmax) was calculated by dividing the bone marrow SUVmax by the liver SUVmean. The spleen MV was defined as the total spleen volume with an SLRmean > 1.14, which corresponds to the maximal cut-off value of SLRmean in the discrimination between MAS and sepsis.
2.5. Statistical analysis
Data were analyzed using the Statistical Package for the Social Sciences software version 21 (SPSS Inc., Chicago, IL). Continuous variables are presented as the median with the interquartile range (IQR), and categorical variables are expressed as frequencies and percentages. Continuous variables were compared using the Mann–Whitney U test, and categorical data were compared using the chi-square or the Fisher's exact test. Correlations between the 18F-FDG PET/CT variables and laboratory variables and the presence of hemophagocytosis in MAS were calculated with the Pearson and Spearman correlation analyses, respectively.
The maximal cut-off values for SLRmax in discriminating MAS and sepsis, and predicting in-hospital mortality, were calculated using the area under the receiver operating characteristic (ROC) curve analyses. Multivariate logistic regression analyses using the backward method were used to compare 18F-FDG PET/CT and laboratory variables to discriminate between MAS and sepsis. Comparison of the cumulative survival rate in patients with SLRmax > 1.72 and SLRmax ≤ 1.72 was performed using the Kaplan–Meier method and the log-rank test. In all statistical analyses, differences were considered to be significant at P < .05 (2-tailed).
3. Results
3.1. Patients’ baseline characteristics
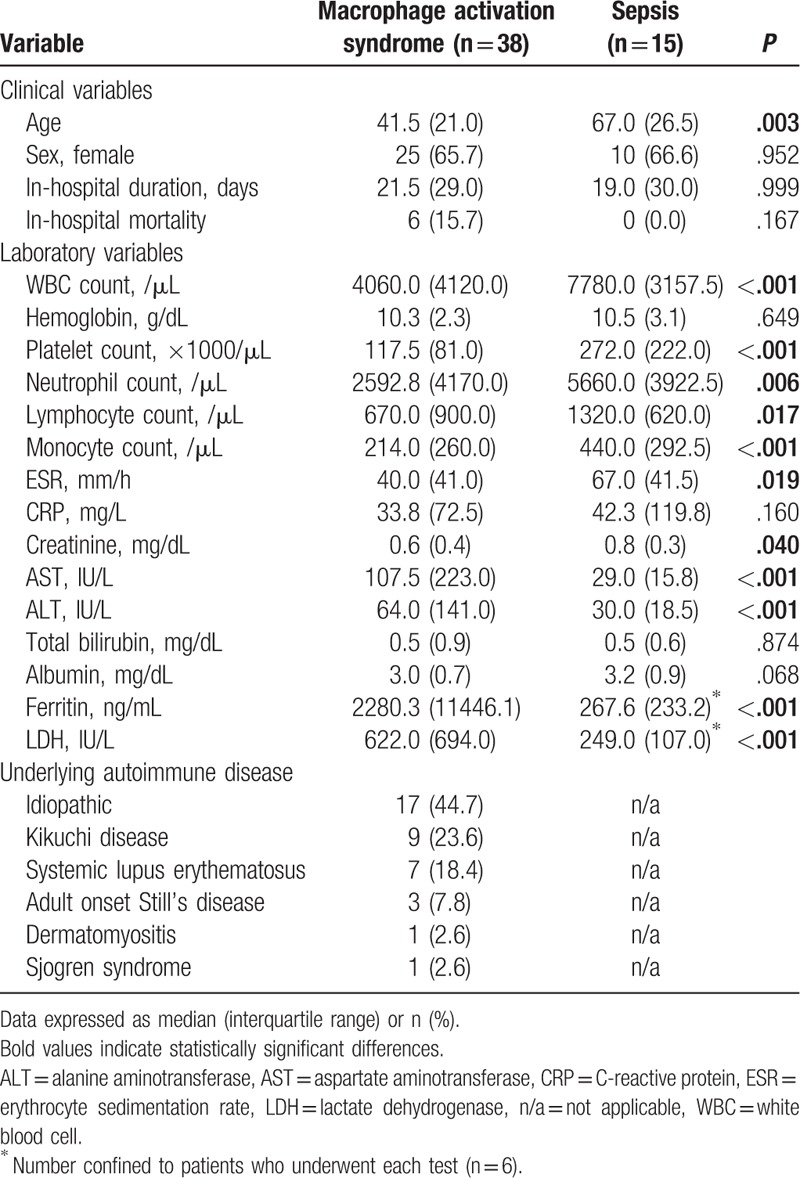
The median ages of the patients with MAS were significantly lower than those of the patients with sepsis (41.5 vs 67.0, P = .003). No difference in in-hospital duration was identified between the 2 patient groups. In patients with MAS, 6 patients (15.7%) suffered in-hospital mortality, whereas there was no death in sepsis. Patients with MAS had significantly lower WBC, platelet, neutrophil, lymphocyte, and monocyte counts, as well as a lower ESR and creatinine level than patients with sepsis. Patients with MAS had significantly higher AST, ALT, ferritin, and LDH levels than patients with sepsis (all P < .001; Table 1). Although the cause of MAS was idiopathic in most cases (17/38 [44.7%]), Kikuchi disease (9/38 [23.6%]), and systemic lupus erythematosus (7/38 [18.4%]) were the 2 most common causes of MAS in patients with a known primary disorder, followed by adult-onset Still's disease (3/38 [7.8%]), dermatomyositis, and Sjögren's syndrome (both 1/38 [2.6%], respectively) (Table 1). In patients with sepsis, the most prevalent source of origin was the abdomen (4/15 [26.6%]), followed by the urinary tract, lung, and musculoskeletal area (3/15 [20.0%], respectively). In addition, 1 patient's source of infection was the heart and the other patient's was the brain (6.6%, respectively). Among 38 MAS patients, 28 patients had undergone a bone marrow study and hemophagocytosis was observed in 15 patients.
Table 1.
Baseline characteristics of patients with macrophage activation syndrome and sepsis.
3.2. Evaluation of the HScore in patients with MAS and with sepsis
The absolute HScore and probability of having hemophagocytic syndrome was compared among patients who were classified as having MAS according to the 2016 EULAR/ACR/PRINTO classification criteria and patients with sepsis. Comparison of the HScore between 2 groups showed that patients with MAS had a higher HScore and probability of having hemophagocytic syndrome than patients with sepsis (P < .001, respectively) (Fig. 1A and B).
Figure 1.
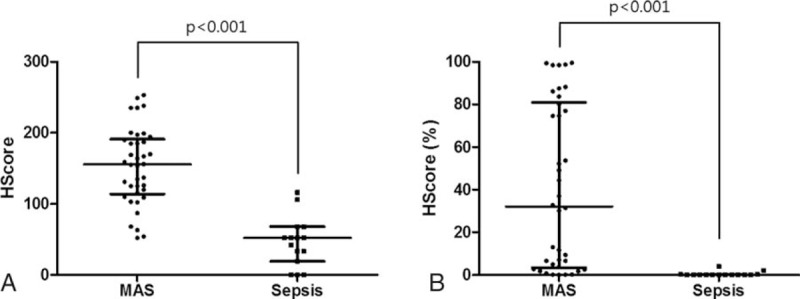
Evaluation of the HScore and probability of having hemophagocytic syndrome in patients with MAS and sepsis. (A) Comparison of the absolute HScore between the groups. (B) Comparison of the probability of having hemophagocytic syndrome between the groups. Data are expressed as the median and the interquartile range. HScore (%) = probability of having the hemophagocytic syndrome, MAS = macrophage activation syndrome.
3.3. Comparisons of 18F-FDG PET/CT variables
Evaluation of FDG uptake in spleen and bone marrow among patients with MAS, patients with sepsis, and healthy controls showed that the SLR and BLR were significantly higher in patient groups than they were in healthy controls (P < .001, respectively) (Fig. 2A and B). Patients with MAS had significantly higher SLR than patients with sepsis (median SLRmax: 1.51 [IQR 0.71] vs 1.09 [IQR 0.28], P = .001) (Fig. 2A). However, the BLR did not differ between patients with MAS and patients with sepsis (median BLRmax: 1.28 [IQR 0.61] vs 1.14 [IQR 0.56], P = .290) (Fig. 2B). When the volumetric parameters of FDG PET/CT were applied, patients with MAS had a significantly higher median spleen RV (348.5 cm3 [IQR 221.7] vs 222.9 cm3 [IQR 314.2], P = .046) and median spleen MV (346.0 cm3 [IQR 272.1] vs 154.0 cm3 [IQR 274.9], P = .015) than patients with sepsis (Fig. 2 C and D). Representative FDG PET/CT images in patients with MAS, sepsis, and a healthy control subject are shown in Fig. 2E.
Figure 2.
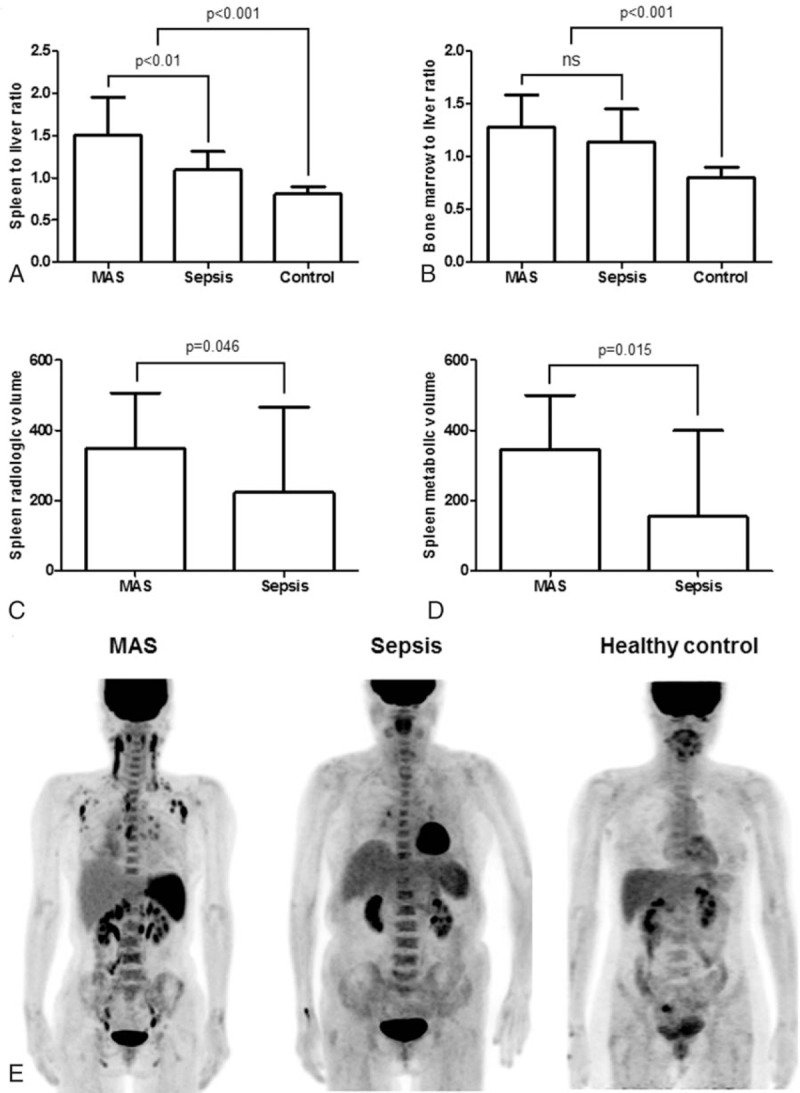
Comparison of the standardized 18F-fluorodeoxyglucose uptake values (SUV) in patients with macrophage activation syndrome (MAS; n = 38), patients with sepsis (n = 15), and healthy controls (n = 40). (A) The SUVmax of spleen to liver ratio. (B) The SUVmax of bone marrow to liver ratio. (C) Spleen radiologic volume. (D) Spleen metabolic volume. (E) Representative 18F-FDG PET/CT images in patient with MAS (left), patient with sepsis (middle), and healthy control subject (right). Data are expressed as the median; error bars indicate the interquartile range. 18F-FDG PET/CT = 18-fluoro-2-deoxyglucose positron emission tomography/computed tomography, MAS = macrophage activation syndrome, ns = not significant, SUV = standardized uptake value.
3.4. Utility of the FDG PET/CT and laboratory variables for differentiating between MAS and sepsis
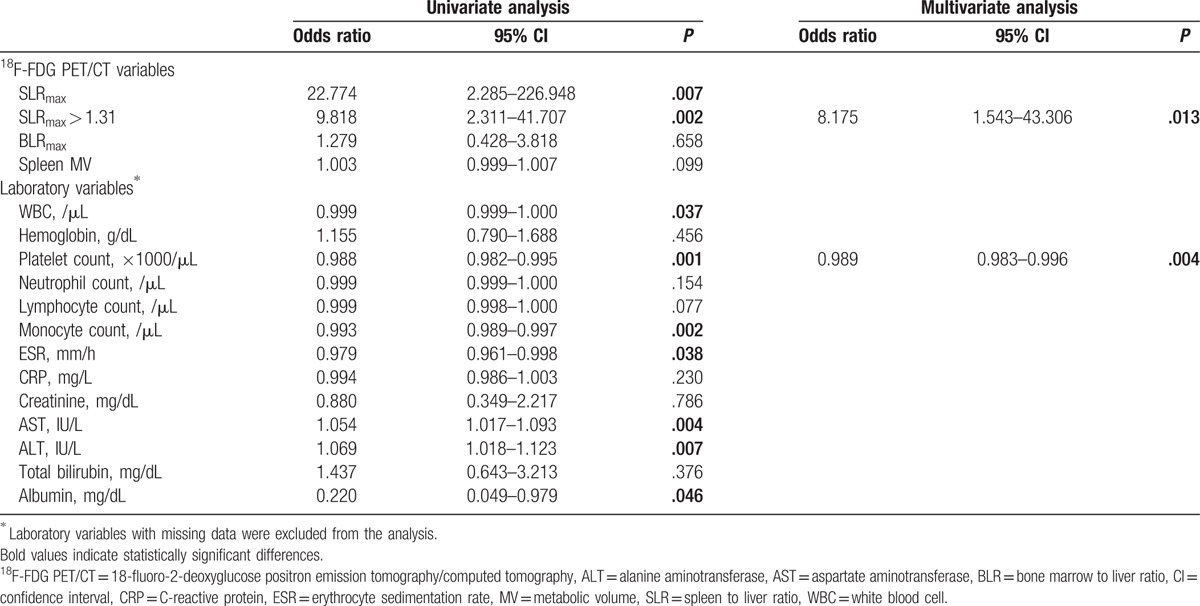
Using ROC analyses, an SLRmax cut-off > 1.31 was found to have the highest discriminating power in both groups (Table 2 and Fig. 3). Univariate analysis showed that SLRmax > 1.31, WBC, platelet, monocyte counts, ESR, AST, ALT, and albumin levels were significant for discriminating between MAS and sepsis. However, in the multivariate analysis, SLRmax > 1.31 (odds ratio [OR]: 8.175, 95% confidence interval [CI], 1.543–43.306, P = .013) and platelet count (OR: 0.989, 95% CI: 0.983–0.996, P = .004) were statistically significant factors (Table 3).
Table 2.
Comparison of the abilities of 18F-FDG PET/CT variables to differentiate between macrophage activation syndrome and sepsis using receiver operating characteristic analyses.
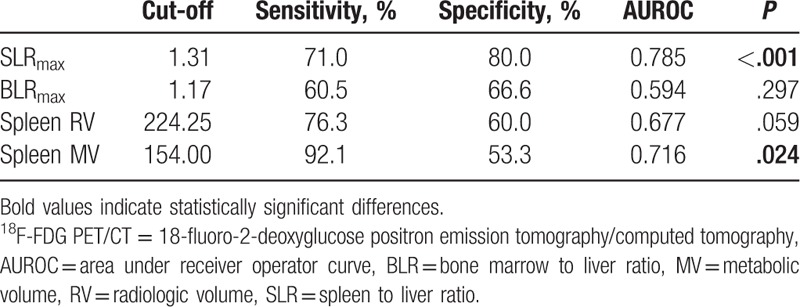
Figure 3.
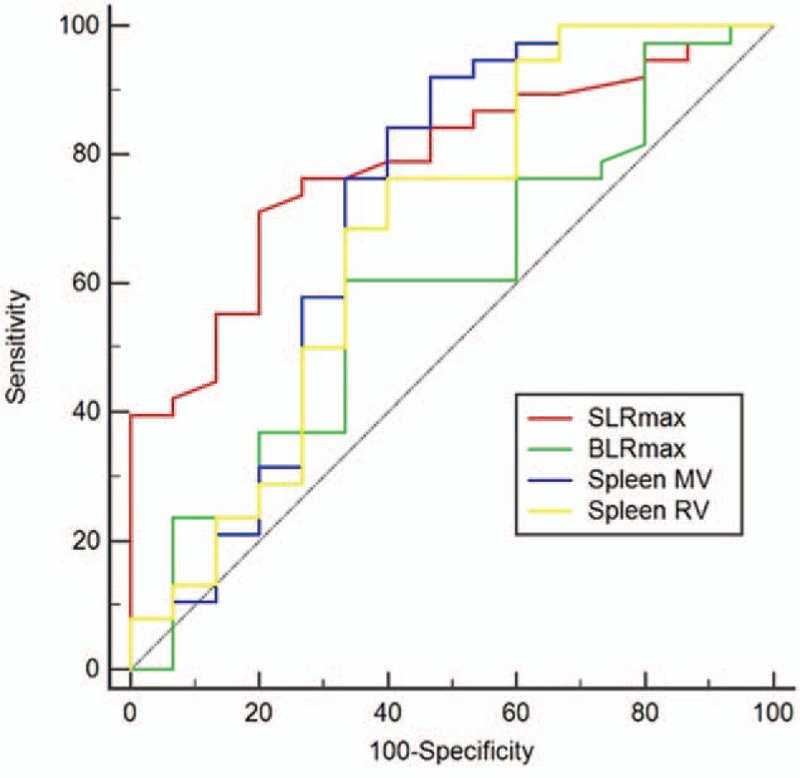
Receiver operating characteristic curves for the FDG PET/CT variables to differentiate between macrophage activation syndrome and sepsis. 18F-FDG PET/CT = 18-fluoro-2-deoxyglucose positron emission tomography/computed tomography.
Table 3.
Comparison of the abilities of 18F-FDG PET/CT and laboratory variables to differentiate between macrophage activation syndrome and sepsis by logistic regression analyses.
3.5. Association of laboratory variables with FDG-PET/CT variables in patients with MAS
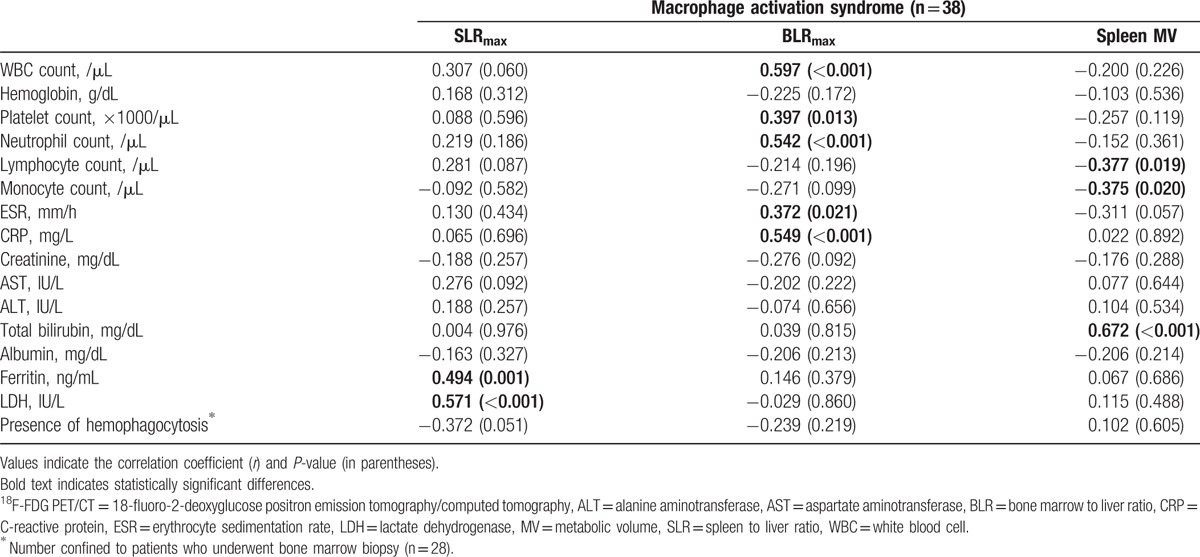
We evaluated the associations between the laboratory variables and FDG PET/CT variables in patients with MAS. In patients with MAS, the SLRmax was positively correlated with the ferritin and LDH levels (Table 4). The strongest correlation was between the SLRmax and LDH values (r = 0.571, P < .001). In contrast, the BLRmax showed a different correlation pattern as they were positively correlated with the WBC, platelet, and neutrophil counts, and with the ESR and CRP levels (Table 4). The strongest correlation was between the BLRmax and WBC count (r = 0.597, P < .001). The spleen MV values were negatively correlated with the lymphocyte (r = −0.377, P = .019) and monocyte counts (r = −0.375, P = .02) and strongly correlated with the total bilirubin levels (r = 0.672, P < .001).
Table 4.
Correlations between laboratory variables and 18F-FDG PET/CT variables in patients with macrophage activation syndrome.
3.6. Comparison of in-hospital mortality of patients with MAS according to SLRmax
There were 6 in-hospital mortalities among patients with MAS. The area under the ROC curve analysis revealed that SLRmax > 1.72 was the best cut-off to predict in-hospital mortality in patients with MAS. In patients with SLRmax >1.72, 5 died, whereas there was only 1 death in those with SLRmax ≤ 1.72. Kaplan–Meier analysis with the log-rank test revealed an in-hospital mortality rate that was higher in patients with SLRmax > 1.72 than in those with SLRmax ≤ 1.72 (P = .013) (Fig. 4).
Figure 4.
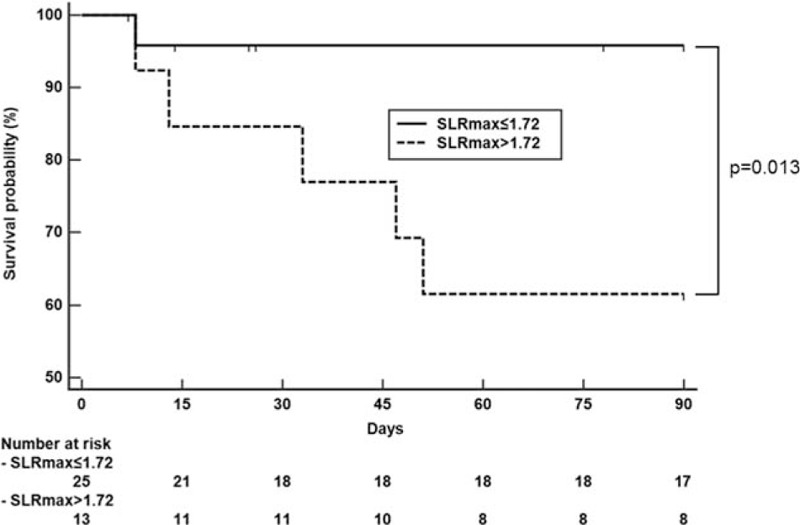
Comparison of the cumulative survival rate in those with a spleen to liver standardized uptake value ratio (SLRmax) ≤ 1.72 versus SLRmax > 1.72 in patients with macrophage activation syndrome. SLR = spleen-to-liver ratio.
4. Discussion
Recent discoveries in immunometabolism suggest that, similar to cancer cells, proliferating immune cells demonstrate a high rate of glycolysis, whereas the rate in resting immune cells is lower.[15] The rate of glycolysis in cancer cells is known to be up to 200 times higher than in normal cells, even though oxygen is available for oxidative phosphorylation.[16] This phenomenon of aerobic glycolysis is known as the Warburg effect, which is the underlying mechanism of increased FDG uptake in cancer cells on PET/CT. Taking advantage of this high metabolism, PET/CT parameters, such as SUV and MV, are able to provide clinically useful information regarding the characteristics of cancer (progression, drug resistance, etc.).[17] Similar to cancers, FDG PET/CT have been useful for diagnosing and monitoring disease activity in autoimmune diseases, such as vasculitis, immunoglobulin G4-related disease, and rheumatoid arthritis, by measuring local inflammatory responses by the degrees of FDG uptake.[18] In the present study, we evaluated FDG uptake of the spleen and bone marrow in patients with MAS, a disease characterized by overwhelming systemic immune activation. Patients with MAS demonstrated significantly increased splenic FDG uptake compared to patients with sepsis and healthy controls. Although bone marrow FDG uptake was higher in patients with MAS and sepsis than in healthy controls, it was not different between those with MAS and sepsis. Therefore, splenic FDG uptake is important in differentiating pathologically activated immune cell in MAS from physiologically activated immune cells in sepsis.
In current clinical practice, the most common method to evaluate the spleen is measuring its size using ultrasound or CT. Since immune activation is associated with splenomegaly, we evaluated the additive values of volumetric compared with SUV-derived PET/CT parameters to gain better insight to splenic glucose metabolism in differentiating MAS from sepsis. Although the spleen MV cutoff (154.00 cm3) had a higher area under the curve than the spleen RV cutoff (224.25 cm3) in differentiating MAS from sepsis, splenic MV was insignificant in univariate analysis. In contrast, SLRmax values were statistically significant in differentiating MAS from sepsis in the univariate and the multivariate analyses. The degree of metabolic derangement appeared to be more reflective of the severity of inflammation than the volume of the spleen and, thus, more important in differentiating MAS from sepsis. Of the laboratory parameters, platelet count was the only significant discriminator between MAS and sepsis in the multivariate analyses, with MAS showing lower counts.
FDG-PET/CT variables were associated with different clinical parameters in MAS. SLR was positively correlated with ferritin and LDH levels, but not with nonspecific inflammatory markers such as ESR, CRP, and WBC and neutrophil counts. Given the fact that extremely high levels of ferritin in MAS are due to immune cell activation,[1,19] splenic FDG uptake could be associated with the pathogenesis of MAS rather than a nonspecific consequence of inflammation. Interestingly, Ruscitti et al[20] reported older age and increased serum ferritin levels were associated with poor prognosis in MAS. Since SLRmax is associated with poor prognosis in MAS and there is significant association between ferritin and SLRmax, further studies are necessary to evaluate the relationship between ferritin and spleen glucose metabolism in MAS. In contrast, BLR was positively correlated with ESR, CRP, and WBC and neutrophil counts. As there was no difference in BLR between MAS and sepsis, bone marrow FDG uptake may represent nonspecific immune cell production in bone marrow in systemic inflammation. Splenic MV was negatively correlated with lymphocyte and monocyte count and positively correlated with bilirubin. As the underlying mechanisms of increased glucose metabolism in the spleen and bone marrow in systemic inflammation have been poorly studied, further experimental investigation appears to be necessary to understand the different patterns of correlation between clinical parameters and FDG PET/CT variables.
Taking together the results, our study demonstrated novel benefits of PET/CT in MAS patients in diagnosis and treatment by evaluating splenic FDG uptake. First, it might help to differentiate MAS and sepsis. Differentiating between MAS and sepsis is a very challenging task for clinicians because the clinical manifestations of systemic inflammation are similar, and both are potentially fatal diseases that require different treatment strategies. Second, it might identify MAS patients with poor prognosis in the early stage. Of note, SLRmax > 1.72 was predictive of in-hospital mortality in MAS. Therefore, the use of FDG-PET/CT may provide an opportunity to initiate anti-cytokine therapy in MAS, which may decrease in-hospital mortality. Although the incidence of MAS is rather low, early differentiation of MAS from sepsis has become increasingly important given the promising results of anticytokine therapy against IL-1, IL-6, and TNF in MAS.[21] Because PET/CT has been known to evaluate hidden malignancy or infection which can be underlying cause of MAS, our findings provide additional evidence that PET-CT can be helpful in MAS patients for proper medical care.
The strength of our study is the large number of MAS patients who underwent PET/CT, given the very low incidence of MAS in the general population. There are, however, limitations to this study. First, the data for this study were collected retrospectively, which may have led to bias in patient selection and analysis. Second, as critically ill patients with sepsis could not undergo FDG PET/CT, the exclusion of such patients might have influenced the results of in-hospital mortality in patients with sepsis.
In conclusion, splenic FDG uptake was significantly higher in patients with MAS than in those with sepsis. FDG uptake also showed a distinct pattern of correlation with laboratory markers and was useful in predicting the in-hospital mortality in patients with MAS. These results should encourage the use of FDG-PET/CT as a novel approach to early differentiation of MAS from sepsis, which may have potential prognostic implications for patients presenting with systemic inflammation.
Footnotes
Abbreviations: ALT = alanine aminotransferase, AST = aspartate aminotransferase, BLR = bone marrow to liver SUV ratio, CI = confidence interval, CRP = C-reactive protein, ESR = erythrocyte sedimentation rate, FDG = 18F-fluorodeoxyglucose, HLH = hemophagocytic lymphohistiocytosis, IL = interleukin, IQR = interquartile range, LDH = lactate dehydrogenase, MAS = macrophage activation syndrome, MV = metabolic volume, OR = odds ratio, ROC = receiver operating characteristic, RV = radiologic volume, SLR = spleen to liver SUV ratio, SUV = standardized uptake value, VOI = volume of interest, WBC = white blood cell.
Funding: Dr. Song's work was supported by the Basic Science Research Program (2015R1C1A1A01053140) through the National Research Foundation of Korea, funded by the Ministry of Education, Science, and Technology. Dr. Yun's work was supported by a National Research Foundation of Korea grant funded by the Korean government (MSIP) (No. NRF-2011-0030086).
The authors have no conflicts of interest to disclose.
References
- [1].Rosado FG, Kim AS. Hemophagocytic lymphohistiocytosis: an update on diagnosis and pathogenesis. Am J Clin Pathol 2013;139:713–27. [DOI] [PubMed] [Google Scholar]
- [2].Canna SW, Behrens EM. Making sense of the cytokine storm: a conceptual framework for understanding, diagnosing, and treating hemophagocytic syndromes. Pediatr Clin North Am 2012;59:329–44. [DOI] [PMC free article] [PubMed] [Google Scholar]
- [3].Schulert GS, Grom AA. Macrophage activation syndrome and cytokine-directed therapies. Best Pract Res Clin Rheumatol 2014;28:277–92. [DOI] [PMC free article] [PubMed] [Google Scholar]
- [4].Ishii E. Hemophagocytic lymphohistiocytosis in children: pathogenesis and treatment. Front Pediatr 2016;4:47. [DOI] [PMC free article] [PubMed] [Google Scholar]
- [5].Weaver LK, Behrens EM. Hyperinflammation, rather than hemophagocytosis, is the common link between macrophage activation syndrome and hemophagocytic lymphohistiocytosis. Curr Opin Rheumatol 2014;26:562–9. [DOI] [PMC free article] [PubMed] [Google Scholar]
- [6].Tothova Z, Berliner N. Hemophagocytic syndrome and critical illness: new insights into diagnosis and management. J Intensive Care Med 2015;30:401–12. [DOI] [PMC free article] [PubMed] [Google Scholar]
- [7].Campo M, Berliner N. Hemophagocytic lymphohistiocytosis in adults. Hematol Oncol Clin North Am 2015;29:915–25. [DOI] [PubMed] [Google Scholar]
- [8].Schram AM, Berliner N. How I treat hemophagocytic lymphohistiocytosis in the adult patient. Blood 2015;125:2908–14. [DOI] [PubMed] [Google Scholar]
- [9].Glaudemans AW, de Vries EF, Galli F, et al. The use of (18)F-FDG-PET/CT for diagnosis and treatment monitoring of inflammatory and infectious diseases. Clin Dev Immunol 2013;2013:623036. [DOI] [PMC free article] [PubMed] [Google Scholar]
- [10].Meller J, Sahlmann CO, Scheel AK. 18F-FDG PET and PET/CT in fever of unknown origin, Journal of nuclear medicine: official publication. Soc Nucl Med 2007;48:35–45. [PubMed] [Google Scholar]
- [11].Ahn SS, Hwang SH, Jung SM, et al. Evaluation of spleen glucose metabolism using 18F-FDG PET/CT in patients with febrile autoimmune disease. J Nucl Med 2017;58:507–13. [DOI] [PubMed] [Google Scholar]
- [12].Ravelli A, Minoia F, Davi S, et al. 2016 Classification criteria for macrophage activation syndrome complicating systemic juvenile idiopathic arthritis: a European League Against Rheumatism/American College of Rheumatology/Paediatric Rheumatology International Trials Organisation Collaborative Initiative. Ann Rheum Dis 2016;75:481–9. [DOI] [PubMed] [Google Scholar]
- [13].Ravelli A, Minoia F, Davi S, et al. 2016 Classification criteria for macrophage activation syndrome complicating systemic juvenile idiopathic arthritis: a European League Against Rheumatism/American College of Rheumatology/Paediatric Rheumatology International Trials Organisation Collaborative Initiative. Arthritis Rheumatol 2016;68:566–76. [DOI] [PubMed] [Google Scholar]
- [14].Fardet L, Galicier L, Lambotte O, et al. Development and validation of the HScore, a score for the diagnosis of reactive hemophagocytic syndrome. Arthritis Rheumatol 2014;66:2613–20. [DOI] [PubMed] [Google Scholar]
- [15].Loftus RM, Finlay DK. Immunometabolism: cellular metabolism turns immune regulator. J Biol Chem 2016;291:1–0. [DOI] [PMC free article] [PubMed] [Google Scholar]
- [16].Pecqueur C, Oliver L, Oizel K, et al. Targeting metabolism to induce cell death in cancer cells and cancer stem cells. Int J Cell Biol 2013;2013:805975. [DOI] [PMC free article] [PubMed] [Google Scholar]
- [17].Moon SH, Hyun SH, Choi JY. Prognostic significance of volume-based PET parameters in cancer patients. Korean J Radiol 2013;14:1–2. [DOI] [PMC free article] [PubMed] [Google Scholar]
- [18].Yamashita H, Kubota K, Mimori A. Clinical value of whole-body PET/CT in patients with active rheumatic diseases. Arthritis Res Ther 2014;16:423. [DOI] [PMC free article] [PubMed] [Google Scholar]
- [19].Cron RQ, Davi S, Minoia F, et al. Clinical features and correct diagnosis of macrophage activation syndrome. Expert Rev Clin Immunol 2015;11:1043–53. [DOI] [PubMed] [Google Scholar]
- [20].Ruscitti P, Cipriani P, Ciccia F, et al. Prognostic factors of macrophage activation syndrome, at the time of diagnosis, in adult patients affected by autoimmune disease: analysis of 41 cases collected in 2 rheumatologic centers. Autoimmun Rev 2017;16:16–21. [DOI] [PubMed] [Google Scholar]
- [21].Schulert GS, Grom AA. Pathogenesis of macrophage activation syndrome and potential for cytokine-directed therapies. Ann Rev Med 2015;66:145–59. [DOI] [PMC free article] [PubMed] [Google Scholar]


