


Abstract
We describe a novel and highly sensitive method for the differential display of mRNAs, called ADDER (Amplification of Double-stranded cDNA End Restriction fragments). The technique involves the construction and PCR amplification of double-stranded cDNA restriction fragments complementary to 3′-terminal mRNA sequences. Aliquots of these cDNA fragments are then amplified by touchdown PCR with 192 pairs of display primers (16 upstream primers and 12 downstream primers) that differ in their ultimate and penultimate nucleotides and the PCR products are compared by size-fractionation on urea–polyacrylamide sequencing gels. By using the ADDER technology for the comparison of liver RNAs harvested at different times around the clock we detected nearly 300 cDNA fragments complementary to mRNAs with circadian accumulation profiles and sequenced 51 of them. The majority of these cDNAs correspond to genes which were not previously known to be rhythmically expressed. A large fraction of the identified genes encoded factors involved in the processing and detoxification of nutrients. This suggests that a primary purpose of circadian transcription in the liver is the anticipation of food processing and detoxification. Several genes involved in human disease were also identified, including the one encoding presenilin II, a protein implicated in the development of Alzheimer’s Disease.
INTRODUCTION
In the hope of gaining more insight into the physiological purpose of circadian liver gene expression, we wished to establish a large repertoire of cyclically expressed hepatic mRNAs. Previous attempts using the selective amplification via biotin- and restriction-mediated enrichment (SABRE) subtractive hybridization technique revealed only a few new rhythmically expressed transcripts (1), probably because rare mRNA sequences were lost in the course of the multiple rounds of selection. In fact, all hybridization-based procedures face inherent problems in the detection of low abundance transcripts, because Cot values (defined as the initial concentration of single-stranded nucleic acids multiplied by the time of hybridization) required for the complete hybridization of such transcripts are difficult to reach (reviewed in 2). The DNA microarray hybridization procedure, another hybridization-based approach, has been successfully used in the detection of differentially expressed genes in a number of systems (3,4). However, this method also has its shortcomings. Thus, DNA microarrays representing all expressed genes are available for only a few organisms and robust hybridization signals are difficult to obtain for very rare mRNAs. Yet, as discussed in the following paragraph, many if not most genes active in a given mammalian cell type produce transcripts contributing less than 3 × 10⁻⁵ parts to the total mRNA population.
Serial analysis of gene expression (SAGE) (5) does not suffer from the limitations encountered with hybridization-based methods. However, its application is limited to laboratories with access to automated high throughput DNA sequencing facilities. For example, SAGE profiling of the human liver transcriptome revealed that 4% of the 8598 detected mRNA species accounted for nearly 60% of the 30 982 collected sequence tags (6). A large fraction of the 8598 different transcripts only provided a single sequence tag. Therefore, many, if not most, mRNAs expressed in liver may contribute less than 3 × 10⁻⁵ parts to the total mRNA population. A reliable comparison of such non-abundant transcripts in multiple mRNA populations would require the sequencing of millions of sequence tags.
Differential mRNA display, a procedure invented by Liang and Pardee (7), has been used successfully in many laboratories for the identification of differentially expressed mRNAs. It relies on the RT–PCR amplification of cDNAs complementary to 3′-terminal mRNA sequences and the display of the RT–PCR products on high resolution gels. In the original methods, the upstream primers are 10mers with arbitrarily designed sequences and the downstream primers contain 11 Ts in addition to the two nucleotides complementary to the ultimate and penultimate nucleotides of the mRNA. In our hands this method yielded satisfactory results for abundant and moderately abundant transcripts, but failed to provide reproducible patterns for rare cDNA fragments. Conceivably, the low input of template cDNA (7) and the inefficient initial priming with the imperfectly matched 10mer primers may have precluded a statistical sampling for rare cDNA species.
Here we describe a protocol for the differential display of mRNA sequences that overcomes some of the problems encountered with the original method. This method, called ADDER (Amplification of Double-stranded cDNA End Restriction fragments), involves the construction and amplification of double-stranded (ds) cDNA restriction fragments complementary to the 3′-terminal moieties of mRNAs. We used this technology for the identification of liver genes with circadian gene expression and demonstrate that mRNAs that accumulate to less than 10 copies/hepatocyte (<10–5 of mRNA population) can be isolated and identified by this procedure. The ADDER display has revealed ∼280 candidate cDNA fragments for rhythmically expressed genes, of which 51 have been cloned and sequenced.
MATERIALS AND METHODS
Animals and materials
C57BL/6 X 129/SV mice were housed under a 12 h light/12 h dark (LD) regimen (lights on at 0700, lights off at 1900) or kept in constant darkness (DD) for at least 48 h before they were sacrificed.
The modified and unmodified oligodeoxyribonucleotides were purchased from Microsynth (Balgach, Switzerland). The sources of the various enzymes used for the ADDER procedure are given in parentheses: restriction enzymes (Amersham, New England Biolabs), ribonuclease H-free reverse transcriptase (USB), T4 ligase (USB), T7 and T3 RNA polymerases (Biofinex), TAQ polymerase (our laboratory). Streptavidin-coated Dynabeads“ M-280 were purchased from Dynal.
RNA isolation and synthesis of ds cDNA
Whole cell RNA and polyadenylated RNA was isolated as described (8,9). ds cDNA was synthesized essentially according to Gubler (10), using 5 µg whole cell RNA or 1 µg polyadenylated RNA as template. These RNA templates were incubated with 0.5 µg anchor primer [5′-biotin-ATTGGCGCGCCTAAGCTTTTTTTTTTTTV-3′ (V = A, G or C)] in a total volume of 11.5 µl (completed with water) at 70°C for 5 min, cooled on ice and mixed with 12.5 µl of 2× first strand buffer (100 mM Tris–Cl pH 8.3, 150 mM KCl, 6 mM MgCl2, 20 mM DTT, 1 mM dNTPs). This cocktail was preincubated at 37°C for 2 min before 40 U (1 µl) of RNase H-free MMLV reverse transcriptase was added. First strand cDNA synthesis was then allowed to proceed for 60 min at 37°C and the tube was placed on ice. For second strand cDNA synthesis, the 25 µl reaction was diluted in a total of 160 µl of 1× second strand buffer [20 mM Tris–Cl pH 7.9, 5 mM MgCl2, 10 mM (NH4)2SO4, 100 mM KCl, 50 µg/ml BSA], containing 2.25 U RNase H and 60 U DNA polymerase 1. This reaction mix was incubated for 60 min at 12°C followed by a further 60 min incubation at 22°C. Enzymes were then inactivated by the addition of EDTA (0.02 M final concentration) and a 10 min heating step at 70°C.
Generation and amplification of 3′ cDNA end restriction fragments
For the adsorption of biotinylated ds cDNA to streptavidin microbeads, 70 µl reaction mix containing ds cDNA (see above) was incubated in a 500 µl cocktail containing 20 mM Tris–Cl pH 8, 10 mM EDTA, 200 mM NaCl and 50 µl of streptavidin-coated beads that had been previously washed twice in 500 µl TENT 1 M (10 mM Tris–Cl pH 8, 0.1 M EDTA, 1 M NaCl, 0.1% Triton X-100). cDNA adsorption to the microbeads was allowed to proceed for 2 h at room temperature with constant agitation. After adsorption, the beads were washed twice with 500 µl TENT 1 M and once in 500 µl of 1× MboI digestion buffer (10 mM Tris pH 7.5, 10 mM MgCl2,1 mM DTT, 50 mM NaCl, 0.1 mg/ml BSA). The beads were then resuspended in 100 µl 1× MboI digestion buffer containing 20 U MboI and incubated for 90 min at 37°C with constant gentle shaking.
After digestion, the beads were washed three times in 300 µl ligation buffer (67 mM Tris–Cl pH 7.6, 10 mM DTT, 6.7 mM MgCl2, 33 µg/ml BSA). The immobilized 3′-terminal MboI cDNA fragments were then ligated to 2 µg of a double-stranded adapter (obtained by the annealing of the oligonucleotides 5′-OH-GGTCCATCCAACC-OH-3′ and 3′-OH-GCCAGGTAGGTTGGCTAG-PO4-5′) in 30 µl 1× ligation buffer, containing 66 µM ATP and 15 U T4 ligase, for 16–24 h at 16°C. The beads were then washed three times with 500 µl TENT 1 M and once with 300 µl digestion buffer (50 mM potassium acetate, 20 mM Tris–acetate pH 7.9, 10 mM magnesium acetate, 1 mM DTT, 0.01% Triton X-100, 0.1 mg/ml BSA) and the 3′-terminal ds cDNA MboI fragments (containing adapter sequences) were released from the beads by digestion with AscI (20 U) in 100 µl of digestion buffer (20mM Tris-acetate pH 7.9, 10 mM Mg acetate, 50 mM K acetate, 1 mM DTT) at 37°C for 2 h.
PCR amplification of the 3′-terminal MboI cDNA fragments
A master stock of ds 3′-terminal cDNA MboI restriction fragments was obtained by PCR amplification of the material released from the streptavidin beads by AscI digestion. To this end, preliminary PCR trials with 2.5 µl cDNA per 50 µl reaction mix were performed to evaluate the minimal number of PCR cycles required to yield a sufficient amount of cDNA templates for the differential display. The PCR reaction was performed in a cocktail containing 50 mM Tris–Cl pH 9.2, 16 mM (NH4)2SO4, 1.75 mM MgCl2, 5% DMSO, 0.2 mM dNTPs, 2 U Taq polymerase/50 µl reaction and 1 µM of each of the two primers 5′-GGTCCATCCAACCGATC-3′ and 5′-ATTGGCGCGCCTAAGCTT-3′, using a Stratagene Robocycler“ and the following temperature cycles: 1 min at 95°C, 1 min 50 s at 52°C and 2 min 30 s at 72°C. Between 15 and 25 cycles were tested by examining 10 µl of the PCR products by electrophoresis on a 2% agarose gel. We found that 19 cycles gave reproducible PCR products in the range of 100–1000 bp. Higher numbers of PCR cycles frequently resulted in a smear emanating from the well of the agarose gel.
After the optimal number of cycles had been determined, large-scale amplification was performed using 25 µl cDNA in a total volume of 500 µl, which was subdivided into five tubes each containing 100 µl. In parallel, a 50 µl PCR reaction containing 32P-labeled dATP (µCi/mM) was carried out under identical conditions and the radiolabeled PCR products were displayed on 5% sequencing gels in order to compare the qualities of the cDNAs obtained from various RNA populations (Fig. 2).
Figure 2.
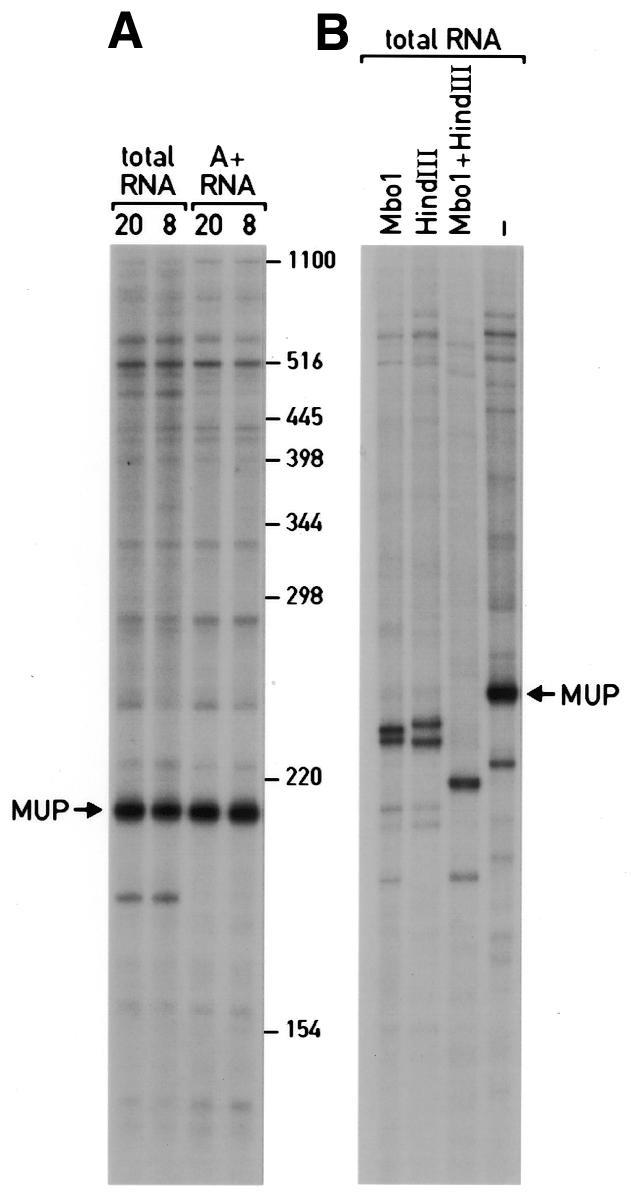
Analysis of cDNA master stocks. (A) ds cDNA 3′ MboI fragments were prepared from 1 µg polyadenylated (A+) RNAs or 5 µg total liver RNAs harvested at 2000 or 0800. ds cDNA fragments were constructed according to Figure 1, steps 1–6 and separated on 5% urea–polyacrylamide gels, alongside size markers whose positions are indicated at the right hand side. The most abundant cDNA fragment, migrating at ∼210 nt, is complementary to major urinary protein (MUP) mRNA (data not shown). (B) Digestion products generated by the digestion of ds cDNA (total RNA, 0800; A) with the restriction endonucleases MboI, HindIII or both. MboI removes the upstream primer and generates a 4 nt 5′-overhang on the coding strand, thus producing two strands differing in length by 4 nt. HindIII removes the downstream primer and generates a 4 nt 5′-overhang on the non-coding strand. Double digestion with MboI and HindIII removes both primers and leaves 4 nt 5′overhangs on both strands, thus generating two strands with identical lengths for each species. These digestion products can readily be discriminated by electrophoresis of digestion products of abundant cDNA species, such as the MUP cDNA fragment migrating at 210 nt in the non-digested sample (A).
To obtain a master stock, the unlabeled PCR products obtained in the large scale preparation were extracted once with phenol–chloroform, precipitated with 0.1 vol 5 M NaCl and 0.7 vol isopropanol and resuspended in TE (10 mM Tris–Cl pH 8, 1 mM EDTA) at a final concentration of 100 ng/µl. For the following PCR amplification with display primers it is crucial that all of the master stocks have the same DNA concentration in order to assure that the differential display products are directly comparable after electrophoresis on sequencing gels.
Differential display of amplified 3′-terminal cDNA fragments
For the ADDER differential display, 5 ng cDNA aliquots of the master stocks (see above) were amplified by touchdown PCR (11) in 50 µl reactions containing 50 mM Tris–Cl pH 9.2, 16 mM (NH4)2SO4, 1.75 mM MgCl2, 5% DMSO, 0.2 mM dNTPs, 1 µCi [α-32P]dATP, 2 U Taq polymerase and 1 µM each primer. The following PCR program was used:
1 min 95°C, 2× (1 min 95°C, 1 min 50 s 54°C, 2 min 30 s 72°C), 2× (1 min 95°C, 1 min 50 s 52°C, 2 min 30 s 72°C), 2× (1 min 95°C, 1 min 50 s 50°C, 2 min 30 s 72°C) 2× (1 min 95°C, 1 min 50 s 48°C, 2 min 30 s 72°C], 2× (1 min 95°C, 1 min 50 s 46°C, 2 min 30 s 72°C), 10× (1 min 95°C, 1 min 50 s 44°C, 2 min 30 s 72°C). The upstream and downstream display primers had the general sequence 5′-AACCGATCN1N2-3′ (where N1 and N2 can be either G, A, T or C) and 5′-AGCTTTTTTTTTTTTVN-3′ (where V is either G, A or C and N is either G, A, T or C), respectively. Thus, with 16 different upstream primers and 12 different downstream primers a total of 192 primer combinations can be used for the differential display of cDNAs.
For unknown reasons, the upstream primer whose N1N2 were CA or CG did not efficiently amplify the cDNA fragments under the conditions described above. This problem could be overcome by the use of 12mers instead of 10mers (see Table 1). Another upstream primer that caused problems was the one containing Gs at its penultimate and ultimate position, probably because this primer possesses an 8 base palindrome (5′-AACCGATCGG-3′), which may allow self-annealing and hence primer amplification. This problem could be solved by using a slightly modified primer (5′-CCAACGGATCGG-3′). All three of these modified primers yielded satisfactory results under the PCR conditions mentioned above. The sequences of the 28 primers required for the comprehensive display of the master cDNA stocks are listed in Table 1.
Table 1. List of the primers required for the ADDER cDNA display.
| |
Upstream primers (5′→3′) |
|
Downstream primers (5′→3′) |
| 1 |
CCAACGGATCGGa |
17 |
AGCTTTTTTTTTTTTGG |
| 2 |
AACCGATCGA |
18 |
AGCTTTTTTTTTTTTAA |
| 3 |
AACCGATCGT |
19 |
AGCTTTTTTTTTTTTCT |
| 4 |
AACCGATCGC |
20 |
AGCTTTTTTTTTTTTGC |
| 5 |
AACCGATCAG |
21 |
AGCTTTTTTTTTTTTAG |
| 6 |
AACCGATCAA |
22 |
AGCTTTTTTTTTTTTCA |
| 7 |
AACCGATCAT |
23 |
AGCTTTTTTTTTTTTGT |
| 8 |
AACCGATCAC |
24 |
AGCTTTTTTTTTTTTAC |
| 9 |
AACCGATCTG |
25 |
AGCTTTTTTTTTTTTCG |
| 10 |
AACCGATCTA |
26 |
AGCTTTTTTTTTTTTGA |
| 11 |
AACCGATCTT |
27 |
AGCTTTTTTTTTTTTAT |
| 12 |
AACCGATCTC |
28 |
AGCTTTTTTTTTTTTCC |
| 13 |
CCAACCGATCCG |
|
|
| 14 |
CCAACCGATCCA |
|
|
| 15 |
AACCGATCCT |
|
|
| 16 | AACCGATCCC |
aThis primer was modified to prevent self-annealing, as described in Materials and Methods.
Radiolabeled PCR products were displayed on 5% sequencing gels and examined for differentially expressed gene products (Fig. 3).
Figure 3.

Differential display of 3′-terminal ds cDNA fragments. Aliquots of ds cDNA libraries were amplified with the display primers shown and size-fractionated on a 5% urea–polyacrylamide gel alongside size markers (left hand side). The times at which the animals were sacrificed to prepare liver RNA are given at the top. The autoradiography was exposed for 72 h at room temperature without an intensifier screen. The positions of cDNA fragments that were cloned and sequenced are indicated by arrows. All of the mRNAs complementary to these cDNAs showed circadian accumulation profiles, when examined by northern blot hybridization or ribonuclease protection assays (Fig. 5 and data not shown). One of the cloned cDNA fragments, GNCLP (indicated by a white arrowhead), was used to examine the sensitivity and priming specificity of the ADDER method (Figs 5 and 6). Several additional fragments for potentially circadian mRNAs can be seen in the autoradiograph; however, these fragments have not yet been cloned and the corresponding mRNAs have thus not been examined for cyclic accumulation by northern blot or RNase protection assays.
Representation of mRNAs in the ADDER cDNA population
The differential display is restricted to cDNA fragments encompassing ∼50–1200 nt (Figs 2 and 3). Assuming that each nucleotide is equally abundant in the mRNA 3′ moiety and neglecting the very small fraction of ds cDNAs containing an AscI site downstream of the most 3′-proximal MboI site, the probability of a cDNA containing a MboI site (frequency = 1/44) within these limits is [(255/256)50 – (255/256)1200] = ∼0.8. Therefore, in theory, ∼80% of all 3′-terminal mRNA sequences should be represented in the ds cDNA library.
Cloning and analysis of cDNA end fragments
The region of the gel (dried without fixation) containing the fragment of interest was excised with a scalpel from both the lanes showing maximal and minimal expression. The gel pieces were soaked in 150 µl water and boiled for 20 min to elute the DNA. Aliquots (2.5 µl) were then amplified by PCR with the corresponding full-length upstream primer (5′-GGTCCATCCAACCGATCN1N2-3′) and downstream primers (5′-ATTGGCGCGCCTAAGCTTTTTTTTTTTTVN-3′) to restore the AscI site. PCR reactions (50 µl) were as described above, but with a 44°C annealing temperature for the first two cycles and a 60°C annealing temperature for the following 18 cycles. The products were digested to completion with MboI and AscI, purified by agarose gel electrophoresis and cloned into a modified pKS plasmid vector, containing an AscI site between the EcoRV and EcoRI sites. To identify bacterial colonies with recombinant plasmids containing the differentially expressed cDNA fragments, the inserts from multiple individual colonies were PCR-amplified and digested with different combinations of frequently cutting restriction enzymes. The digests were run on 3% agarose gels alongside restriction digests of PCR-amplified DNA obtained from the gel eluates (see above). Cloned cDNA fragments with a restriction pattern identical to that of the most abundant cDNA species seen in PCR products from gel eluates were kept for further analysis.
cDNA fragments complementary to mRNAs with circadian expression were sequenced and their sequences were used in a BLAST search (12) in DNA databases or the mouse EST database (GenBank).
RESULTS
Experimental design of the ADDER differential mRNA display method
The eight experimental steps of the ADDER procedure are schematically outlined in Figure 1. Polyadenylated mRNA was reverse transcribed into single-stranded (ss) DNA, using a biotinylated oligonucleotide primer harboring sites for the restriction endonucleases AscI and HindIII (in bold), 12 Ts and a 3′-terminal V (A, G or C). The RNA–DNA heteroduplexes were then converted into dsDNA, which were adsorbed to streptavidin beads. After digestion with MboI, the immobilized ds cDNA fragments were ligated to adapter sequences carrying a 5′-GATC overhang. cDNA fragments were released from the beads by digestion with AscI and amplified using the appropriate upstream and downstream primers. Aliquots of the amplified cDNA master stock were then amplified by touchdown PCR, using combinations of the 16 upstream primers and 12 downstream primers shown in Table 1.
Figure 1.

Schematic outline of the ADDER display technology. For explanations see text.
Generation of a cDNA master stock
Initially, we prepared four independent ds cDNA end restriction fragment libraries (Fig. 1, steps 1–6) and compared their quality by size fractionation on urea–polyacrylamide gels (Fig. 2A). Two of these libraries were constructed using total RNA of animals sacrificed at 2000 or at 0800 hours as templates, and two using polyadenylated mRNAs (A+ RNA) as templates that were purified from total RNA by oligo dT cellulose chromatography. Gel electrophoresis of these cDNA libraries revealed numerous bands (Fig. 2A), supposedly representing the most abundant mRNA species, superimposed on a heterogeneous distribution of cDNA fragments in the size range of ∼60–1200 nt. With one exception, the relative intensities of the abundant mRNA species appeared to be similar for all four cDNA pools, irrespective of whether total or polyadenylated RNAs served as templates. One cDNA species, migrating at ∼180 nt, was only detected in the two preparations obtained with whole cell RNA as templates. As purification of polyadenylated RNA is labor-intensive and may result in the loss of some mRNA species, we decided to use whole cell RNA in further experiments.
Digestion of the ds cDNA fragments with MboI, HindIII or both, and analysis of the digestion products by gel electrophoresis (Fig. 2B) confirmed that the cDNAs have the architecture expected on the basis of the experimental design depicted in Figure 1.
Display of ds cDNA
The upstream and downstream primers required for a complete display with 192 primer pairs are listed in Table 1. In order to increase the specificity of priming, we used touchdown PCR (11) and relatively short display primers for the display of ds cDNA subpopulations. In pilot experiments we showed that shortening of the display primers indeed reduces unspecific priming significantly (data not shown). This was expected, as the two variable nucleotides contribute a higher fraction of binding energy in the annealing of short as compared to long primers. As ds cDNAs are used as templates, the touchdown PCR assays can be assembled at room temperature and do not require a ‘hot start’, as the priming can only initiate once the temperature has reached the melting temperature (Tm) of the template.
Figure 3 shows cDNA display patterns obtained with 11 different primer pairs for liver mRNAs prepared at 8 h intervals around the clock (0800, 1600 and 2400). The visual inspection of the various banding patterns suggested that most mRNAs were expressed at similar levels throughout the day. However, a few cDNA species were more prevalent at certain times of day, indicating that they were complementary to mRNAs with circadian accumulation. A number of such cDNA fragments (Fig. 3, some marked by arrows) were cloned, sequenced and used as probes in northern blot hybridizations or RNase protection assays to monitor the temporal accumulation of their cognate mRNAs. Indeed, most of the transcripts complementary to the cloned cDNAs turned out to be subject to circadian regulation with amplitudes of 2–20-fold or greater. Some of the protein products of cyclically expressed mRNAs discovered by the ADDER technique are listed in Table 2.
Table 2. Liver gene products with circadian expression identified by the ADDER procedure.
| Name |
Function |
GenBank |
Cellular localization |
Peak expression |
|
Detoxification/stress
response |
|
|
|
|
| Putative ortholog of rat cyp2c22 |
Detoxification of xenobiotics |
AW413095 |
Microsomes |
2000 |
| Coumarin hydroxylase |
Coumarin detoxification |
AW113388 |
Microsomes |
2000 |
| Glutamate-cysteine ligase |
Glutathione biosynthesis |
U85498 |
Cytosol |
0400 |
| Aminolevulinate synthase |
Heme biosynthesis |
M63245 |
Cytosol |
2000 |
|
S-adenosyl-l-methionine synthetase |
S-adenosyl-l-methionine synthesis |
L13622 |
Cytosol |
2400 |
| Carboxylesterase ES male |
Detoxification of xenobiotics |
L11333 |
Microsomes |
2000 |
| NCPR |
P450-enzyme reduction |
NM_008898 |
Microsomes |
2000 |
| Glucose regulated protein |
Chaperone |
D78645 |
Cytosol |
2000 |
| HSC73 |
Chaperone |
U27129 |
Cytosol |
2000 |
| Microsomal glutathione-S transferase |
Membrane protection |
J03752 |
Microsomes |
0800 |
|
General metabolism |
|
|
|
|
| Testosterone hydroxylase |
Steroid metabolism |
NM_009997 |
Microsomes |
2000 |
| Cholesterol 7-α hydroxylase |
Bile acid synthesis |
NM_012942 |
Microsomes |
2000 |
| PEPCK |
Neoglucogenesis |
AF009605 |
Cytosol |
1600 |
| Serine dehydratase |
Serine catabolism |
J03863 |
Cytosol |
1600 |
| Probable amino acid transporter |
Amino acid transport? |
AW536614 |
Plasma membrane? |
1600 |
| Liver-type glucose transporter |
Passive glucose transport |
X15684 |
Plasma membrane |
1600 |
| Long chain fatty acyl coA ligase |
Fatty acid metabolism |
D90109 |
Cytosol |
2400 |
| Peroxysomal long chain acyl coA-thioesterase
1a |
Fatty acid metabolism |
AAF13873 |
Peroxisomes |
2000 |
| SPOT 14 |
Regulator of lipogenesis |
K01934 |
Nucleus |
2000 |
| Protein related to spot 14 |
Transcription regulator? |
AI195877 |
Nucleus? |
2400 |
| GNCLP |
Sugar transport? |
AI787285 |
Plasma membrane? |
2000 |
| Probable ethanolamine kinase |
Phospholipid metabolism? |
AI131623 |
? |
2000 |
| Insulin receptor Y-kinase substrate
homolog |
Signal transduction? |
AW108024 |
? |
2000 |
| Uridine phosphorylase homolog |
Uridine catabolism? |
AA250708 |
Cytosol? |
1600–2000 |
|
Serum proteins |
|
|
|
|
| Contrapsin |
Protease inhibitor |
D00725 |
Serum |
2000 |
| Murinoglobulin homolog |
Protease inhibitor? |
AA288042 |
Serum? |
0800 |
| Corticosterone binding globulin |
Hormone transporter |
NM_007618 |
Serum |
1600 |
| Fibrinogen/angiopoietin-related
protein |
? |
NM_020581 |
Serum |
1600 |
| IGF-binding protein 1 |
Hormone transporter |
NM_008341 |
Serum |
1600 |
|
Other or uncharacterized
functions |
|
|
|
|
| DBP |
Transcription factor |
U29762 |
Nucleus |
1600 |
| TIS7 interferon-related developmental
regulator |
? |
NM_013562 |
? |
1600 |
| Presenilin 2 |
Notch signal transduction / alzheimer disease |
NM_011183 |
Membranes |
0400 |
| SK2 |
Potassium channel |
AF239613 |
Plasma membrane |
1600 |
| Protein related to DEPP |
Decidual protein induced by progesterone |
AA060103 |
? |
1200 |
| Pentylene tetrazole induced cDNA
(Ptz-17) |
Seizure related |
D45203 |
? |
2000 |
|
N-acetyltransferase
camello-2 |
? |
AI182075 |
Membrane? |
2400 |
| DP1-like1 |
? |
AB039933 |
? |
1600–2400 |
| MMLV40 reverse transcriptase |
Viral protein |
BE635010 |
? |
2400 |
| 58 kDa PKR inhibitor |
Kinase inhibitor |
AI047835 |
Cytosol |
2400–0400 |
| g0s2 homolog |
? |
AI606571 |
? |
0400 |
| Probable FLJ10276 ortholog |
? |
AW824670 |
? |
1600–2000 |
| Unknown putative transmembrane
protein |
? |
AW487825 |
? |
2400–0400 |
| Protein related to KIAA0977 protein |
? |
Mm.34159 |
? |
1600 |
| Adipose differentiation-related
protein |
? |
NM_007408 |
? |
0400 |
| Probable TIG1 ortholog |
? |
AI662122 |
Membrane? |
1600 |
| Unknown EST |
? |
W29363 |
? |
2000 |
| Unknown EST |
? |
BB277938 |
? |
2400 |
| Unknown EST |
? |
AA571276 |
? |
2400 |
| Unknown EST |
? |
AA243904 |
? |
0800 |
| Unknown EST |
? |
AU067703 |
? |
0400 |
| Unknown EST | ? | AI426499 | ? | 1600–2000 |
Liver RNA was prepared from animals sacrificed at 0800, 1600 and 2400 and used as a template for the ADDER display. Fifty-one differentially expressed cDNA fragments were cloned and sequenced. ESTs or published cDNA sequences were found for all of them and the proteins encoded by the corresponding mRNAs are listed. Two cDNA fragments of different size were detected for spot14, uridine phosphorylase homolog and DBP and three fragments were recovered for contrapsin. Presumably, these cDNA species correspond to transcripts cleaved and polyadenylated at multiple alternative polyadenylation sites. The circadian accumulation profiles were determined for all of the listed species using RNase protection assays or northern blot hybridization at 4 h intervals around the clock (at 0400, 0800, 1200, 1600, 2000 and 2400). The times at which zenith levels were observed are given under ‘peak expression’. The ratios between zenith and nadir levels of the listed species vary between 2 and >20.
A major advantage of differential cDNA display methods is the possibility to compare many different mRNA populations simultaneously. This is demonstrated by the data presented in Figure 4. In this experiment, a total of 12 liver whole cell RNA samples were compared by ADDER employing the primer pair 5′-AACCGATCTC-3′ and 5′-AGCTTTTTTTTTTTTCC-3′. These RNAs were harvested at 4 h intervals around the clock (at 0800, 1200, 1600, 2000, 2400 and 0400) from wild-type mice and Dbp knockout mice. Dbp encodes a basic leucine zipper transcription factor that accumulates according to a robust circadian rhythm in most tissues, reaching zenith and nadir values at 1600 and 0400, respectively (13). Based on the known sequence of murine Dbp mRNA, the two primers used in this display should amplify a Dbp cDNA 3′-fragment encompassing 621 bp (including the two display primers). As expected, a fragment corresponding to this size was observed exclusively in the RNA samples obtained from wild-type animals at 1200, 1600 and 2000. Moreover, the relative abundance of this cDNA fragment was highest at 1600. Cloning and sequencing of this fragment confirmed its identity as the 3′-terminal Dbp cDNA segment. An additional 3′-terminal Dbp cDNA fragment spanning 510 bp was obtained with the same upstream primer and a different downstream primer (5′-AGCTTTTTTTTTTTTCT-3′). Presumably this fragment corresponds to a Dbp mRNA species that is cleaved and polyadenylated at an alternative site upstream of the major polyadenylation site (data not shown).
Figure 4.

Simultaneous comparison of 12 mRNA samples.Twelve ds cDNA libraries were prepared against whole cell RNAs from wild-type (WT) and Dbp knockout (KO) mice sacrificed at 4 h intervals around the clock. Aliquots of these templates were amplified with the display primer pair 5′-AACCGATCTC-3′ and 5′-AGCTTTTTTTTTTTTCC-3′ and the products were analyzed as described in Figure 3. Each RNA sample contains RNA from three to five mice. The times at which the animals were sacrificed are indicated at the top of each panel and the positions of the size markers are depicted on the left. The fragment indicated by the arrow on the right has been identified as Dbp cDNA by cloning and sequencing. As expected, this fragment can only be observed in RNAs from WT animals sacrificed at 1200, 1600 and 2000.
Sensitivity and specificity of the ADDER differential display method
Figure 5A displays the daily accumulation profile of the mRNA complementary to cDNA fragment indicated by a white arrowhead on Figure 3. Sequence analysis revealed that this mRNA encodes a hitherto unknown protein related to galactosides/Na+ cotransporters (Table 2). We thus called this protein GNCLP (Galactosides/Na+ Cotransporter-Like Protein). GNCLP mRNA levels oscillated with an amplitude of at least 20-fold during the day, reaching zenith and nadir levels ∼2000 and 1200 hours, respectively (Fig. 5B). In order to examine the sensitivity of the ADDER technique, we wished to determine the cellular GNCLP mRNA level at 1600 hours, when the GNCLP cDNA fragment can be readily detected in the cDNA display (Fig. 3). To this end, increasing amounts of unlabeled synthetic GNCLP pseudo-mRNA were mixed with a constant amount of whole cell liver RNA harvested at 1600 hours and the resulting RNA mixtures were subjected to ribonuclease protection assays with a radiolabeled GNCLP antisense RNA probe. Quantification of the signals depicted in Figure 5C revealed that GNCLP mRNA accumulated to 7.5 molecules/cell at 1600 hours.
Figure 5.
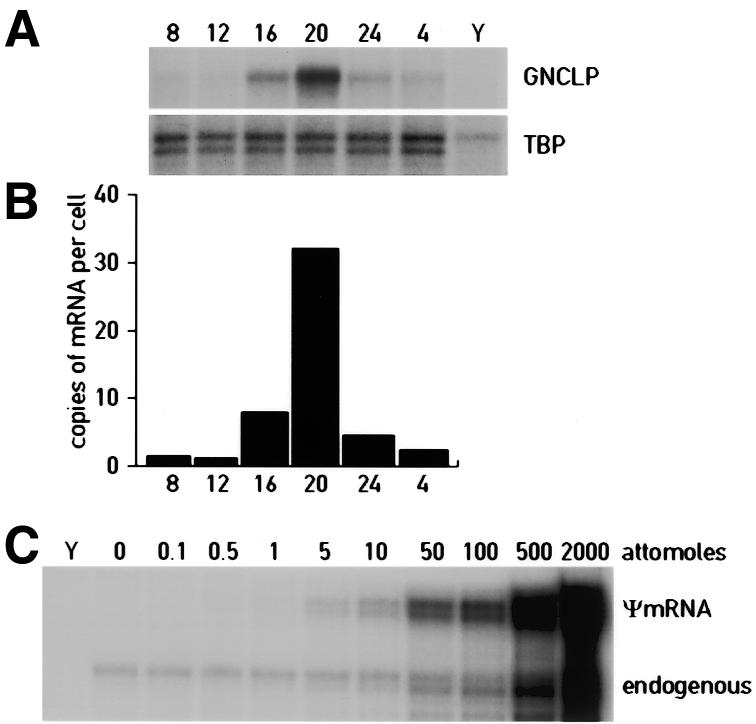
Circadian accumulation of GNCLP mRNA. (A) Aliquots (10 µg) of total liver RNAs harvested at 4 h intervals around the clock (times indicated at the top of each panel) were examined by ribonuclease protection assays for the presence of GNCLP mRNA. An antisense TATA-binding protein (TBP) RNA probe was included in these assays as a control for a constitutively expressed mRNA. In parallel, an RNase protection assay was performed with yeast RNA (Y) as a negative control. (B) The signals obtained for GNCLP mRNA (A) were quantified by phosphorimaging, normalized to TBP mRNA and converted to copies per cell. In this estimation, we took into consideration that a liver cell contains ∼50 pg total RNA. (C) Quantification of the cellular GNCLP mRNA concentrations present in liver at 1600 hours, the time at which the GNCLP cDNA fragment was observed in the cDNA display shown in Figure 3. Unlabeled sense RNA was prepared by transcribing the GNCLP cDNA plasmid, linearized by digestion with XhoI, with T7 RNA polymerase. Increasing amounts of this ψmRNA were mixed with 20 µg total liver RNA and the resulting mixtures were subjected to ribonuclease protection assays with a GNCLP antisense RNA probe. Quantification of the signals by phosphorimaging revealed that 20 µg total RNA contained ∼5 amol (3 × 10⁶ molecules) of GNCLP mRNA. Since one liver cell contains ∼50 pg total RNA, it can be estimated that GNCLP mRNA accumulates to about 7.5 copies/cell. Assuming that poly (A)+ mRNA amounts to 1.5 pg/liver cell and that the average length of liver mRNA is 1800 nt, GNCLP mRNA makes up ∼5 × 10⁻⁶ of all liver mRNAs at 1600 hours.
The GNCLP cDNA fragment was also used to evaluate the specificity of priming during the PCR amplification with display primers (Fig. 6). Aliquots of the cDNA master stock were PCR amplified using the display primer pairs indicated in Figure 6 and unlabeled dNTPs. Equal quantities of the PCR products were then size-fractionated on a 2% agarose gel and analyzed by Southern blot hybridization with a radiolabeled GNCLP cDNA probe. As shown in Figure 6, strong hybridization signals were observed with the PCR product obtained with the two perfectly matched display primers, while the signals obtained with the starting material were barely visible. When paired with a perfectly matched upstream primer, downstream primers containing one mismatch in the V and N positions still yielded some GNCLP cDNA fragments in the display PCR reaction. In contrast, PCR products obtained with a correct upstream primer and downstream primers with mismatches in both the V and the N position did not reveal detectable hybridization signals, similar to PCR products generated with mismatched upstream primers. On the basis of this comparison we deduced (i) that the amplification with perfectly matching display primers resulted in a dramatic enrichment of the corresponding cDNA fragments, and (ii) that the upstream primers contributed a higher priming specificity to the display PCR reaction than the downstream primers.
Figure 6.
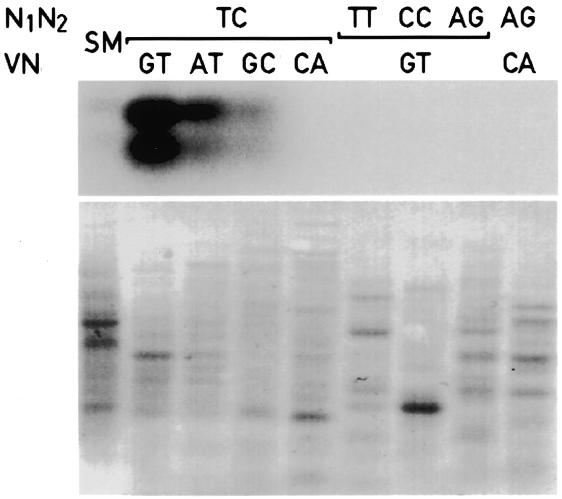
Specificity of priming in PCR reactions with display primers. Aliquots of the master stock starting material (SM) were amplified by touchdown PCR with general primers (Fig. 1, step 6) or the display primers indicated on top of the panel, using unlabeled dNTPs. Equal quantities (600 ng) of the resulting PCR products were analyzed by Southern blot analysis using radiolabeled GNCLP insert DNA as a probe (top). Before Southern blot hybridization, the membrane was colored with methylene blue (bottom), to visualize the various unlabeled cDNA preparations. We do not know why the GNCLP probe revealed two hybridizing bands, but the second band may represent ss GNCLP DNA.
The nature of circadian gene products
A visual inspection of the PCR reactions generated by all of the 192 display primers in two independent experiments revealed ∼280 candidates for rhythmically expressed mRNAs. Most of these mRNAs reach maximal levels during the activity period (i.e. the dark phase) of mice (Fig. 7). In order to get an idea about the nature of the rhythmically expressed mRNAs, cDNA fragments corresponding to some of these transcripts were cloned and sequenced. Table 2 shows the compilation of 51 cloned and sequenced cDNA fragments. For each of these cDNAs, the circadian expression of the cognate mRNA has been verified by either northern blot analysis or ribonuclease protection assays at 4 h intervals around the clock (Fig. 5A and data not shown). The majority of these mRNAs have not previously been known to accumulate in a circadian fashion. A sequence search of databases revealed at least one sequence with identity or similarity for each cloned cDNA insert. Several of the identified circadian gene products appear to be involved in energy homeostasis, food processing and detoxification. As expected for such a role, most of these mRNAs reached maximal values during the night, when these nocturnal animals feed.
Figure 7.

Phase angle of circadian liver mRNA accumulation. A display with 192 primer pairs revealed ∼280 candidate cDNA fragments for cyclically expressed mRNAs. y-axis, number of cDNA fragments corresponding to candidates for circadian mRNAs, x-axis: time windows at which peak levels were observed. Since only three time points were examined in the cDNA display, the transcripts with different phases were grouped as follows: 8–16, higher levels at 0800, or at 0800 and at 1600; 16–24, higher levels at 1600, or at 1600 and at 2400; 24–8, higher levels at 2400, or at 2400 and at 0800.
DISCUSSION
The ADDER technology is based on the general principle of the original mRNA display method (7), but similar to the TOGA display method (TOtal Gene expression Analysis) (14) includes the manipulation of ds cDNAs adsorbed to streptavidin microbeads. However, while TOGA requires 256 different primers, ADDER can be carried out with only 28 primers. Moreover, in contrast to TOGA, ADDER does not involve a cloning step before the differential PCR display reactions are carried out. Using one of the cloned sequences, we demonstrated that mRNAs present at less than 10 copies in liver cells can be identified and isolated by this technology.
Theoretically, ∼80% of all mRNA should be represented by a cDNA fragment in the cDNA library generated for the ADDER display technique. In reality, this percentage is likely to be lower, since some sequences may not be amplified efficiently or may be hidden on the display gels by similarly sized but more abundant cDNA fragments. Some of these limitations might be overcome by the parallel display of ds cDNA fragments generated with different frequently cutting restriction enzymes. Nevertheless, the large majority of fragments suggestive of differential expression based on the ADDER display showed similar differences in accumulation when tested by northern blot or RNase protection experiments in the RNAs used as templates for cDNA synthesis. Obviously, like all other techniques aimed at the identification of differentially expressed transcripts, ADDER also reveals differences not related to the biological question under examination. These include individual differences and polymorphisms in restriction sites and fragment length. These can be reduced to a minimum either by analyzing large pools of RNA samples or by conducting the display in parallel with several independent samples.
To ensure a statistical sampling of rare mRNA species, we used a relatively large RNA input in the initial reverse transcriptase reaction and amplified the cDNA fragment library before employing it in the display. This permits the use of relatively large amounts of template cDNA in each of the 192 PCR display reactions. Thus, in the 5 ng ds template DNA used in each display reaction, even cDNAs for mRNAs contributing only 10–5 parts to the entire population are still present at ∼105 copies.
The ADDER technology offers several advantages when compared to other gene expression profiling techniques. First, similar to the original differential cDNA display method it allows the simultaneous comparison of a large number of samples (Fig. 5). For the reasons described previously, this is not readily possible when using SAGE. Secondly, ADDER is highly sensitive and thus allows the identification of rare differentially expressed mRNA sequences (Fig. 6). Thirdly, ADDER does not require overly expensive equipment and chemicals, which renders the procedure accessible to all laboratories with standard molecular biology equipment.
The obvious shortcoming of the ADDER procedure is its relatively low throughput. While the complete display of 12 different mRNA populations, (2304 PCR reactions) can be accomplished by an experienced researcher in only 12 working days, the cloning and characterization of differentially expressed mRNA sequences may require months. However, in the future it may become feasible to identify most 3′ cDNA fragments in silico on the basis of their size [= distance of the most 3′-proximal MboI site to the poly(A) site], the two nucleotides adjacent to the MboI site and the two nucleotides preceding the poly(A) tail.
We used the ADDER technology to characterize mRNAs with circadian expression in liver. This analysis suggested that most of these mRNAs reach zenith values just before and during the nocturnal activity phase of mice. Cloning and sequencing of 51 cyclically expressed mRNA sequences revealed that many of these transcripts encode proteins involved in metabolism and detoxification. These include four cytochrome P450 enzymes, the P450 oxidoreductase (NCPR), enzymes involved in heme and glutathione biosynthesis and enzymes involved in carbohydrate, fat and amino acid metabolism. Thus, a major purpose of circadian liver gene expression may be the anticipation of and adaptation to food processing. This conjecture is supported by two recent reports that demonstrate a close connection between circadian gene expression and feeding (15,16). These studies indicate that feeding time is a dominant ‘Zeitgeber’ (timing cue) for circadian gene expression in peripheral tissues such as the liver. Thus, when mice or rats are fed for several consecutive days exclusively during the day, when these nocturnal animals usually sleep, the phase of peripheral liver gene expression gets completely inverted. Interestingly, however, feeding time does not affect the master circadian pacemaker, residing in the suprachiasmatic nucleus of the hypothalamus.
In conclusion, we have developed a novel mRNA display technology and have successfully employed it to identify many genes with circadian expression in the liver. Given the reproducibility, sensitivity and relatively low cost of the ADDER technology, this approach may prove useful for the isolation of differentially expressed genes in a large variety of experimental systems.
Acknowledgments
ACKNOWLEDGEMENTS
We thank Steve Brown and Juergen Ripperger for critical comments on the manuscript and Nicolas Roggli for expert preparation of the illustrations. The work was supported by the Swiss National Science Foundation (Grant no. 31-47314.96), the State of Geneva, the Bonizzi Theler Foundation and the Louis Jeantet Foundation for Medicine.
References
- 1.Lavery D.J., Lopez-Molina,L., Fleury-Olela,F. and Schibler,U. (1997) Selective amplification via biotin- and restriction-mediated enrichment (SABRE), a novel selective amplification procedure for detection of differentially expressed mRNAs. Proc. Natl Acad. Sci. USA, 94, 6831–6836. [DOI] [PMC free article] [PubMed] [Google Scholar]
- 2.Schibler U. and Tafti,M. (1999) Molecular approaches towards the isolation of sleep-related genes. J. Sleep Res., 8, S1–S10. [DOI] [PubMed] [Google Scholar]
- 3.Holstege F.C., Jennings,E.G., Wyrick,J.J., Lee,T.I., Hengartner,C.J., Green,M.R., Golub,T.R., Lander,E.S. and Young,R.A. (1998) Dissecting the regulatory circuitry of a eukaryotic genome. Cell, 95, 717–728. [DOI] [PubMed] [Google Scholar]
- 4.Iyer V.R., Eisen,M.B., Ross,D.T., Schuler,G., Moore,T., Lee,J.C., Trent,J.M., Staudt,L.M., Hudson,J., Boguski,M.S. et al. (1999) The transcriptional program in the response of human fibroblasts to serum. Science, 283, 83–87. [DOI] [PubMed] [Google Scholar]
- 5.Velculescu V.E., Zhang,L., Vogelstein,B. and Kinzler,K.W. (1995) Serial analysis of gene expression. Science, 270, 484–487. [DOI] [PubMed] [Google Scholar]
- 6.Yamashita T., Hashimoto,S., Kaneko,S., Nagai,S., Toyoda,N., Suzuki,T., Kobayashi,K. and Matsushima,K. (2000) Comprehensive gene expression profile of a normal human liver. Biochem. Biophys. Res. Commun., 269, 110–116. [DOI] [PubMed] [Google Scholar]
- 7.Liang P. and Pardee,A.B. (1992) Differential display of eukaryotic messenger RNA by means of the polymerase chain reaction. Science, 257, 967–971. [DOI] [PubMed] [Google Scholar]
- 8.Chomczynski P. and Sacchi,N. (1987) Single-step method of RNA isolation by acid guanidinium thiocyanate–phenol–chloroform extraction. Anal. Biochem., 162, 156–159. [DOI] [PubMed] [Google Scholar]
- 9.Schibler U., Tosi,M., Pittet,A.C., Fabiani,L. and Wellauer,P.K. (1980) Tissue-specific expression of mouse α-amylase genes. J. Mol. Biol., 142, 93–116. [DOI] [PubMed] [Google Scholar]
- 10.Gubler U. (1988) A one-tube reaction for the synthesis of blunt-ended double-stranded cDNA. Nucleic Acids Res., 16, 2726. [DOI] [PMC free article] [PubMed] [Google Scholar]
- 11.Don R.H., Cox,P.T., Wainwright,B.J., Baker,K. and Mattick,J.S. (1991) ‘Touchdown’ PCR to circumvent spurious priming during gene amplification. Nucleic Acids Res., 19, 4008. [DOI] [PMC free article] [PubMed] [Google Scholar]
- 12.Altschul S.F., Gish,W., Miller,W., Myers,E.W. and Lipman,D.J. (1990) Basic local alignment search tool. J. Mol. Biol., 215, 403–410. [DOI] [PubMed] [Google Scholar]
- 13.Lopez-Molina L., Conquet,F., Dubois-Dauphin,M. and Schibler,U. (1997) The DBP gene is expressed according to a circadian rhythm in the suprachiasmatic nucleus and influences circadian behavior. EMBO J., 16, 6762–6771. [DOI] [PMC free article] [PubMed] [Google Scholar]
- 14.Sutcliffe J.G., Foye,P.E., Erlander,M.G., Hilbush,B.S., Bodzin,L.J., Durham,J.T. and Hasel,K.W. (2000) TOGA: an automated parsing technology for analyzing expression of nearly all genes. Proc. Natl Acad. Sci. USA, 97, 1976–1981. [DOI] [PMC free article] [PubMed] [Google Scholar]
- 15.Damiola F., Le Minh,N., Preitner,N., Kornmann,B., Fleury-Olela,F. and Schibler,U. (2000) Restricted feeding uncouples circadian oscillators in peripheral tissues from the central pacemaker in the suprachiasmatic nucleus. Genes Dev., 14, 2950–2961. [DOI] [PMC free article] [PubMed] [Google Scholar]
- 16.Stokkan K.A., Yamazaki,S., Tei,H., Sakaki,Y. and Menaker,M. (2001) Entrainment of the circadian clock in the liver by feeding. Science, 291, 490–493. [DOI] [PubMed] [Google Scholar]