Abstract
Early detection enables improved prognosis for prostate cancer (PCa). A promising target for imaging and therapy of PCa is the prostate-specific membrane antigen (PSMA), which exhibits both expression within the epithelium of PCa cells, and becomes internalized upon ligand binding. Here we report the synthesis of a PSMA-targeted bionized nanoferrite (BNF) nanoparticle and its biological evaluation in an experimental model of PCa. The BNF nanoparticle formulation exhibits properties conducive to targeted imaging such as stealth, prolonged circulation time and enhanced clearance from non-target sites. Optical imaging of the targeted BNF in vivo indicates preferential accumulation in PSMA+ tumors 4 h post-injection, suggesting target specificity. On the other hand, non-targeted nanoparticles exhibit lower uptake with similar accumulation in both PSMA+ and PSM− tumors indicating tumor access without preferential accumulation. Imaging with single photon emission computed tomography (SPECT) and biodistribution studies of a modified construct indicate highest tumor accumulation at 48 h post-injection [4.3 ± 0.4 percentage injected dose per gram of tissue (%ID g−1)], with tumor/blood and tumor/muscle ratios of 7.5 ± 2.4 and 11.6 ± 1.2 %ID g−1, respectively. Ex vivo fluorescence microscopy, Prussian blue staining, immunohistochemistry and biodistribution studies confirm enhanced nanoparticle uptake in PSMA+ tumors compared to those not expressing PSMA. The BNF nano-formulation described is promising for PSMA-targeted imaging applications in vivo.
Introduction
Prostate cancer (PCa) is the second leading cause of cancer-related death in men with no effective treatments against metastatic, castrate-resistant disease.1 Early detection enables rapid implementation of appropriate therapy, allowing for an improved prognosis. A promising biological target for imaging and therapy of PCa is the prostate-specific membrane antigen (PSMA), which is overexpressed on malignant prostate epithelium as well as within the neovasculature of other solid tumors and within kidneys.2 PSMA exhibits rapid internalization and recycling, allowing enhanced concentration of targeting ligands and their therapeutic payloads.3,4
Nanotechnology has the capacity to combine imaging and therapeutic agents within the same construct. Significant advantages of using nanoparticles rather than low-molecular-weight agents for imaging and therapy in vivo are circumventing tumor heterogeneity by targeting of multiple epitopes as well as tumor accumulation via the enhanced permeability and retention (EPR) effect.5–14 In addition to EPR, active targeting of nanoparticles can also add another level of site selectivity and accumulation. A number of targeted nanoparticle formulations are currently in clinical trials including cyclodextrin nanoparticles that target the transferrin receptor (NCT00689065), αvβ3-targeted silica nanoparticles (NCT01266096) and PSMA-targeted poly(lactic-co-glycolic acid) (PLGA) nanoparticles, known as BIND-014.15
Magnetic iron oxide nanoparticles (MIONs) continue to generate interest owing to their demonstrated utility in numerous biological and medical applications.16–20 Despite considerable effort however, targeted MION constructs have yet to gain wide clinical acceptance mainly due to interactions with host immune cells, such as macrophages, limiting selective delivery to tissues of interest.21,22 As a result, it remains an open question whether such molecular targeting indeed leads to improved tumor retention of nanoparticles for cancer imaging and therapy, which has been the subject of several recent reviews.23–27
A recently developed iron oxide nanoparticle, bionized nanoferrite (BNF), has attracted attention due to its potential for treating cancer with hyperthermia.28 Synthesis of BNF particles was reported in 2007.29 In this procedure, crystalline shape was controlled during crystal growth using high-pressure homogenization to form anisotropic crystals, which were then aggregated in a controlled environment to form the BNF core structure comprising 5–9 parallelepipeds. The collective magnetic state of this nanoparticle cluster enables enhanced alternating magnetic field (AMF)-promoted heating, when compared to other MIONs, making BNF particles more suitable candidates for hyperthermia therapy. These particles are now commercially available with various options for size, coating and surface functionalization. In addition, BNF nanoparticles have demonstrated selective tumor retention in murine models of human breast cancer when labeled with monoclonal antibodies.30
The aim of this study was to develop a PSMA-targeted BNF nanoparticle formulation that could be administered systemically, provide enhanced PSMA+ tumor retention and reduced non-specific accumulation in organs of the reticuloendothelial system (RES). Here we report the synthesis of a BNF nanoparticle formulation and its in vivo evaluation in PC3 human PCa cell lines engineered to express PSMA (PIP) versus the wild type, PSMA− (flu) PC3 tumors. Results demonstrated lower nanoparticle retention in organs of the RES, and enhanced retention in PSMA+ tumors, suggesting that such nanoparticles might be useful for imaging, and eventually treating PSMA+ tumors in vivo.
Results and discussion
Synthesis and characterization
A key feature of nanoparticle constructs used for in vivo biological applications is particle size, as particles larger than 200 nm in diameter are typically sequestered by the RES, while those with mean hydrodynamic diameters smaller than 5 nm often undergo clearance by renal excretion. Accordingly, considerable effort has been expended to develop nanoparticles with physical and chemical properties that minimize interactions with host immune systems, i.e., display an element of “stealth”, in order to enhance blood circulation times and minimize sequestration by the RES, thereby enabling higher accumulation within target sites.14,31 A now conventional approach for establishing stealth characteristics is through the use of amphiphilic polymer derivatives, such as poloxamers, poloxamines and polyethyleneglycol (PEG), for nanoparticle coating, leading to extended blood circulation times and greater extravasation to tumor sites.31,32
Active targeting has been an asset in enhancing the efficacy of nanoparticle internalization by target cells. For instance, HER2-targeted immunoliposomes were reported to possess a 6-fold higher intracellular uptake in breast cancer xenografts than non-targeted liposomes, implying an enhanced antibody-mediated endocytosis.33 In addition, immunoliposomes were observed within cancer cells whereas non-targeted liposomes were predominantly in extracellular stroma or within macrophages.33 A number of other reports have also demonstrated that while uptake of targeted and non-targeted nanoparticles are similar, targeted nanoparticles exhibit enhanced retention in solid tumors.23,34 As a result, the BNF nanoparticle constructs developed in this study employed both stealth, through the use of PEGylation, as well as a PSMA-targeted small molecule affinity agent for enhanced tumor localization. The imaging capability was provided through the conjugation of a dye or a metal chelator for in vivo and ex vivo optical and nuclear imaging experiments, respectively.
A well-studied small-molecule PSMA inhibitor initially reported by our group (Scheme 1A), was selected for targeting of the BNF nanoparticles as it has already been shown to exhibit suitable pharmacokinetics for in vivo targeting and imaging of PSMA in the same mouse xenografts utilized in the current study.35 A 1000 Da di-NHS ester PEG chain was selected for PEGylation of the nanoparticles. Based on the size of the BNF nanoparticles and the number of available surface-functionalized amines, it was estimated that this PEG length, corresponding to approximately 12 ethylene glycol subunits, would be sufficient to allow for both termini to attach to the same nanoparticle. That would leverage the attributes of PEGylation, i.e., stealth and long circulation times, while minimizing a significant increment in overall nanoparticle size. Considering the long circulation times of PEGylated nanoparticles (up to 14 days), the single photon emission computed tomography (SPECT) radioisotope 111In (t1/2 = 2.80 days) was used for all in vivo imaging and biodistribution studies. Schematic diagrams of the synthesis and structure of the BNF nanoparticles are summarized in Scheme 1 and Fig. 1, respectively. Nanoparticle formulations used for optical or nuclear imaging applications were synthesized using NHS/SCN amine chemistry starting with commercially available 80 nm amine-functionalized BNF-starch nanoparticle precursors.29
Scheme 1.
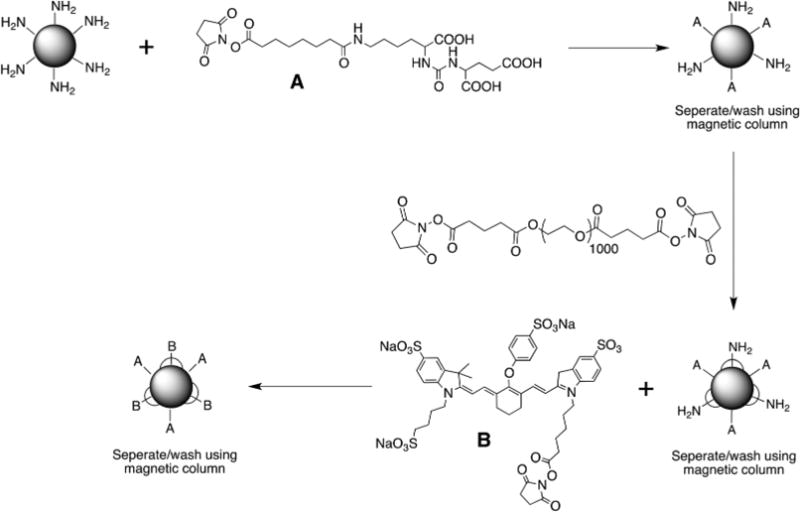
Synthesis of PSMA-targeted BNF particles.
Fig. 1.
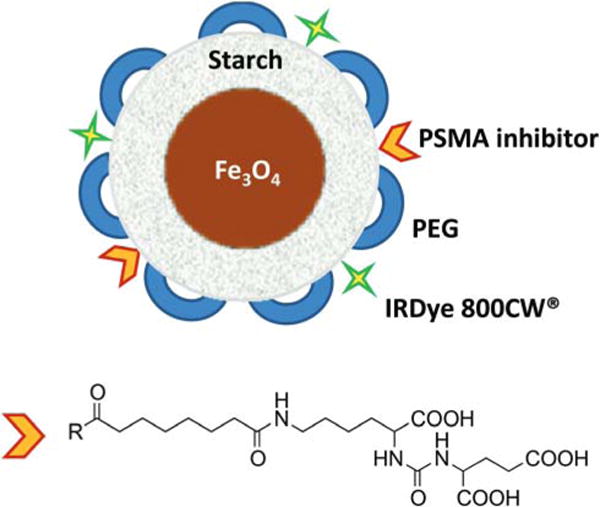
BNF Nanoparticle construct.
The (mean) hydrodynamic radii measured by (z-averaged) dynamic light scattering (DLS), and zeta potentials of the as-purchased nanoparticles (BNF-starch-NH2) and those modified for optical imaging showed little change following surface functionalization (Table 1). The measured polydispersity index (PI) also changed little after synthesis suggesting minimal impact of synthesis and addition of PEG and other moieties on nanoparticle size. Additional size measurements were conducted using nanoparticle tracking analysis, which monitors trajectories of nanoparticles in suspension due to Brownian motion. Size estimation was based on statistical analysis of several nanoparticles assuming spherical geometry. Results obtained from this method were consistent with those obtained by DLS, which indicated a size of 105 nm and 106 nm for standard and modified BNF nanoparticles, respectively (Fig. S1†).
Table 1.
Size and zeta potential values for standard non-modified BNF nanoparticles and modified particles for optical (dye-conjugated) and SPECT (DTPA-conjugated) imaging, measured by a Malvern Zetasizer
| Sample | Size (nm) | PdI | Zeta potential |
|---|---|---|---|
| BNF standard | 169.57 | 0.18 | −1.22 |
| BNF-Urea-PEG-Dye | 161.88 | 0.14 | −7.70 |
| BNF-Urea-PEG-DTPA | 139.1 | 0.13 | −11.6 |
Representative transmission electron microscopic (TEM) images (Fig. 2) show the expected geometry of the core (~50 nm) of BNF-starch nanoparticles, comprising multiple crystals having diameter of 10–20 nm. The starch and other organic (‘soft’) coating materials are typically not visible with high energy electrons (~100 keV). On the other hand, the similarity of crystal shape, size, and proximity to one another between precursor BNF-starch (Fig. 2a) and modified BNF (Fig. 2b) cores suggests they remain unchanged after modification.
Fig. 2.
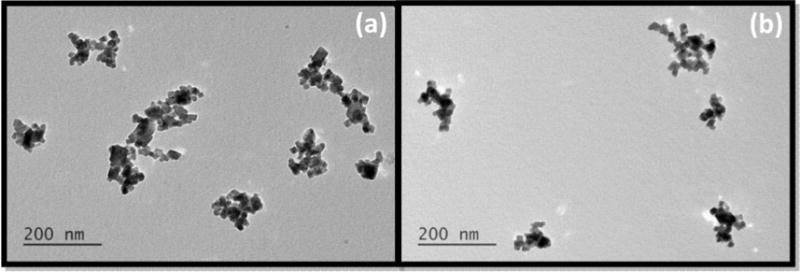
Transmission electron microscopic images of non-modified BNF particles (a) and modified formulation 5 (Table 2) (b).
In vitro evaluation
Optimization of molar equivalence of urea (20-, 50- and 100-fold excess) to free amines on the nanoparticle surface was initially evaluated in vitro using the PSMA+ PC3 PIP and PSMA− PC3 flu cell lines.35 In those experiments, the nanoparticle formulations were incubated with PSMA+ PC3 PIP and PSMA− PC3 flu cells at 37 °C over 1 h prior to being washed with PBS and imaged using the Pearl Impulse® optical imaging system. The results indicated higher uptake of targeted nanoparticles treated with a 50-fold excess of the urea inhibitor (Fig. 3). Use of a higher molar equivalence (i.e. 100×) reduced the nanoparticle uptake by the PSMA+ PC3 PIP tumors most likely owing to steric hindrance. As a result the 50× molar ratio was kept constant in all remaining syntheses.
Fig. 3.

(a) In vitro binding of targeted BNFs (Table 2, formulation 5) to PSMA+ PC3 PIP and PSMA− PC3 flu cells following conjugation with various molar equivalences of urea to BNF surface amines (indicated on top of each set), demonstrating preferential uptake in the PSMA+ PC3 PIP cells compared to PSMA− PC3 flu cells; (b) quantification of cellular uptake in each case.
In order to address potential toxicity, MTS ((3-(4,5-dimethylthiazol-2-yl)-5-(3-carboxymethoxyphenyl)-2-(4-sulfophenyI)-2H-tetrazolium)) assays were performed using the PSMA+ PC3 PIP cell line. PSMA+ PC3 PIP cells were seeded into a 96-well plate and incubated with variable amounts of the nanoparticle formulations. Cell viability in treated cells was obtained by measurement of absorbance and its correlation to that of non-treated, control cells. Results from the MTS assay indicated that single doses of up to 2 mg of the BNF nanoparticle formulation were not cytotoxic when compared to the observed cell viability levels in cells treated with the control, non-modified BNF nanoparticles as well as those in control, non-treated cells (Fig. 4a).
Fig. 4.
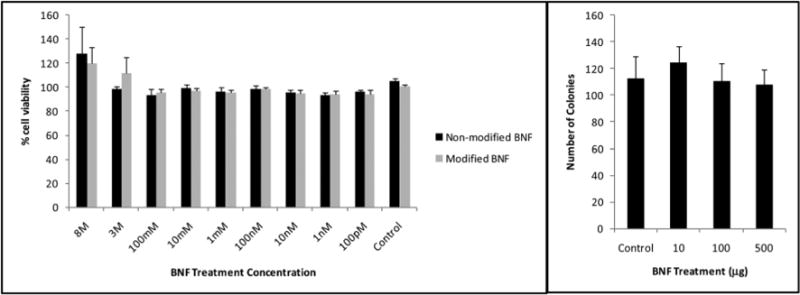
MTS (a) and clonogenic (b) assays in the PSMA+ PC3 PIP prostate cancer cell line, indicating lack of significant nanoparticle toxicity in the studied BNF concentration range as depicted by cell viability and colony formation assays.
Considering that cell viability does not reflect the ability of cells to divide and form colonies, a clonogenic assay was also performed. The clonogenic assay (Fig. 4b) further confirmed the results obtained from the MTS assay by demonstrating no significant changes in the capacity for forming colonies in treated versus untreated PSMA+ PC3 PIP cells.
In vivo optical evaluation
Table 2 lists the synthesized BNF-based nanoparticle formulations used for the in vivo evaluation and validation of the targeted nanoparticles. Nanoparticle formulations were evaluated in NOD-SCID mouse models bearing subcutaneous PSMA+ PC3 PIP and PSMA− PC3 flu tumors in opposite flanks. The initial evaluation was performed by in vivo near-infrared optical imaging (Pearl® Impulse). While PEGylation is an established approach for promoting nanoparticle stealth against immune cells, the molar equivalence of PEG on the nanoparticle surface still requires optimization. We utilized optical imaging in order to determine the ideal molar equivalence of PEGs to the BNF surface amines to prevent any hindrance in the urea-PSMA interaction (Fig. S2†). Fig. 5a illustrates typical ventral in vivo optical images of mouse xenografts following tail vein injection of 250 μg of the targeted BNF nanoparticle (tBNF) formulation 5 (Table 2) over 24 h. Results indicated preferential uptake in PSMA+ PC3 PIP tumors and an optimum imaging time of 4 h post-injection (n = 35). While 250 μg of the nanoparticle formulation is sufficient for optical imaging, higher doses were utilized to evaluate the consistency of nanoparticle biodistribution in vivo. Varying the amount of injected nanoparticles indicated reproducibility of the observed pharmacokinetics, up to 4 mg per dose (Fig. 5b), thereby further solidifying this approach. In addition, the higher doses are more applicable for future hyperthermia studies. Following each study, organs were retrieved and optically imaged ex vivo for further confirmation of preferential uptake of the targeted nanoparticles in PSMA+ PC3 PIP versus PSMA− PC3 flu tumors, as indicated in Fig. 5c. Results obtained from in vivo imaging studies with several control formulations of BNF-nanoparticles and unlabeled dye further support the role of PSMA-specific targeting of the BNF nanoparticles. Non-PEGylated/targeted nanoparticles (formulation 3, Table 2) accumulated only in the liver and spleen (Fig. 5e). This result is consistent with extensive sequestration by RES, and supports the important role of surface PEGylation. PEGylated/non-targeted (nBNF) nanoparticles (formulation 4, Table 2) demonstrated similar accumulation in both PSMA+ PC3 PIP and PSMA− PC3 flu tumors (Fig. 5d), indicating an approximately equivalent ‘permissive’ environment in both tumors for nanoparticle penetration. This observation was similar when the dye alone without nanoparticles or PSMA-ligand (formulation 1, Table 2) was injected (Fig. 5f). Although similar, injection of untargeted PEG-BNF-starch nanoparticles did produce more residual material in both tumors than did the dye, suggesting partial retention. By contrast, PSMA-targeted PEG-BNF-starch (formulation 5, Table 2) demonstrated the highest retention in PSMA+ PC3 PIP tumors with less measured in PSMA− PC3 flu tumors, confirming the necessity of PSMA targeting for improved tumor uptake.
Table 2.
List of evaluated compounds and their respective functions in this study; bionized nanoferrite (BNF); nanoparticle (NP); polyethylene glycol (PEG); transmission electron microscopy (TEM); diethylene triamine tetraacetic acid (DTPA)
| # | Description | Function |
|---|---|---|
| 1 | IRDye 800CW® | Control to evaluate dye biodistribution |
| 2 | Non-functionalized BNF | Control NP for TEM surface characterization |
| 3 | BNF-Dye-Urea | Control NP to evaluate significance of PEGylation |
| 4 | BNF-PEG-Dye | Control NP to evaluate absence of PSMA targeting |
| 5 | BNF-PEG-Dye-Urea | Optical imaging of PSMA-Targeted NPs |
| 6 | BNF-PEG-DTPA | SPECT imaging and biodistribution of PSMA-Targeted NPs |
Fig. 5.
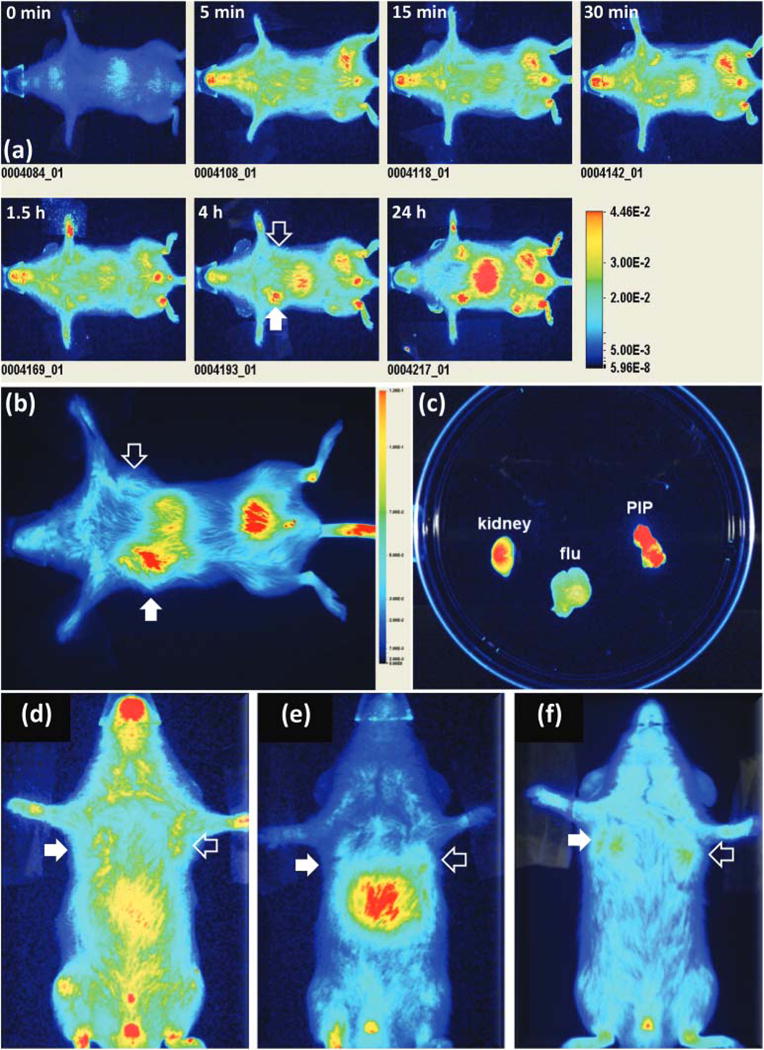
Typical in vivo optical images of a mouse (ventral view) bearing PSMA+ PC3 (PIP; solid arrow) and PSMA− PC3 (flu; hollow arrow) tumors over 24 h (a); ventral optical image of a mouse xenograft 4 h after tail vain injection of 4 mg of modified BNF construct 5 (Table 2) (b); ex vivo optical imaging of selected excised tissues (c); ventral optical images of mouse xenografts injected with the PEGylated non-targeted BNF particles 4 (Table 2) (d), non-PEGylated targeted BNF nanoparticles 3 (Table 2) (e) or the IR dye alone 1 (f) as controls. Images in panels a, d, e and f have been scaled uniformly to the same maximum.
Ex vivo microscopic analysis
Accumulation of PSMA-targeted, optically tagged BNF nanoparticle (formulation 5, Table 2) in tumors was further investigated with optical microscopy and immunohistochemistry of sectioned tumors that were harvested from mice 4 h post-injection of targeted and non-targeted nanoparticles. Similar uptake of formulation 4 (nBNF) was observed in both PSMA+ PC3 PIP and PSMA− PC3 flu tumors. Accumulation of formulation 5 was observed mostly on the periphery of PSMA− PC3 flu tumors while in PSMA+ PC3 PIP tumors, enhanced accumulation was observed owing to localization of formulation 5 to both the periphery and center of the tumor (Fig. 6a). It should be noted that not all BNF nanoparticles localized to PSMA expressing cells as some uptake was EPR-mediated. Similarly, nanoparticle accumulation in PSMA− PC3 flu tumors is likely a result of extravasation through leaky vasculature and the EPR effect. Results from both microscopy (Fig. 6b) and Prussian blue staining (Fig. 6c) further confirmed higher nanoparticle localization on PSMA+ PC3 PIP tumor tissues when compared to that in PSMA− PC3 flu tumors, suggesting PSMA-mediated uptake.
Fig. 6.
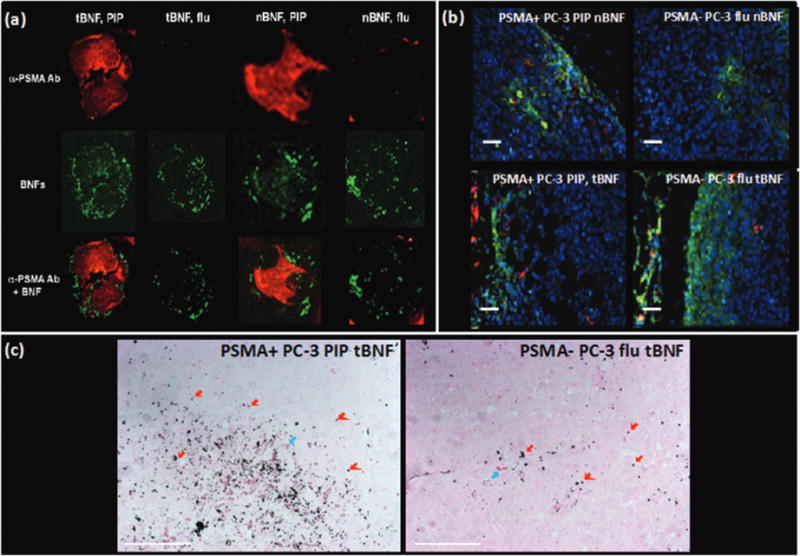
(a) Ex vivo optical images of excised PSMA+ PC3 PIP and PSMA− PC3 flu tumors showing uptake of targeted (tBNF; 5) and non-targeted (nBNF, 4) BNF nanoparticles (green) as well as the PSMA expression (red) by the PSMA+ PC3 PIP and PSMA− PC3 flu tumors; (b) ex vivo epifluorescence microscopy of excised PSMA+ PIP and PSMA− flu tumors showing uptake of targeted (tBNF; 5) and non-targeted (nBNF; 4) nanoparticles (red) in PSMA+ PC3 PIP and PSMA− PC3 flu tumors; blue (nuclei), green (macrophages); (c) Prussian blue staining of excised PSMA+ PC3 PIP and PSMA− PC3 flu tumors showing higher uptake of the targeted BNF nanoparticles (dark blue colored punctate signals; red arrows) by PSMA+ PC3 PIP cells versus the PSMA− PC3 flu tumor cells; blue arrows (red blood cells); pink (PSMA expression); scale bars = 50 μm.
SPECT-CT imaging and biodistribution studies
To investigate the pharmacokinetics of PSMA-targeted BNF nanoparticles in vivo and to quantify tumor uptake, the IRDye 800CW® was replaced with diethylene triamine pentaacetic acid (DTPA) to coordinate the SPECT radioisotope 111In. That isotope was selected owing to its sufficiently long half-life (t1/2 = 2.8 days), which enabled in vivo monitoring of the nanoparticles over 4 days. Radiolabeled nanoparticles were synthesized with a radiochemical yield of 85 ± 5% after washing and were evaluated by SPECT-CT imaging in NOD-SCID mice engrafted with PSMA+ PC3 PIP and PSMA− PC3 flu tumors over 4 d following injection with 9.25 MBq (250 μCi) of 111In-labeled nanoparticles. Biodistribution studies were performed at 4, 24, 48 and 96 h post-injection with n = 5 animals per time point. Fig. 7 illustrates SPECT-CT imaging of xenograft-bearing mice over 4 d with the highest PSMA+ tumor uptake at 48 h post-injection. Utilization of the nuclear construct allowed for more accurate quantification of targeted nanoparticle uptake than obtained from optical images via regional integration. Biodistribution results from this study (Table 3) indicated increasing uptake of targeted nanoparticles in PSMA+ PC3 PIP tumors over the first 48 h post-injection, reaching a percentage injected dose per gram of tissue (%ID g−1) of 4.3 ± 0.4% compared to the 0.82 ± 0.38% observed for the PSMA− PC3 flu tumors at the same time point, providing a PIP/flu ratio of 5.2. As expected, the blood pool decreased from 7.58 ± 1.46% at 4 h to 0.18 ± 0.10 at 96 h post-injection. The PSMA+ PIP tumor/blood and tumor/muscle ratios were 7.6 and 11.6, respectively, at 48 h post-injection. It is interesting to note that uptake takes place by both PSMA+ PC3 PIP and PSMA− PC3 flu tumors over the first 24 h owing to a combination of non-specific and targeted mechanisms. However, this accumulation plateaus in the PSMA− PC3 flu tumors while continuing to increase in the PSMA+ PC3 PIP tumors over 48 h due to the advantage provided by targeting. Although the optical and SPECT BNF constructs did not exhibit identical in vivo pharmacokinetics, it is important to note that they both supported the importance of targeting for enhanced tumor accumulation and demonstrated PSMA-mediated uptake.
Fig. 7.
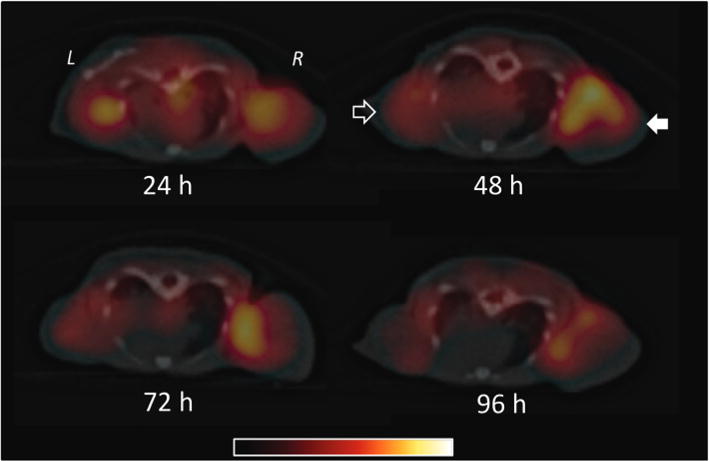
In vivo SPECT-CT imaging of a human PCa mouse model tearing PSMA+ PC3 (PIP; solid arrow) and PSMA− PC3 (flu; hollow arrow) tumors carried out over 4 d.
Table 3.
Biodistribution data (n = 51 in PIP/flu bearing mice administered 1.3 MBq (35 μCi) of 111ln-formulation 5
| 4 h | 24 h | 48 h | 72 h | 96 h | |
|---|---|---|---|---|---|
| Blood | 7.58 ± 1.46 | 1.26 ± 0.52 | 0.57 ± 0.15 | 0.22 ± 0.03 | 0.18 ± 0.10 |
| Urine | 1.12 ± 0.48 | 2.44 ± 1.23 | 1.45 ± 0.75 | 0.85 ± 0.63 | 0.56 ± 0.35 |
| Liver | 8.06 ± 2.05 | 10.30 ± ± 9.60 | 13.75 ± 9.69 | 8.08 ± 7.44 | 9.66 ± 10.93 |
| Spleen | 37.43 ± 29.75 | 32.88 ± 34.88 | 44.28 ± 18.12 | 28.82 ± 26.55 | 16.59 ± 13.44 |
| Kidneys | 2.11 ± 1.85 | 4.29 ± 3.03 | 7.29 ± 2.47 | 4.05 ± 3.36 | 2.00 ± 1.92 |
| Small int. | 0.31 ± 0.06 | 0.15 ± 0.13 | 0.77 ± 1.25 | 0.14 ± 0.12 | 0.09 ± 0.05 |
| Large int. | 0.15 ± 0.06 | 0.53 ± 0.35 | 0.67 ± 0.42 | 0.45 ± 0.32 | 0.15 ± ± 0.05 |
| Lungs | 0.69 ± 0.03 | 1.04 ± 0.85 | 0.27 ± 0.19 | 0.37 ± 0.33 | 0.18 ± 0.12 |
| Heart | 1.90 ± 0.37 | 0.96 ± 0.22 | 0.96 ± 0.32 | 0.63 ± 0.27 | 0.48 ± 0.27 |
| PIP | 2.18 ± 0.40 | 3.06 ± 0.44 | 4.29 ± 0.36 | 2.30 ± 1.23 | 1.99 ± 1.39 |
| Flu | 0.46 ± 0.10 | 2.07 ± 0.87 | 0.82 ± 0.39 | 1.25 ± 0.97 | 1.63 ± 1.07 |
| Bone | 2.62 ± 2.37 | 0.60 ± 0.70 | 2.19 ± 1.67 | 0.52 ± 0.46 | 0.91 ± 0.52 |
| Muscle | 0.08 ± 0.07 | 2.10 ± 1.38 | 0.37 ± 0.29 | 0.25 ± 0.07 | 0.17 ± 0.12 |
| Stomach | 0.16 ± 0.07 | 0.16 ± 0.09 | 2.47 ± 1.03 | 1.43 ± 1.06 | 0.53 ± 0.15 |
Experimental
Synthesis of BNF nanoparticles for optical imaging
Conjugation of PEG1000 (Creative PEG Works, Winston Salem, NC), IRDye 800CW (LI-COR Biosciences, Lincoln, NB) and urea-based PSMA inhibitors was carried out in a pH 7.0 PBS buffer using NHS-ester/amine chemistry. In a typical experiment, amine-terminated (amine density = 11–12 nmol mg−1 of iron oxide) and starch-coated BNF nanoparticles (Micromod, Rostock, Germany) were conjugated to a 50-fold molar excess (based on amino group density) of the urea inhibitor, which was synthesized in our laboratory according to a previous publication.35 Subsequent conjugations of NHS-PEG1000-NHS and the LICOR IRDye® 800CW were carried out under the same conditions as stated above. After each conjugation reaction, BNF nanoparticles were magnetically isolated from the reaction mixture using a DynaMag™ -Spin magnet (Invitrogen, Dynal AS, Oslo, Norway), washed (×3) and reformulated in cold PBS.
Synthesis of BNF nanoparticles for SPECT imaging
This synthesis was initiated using the same conjugation conditions as those employed in the design of the optical construct with the only exception being the attachment of the DTPA chelator through amine-isothiocyanate chemistry. In a typical reaction the BNF nanoparticles were first rinsed (×3) with a 1 M solution of EDTA to remove any iron exposed at the surface of the nanoparticles. After rinsing with cold PBS (×3) to remove all remaining chelated and unchelated EDTA, nanoparticles were then suspended in pH 9 saline and reacted with 3 molar equivalents of DTPA. After rinsing with cold PBS (×3), nanoparticles were washed again with a 1 M EDTA solution in order to remove any remaining traces of exposed iron. That was again followed by rinsing (×3) and re-formulation in cold PBS.
Radiolabeling with indium-111
In a typical radiolabeling reaction, 300 μg of DTPA-conjugated nanoparticles were reacted with 185 MBq (5 mCi) of 111InCl3 (Nordion, Ottawa, ON, Canada) in 1 mL of pH 3.5 NaOAc buffer at room temperature. After the reaction, nanoparticles were purified magnetically and rinses were assayed to ensure complete removal of free In-111 or 111In-DTPA conjugates not attached to the nanoparticles. Radiolabeling was typically carried out over 20 min, while 3–4 washes of the nanoparticles appeared sufficient for complete purification. The radiochemical yield of the purified 111In-labeled BNF nanoparticles was 85 ± 5%.
Nanoparticle size and zeta potential characterization
Suspensions of starch-coated magnetite (Fe3O4) core-shell nanoparticles (Bionized Nanoferrite or BNF, catalog no. 10-01-801) were obtained from micromod Partikeltechnologie, GmbH (Rostock, Germany). These nanoparticles were produced by precipitating ferric and ferrous sulfate salts from solution with high pH in a high-pressure-homogenization reaction vessel. The iron content was provided by the manufacturer and was reported >70% w/w, with a total iron concentration of about 30 mg Fe mL−1 (42 mg nanoparticles mL−1). The nanoparticles were suspended in sterile water to provide a stable biocompatible suspension.29
Size and zeta potential measurements were performed on the samples using a Malvern Zetasizer Nano ZS-90 (Malvern Instruments Ltd, Worcestershire, UK). Photon correlation spectroscopy (PCS) was used to determine the hydrodynamic nanoparticle diameter of the nanoparticle samples as received from the manufacturer. Samples were diluted in sterile water to an iron concentration of approximately 0.5 mg ml−1 prior to analysis. Zeta potentials were measured using the Malvern Zetasizer nano series folded capillary cells on the Malvern Zetasizer Nano ZS-90.
Transmission Electron Microscopy was used to obtain characteristic images of each of the nanoparticles. Images were obtained using an EM400 T microscope (Philips, NV, USA) operated at 120 kV. A 1 μL aliquot of the nanoparticle suspension was placed on a copper grid coated with a thin layer of carbon and dried under vacuum to isolate individual nanoparticles for imaging.
Additional size and size distribution measurements of unmodified and modified BNF nanoparticles were conducted by nanoparticle tracking analysis (NTA) using Nanosight LM10 (Malvern, Malvern, UK). Nanoparticle suspensions were dispersed using a probe sonicator for 10 seconds prior to analysis. Nanoparticle selection for tracking and subsequent analysis were performed using manufacturer-provided software.
Cell lines
All studies employed the PC3 human PCa cell lines engineered to exhibit high (PIP) or low (flu) PSMA expression. Both cell lines, generously provided by Dr Warren Heston (Cleveland Clinic), were grown in RPMI 1640 growth media (Corning Cellgro, Manassas, VA) containing 10% fetal bovine serum (FBS) (Sigma-Aldrich, St. Louis, MO) and 1% penicillin-streptomycin (Corning Cellgro, Manassas, VA) and were maintained in a humidified incubator under 5% CO2 at 37 ○C.
In vitro binding
PSMA+ PIP and PSMA− flu cells were plated into a 96-well plate and incubated with 15 μg per well of the targeted BNF nanoformulation at 37 °C for 1 h. Following incubation, wells were rinsed with PBS and imaged using the Pearl® Impulse imaging system (LI-COR Biosciences, Lincoln, NE). Nanoparticle uptake was quantified using the manufacturer’s software.
MTS assay
PSMA+ PIP cells, seeded into a 96-well plate at a concentration of 1 × 10³ cells per well, were incubated with the nanoparticle formulation overnight in triplicate. Cell viability in treated and control wells was measured using the Cell Titer 96 Aqueous One solution (Promega, Madison, USA) as per manufacturer’s protocol.
Clonogenic assay
In this assay 5 × 10⁶ PIP cells were seeded into 100 cm2 petri dishes and incubated with various amounts of BNF nanoparticle formulations (up to a single 500 μg dose) for 24 h. Following treatment, cells from each plate were collected. Roughly 100 cells were plated, in triplicate, into 25 cm2 petri dishes. Plates were incubated for 14 days at 37 °C. The resulting colonies were stained with Crystal Violet and subsequently counted manually. Untreated cells were used as a control and all experiments were done in triplicate.
Mouse xenografts
All animal studies were carried out according to regulations set forth by the Johns Hopkins Animal Care and Use Committee. Male, 6–8 weeks old, Non-Obese Diabetic Severe-Combined Immunodeficient (NOD-SCID; Johns Hopkins University Immunocompromised Animal Core) mice were subcutaneously inoculated with 1 × 10⁶ PSMA+ PIP and PSMA− flu cells in 100 μL of HBSS in opposite front flanks. Tumors reached 4–6 mm in diameter prior to being utilized for in vivo optical/SPECT-CT imaging or ex vivo optical/biodistribution studies. Tumor growth was closely monitored in an attempt to minimize significant tumor size differences between mouse models, thereby producing more consistent results.
Optical imaging of the PC3 mouse xenografts
Mice were injected with 250 μg of IRDye-labeled BNF nanoparticles in 100 μL of pH 7 PBS intravenously and anesthetized under 3% isofluorane prior to being placed on the scanner bed. Isofluorane levels were subsequently decreased to 1% in order to further ensure mouse survival. The imaging bed temperature was set to 37 °C. Mice received isofluorane through a nose cone attached to the imaging bed. Optical in vivo images were acquired at various time points (n = 5 at each time point) using a Pearl® Impulse small animal imaging system. All images, acquired under the same parameter settings using the 700 nm and 800 nm channels, were scaled to the same maximum. At the end of each study, mice were sacrificed and organs (liver, spleen, heart, lungs, small intestines, large intestines, kidneys, PSMA+ PIP and PSMA− flu tumors) were retrieved and placed in a plastic petri dish for ex vivo optical imaging.
Ex vivo optical imaging and epifluorescence microscopy
Slide-fixed tumor tissues were de-paraffinized using 2 cycles (5 min each) of xylene, 100% EtOH, 95% EtOH and 100% H2O. For use with fluorescence microscopy, tissues were then rinsed with PBS prior to staining for PSMA expression (Primary: Clone 3E6 PSMA monoclonal mouse anti-human PSMA (Dako, Carpinteria, CA); Secondary: goat anti-mouse alexafluor 680 (Invitrogen, Grand Island, NY) and macrophages (Primary: rat anti-mouse CD68 (Abeam, Cambridge, MA); Secondary: Sheep anti-rat fluorescein anti-CD68 (Invitrogen, Grand Island, NY) in addition to the use of the Hoechst 33342 nuclear stain. Nanoparticles did not require staining owing to the presence of the nanoparticle conjugated IRDye® 800CW. Slides were then viewed under a Nikon Eclipse E800 fluorescence microscope (Santa Clara, CA). The above procedures were also carried out for tissues used for ex vivo optical imaging of PSMA+ PIP and PSMA− flu tumor tissues with the Odyssey Infrared Imaging System (LI-COR Biosciences). For this application, however, tissues were only stained for PSMA expression.
Prussian blue staining
Following deparaffinizing and hydrating slide-fixed tumor tissues, slides were submersed in a 50: 50 v/v mixture of 20% HCl and 10% potassium ferrocyanide over 20 minutes. Tissues were then rinsed twice in distilled water prior to being stained with Clone 3E6 PSMA monoclonal mouse anti-human antibody (Dako, Carpinteria, CA), secondary goat anti-mouse alexafluor 680 antibody and nuclear fast red with intermediate rinsing cycles. Tissues were then dehydrated using two cycles each of 95% ethanol and xylene prior to the placement of a coverslip and imaging under a Nikon Eclipse E800 microscope.
SPECT-CT imaging of the PC3 mouse xenografts
Mice were injected with 9.25 MBq (250 μCi) of 111In-labeled BNF nanoparticles in 100 μL of pH 7 PBS intravenously (n = 5), anesthetized under 3% isofluorane prior to being placed on the scanner bed and kept warm with an external light source while being scanned. Isofluorane levels were decreased to 1% throughout the scanning process in order to ensure mouse survival. Imaging of mice was then carried out using a CT-equipped Gamma Medica-Ideas SPECT scanner (Northridge, CA). A CT scan was performed at the end of each SPECT scan for anatomical co-registration. Obtained data sets were subsequently reconstructed using the provided Gamma Medica-Ideas software. Final data visualization and image generation was accomplished using Amira software (Hillsboro, OR).
Biodistribution studies
Mice bearing PC3 tumors were injected with 1.3 MBq (35 μCi) of 111In-labeled BNF nanoparticles in 70 μL of pH 7 PBS buffer intravenously. Mice (n = 5 per time point) were sacrificed at 4, 24, 48 and 96 h post-injection. Liver, spleen, heart, lungs, kidneys, small intestines, large intestines, stomach, muscle, bone, PSMA+ PIP and PSMA− flu tumors, blood and urine samples were retrieved. Each sample was weighed and counted using an automated gamma counter (1282 Compugamma CS, Pharmacia/LKBNuclear, Inc., Gaithersburg, MD). The %ID g−1 was then calculated for each sample, accounting for decay correction, by comparison with external 111In standards measured in triplicate.
Conclusions
The PSMA-targeted BNF nanoparticle formulation developed in this study demonstrated preferential uptake in PSMA+ PC3 PIP tumors, compared to accumulation in PSMA− PC3 flu tumors within the same mice, confirming the importance of targeting to provide enhanced nanoparticle delivery. This nano-construct is a promising candidate for future prostate cancer hyperthermia treatment and imaging studies.
Supplementary Material
Acknowledgments
This study was supported by CA151838, CA134675, CA184228 and the A. David Mazzone Award Program of the Prostate Cancer Foundation. We thank Dr. Bert Vogelstein for use of equipment from his laboratory.
Footnotes
Electronic supplementary information (ESI) available. See DOI: 10.1039/C4nr06069e
References
- 1.Mariotto AB, Yabroff KR, Shao Y, Feuer EJ, Brown ML. J Natl Cancer Inst. 2011;103:117. doi: 10.1093/jnci/djq495. [DOI] [PMC free article] [PubMed] [Google Scholar]
- 2.Rajasekaran AK, Anilkumar G, Christiansen JJ. Am J Physiol: Cell Physiol. 2005;288:C975. doi: 10.1152/ajpcell.00506.2004. [DOI] [PubMed] [Google Scholar]
- 3.Mhawech-Fauceglia P, Zhang S, Terracciano L, Sauter G, Chadhuri A, Herrmann FR, Penetrante R. Histopathol. 2007;50:472. doi: 10.1111/j.1365-2559.2007.02635.x. [DOI] [PubMed] [Google Scholar]
- 4.Ghosh A, Heston WDW. J Cell Biochem. 2004;91:528. doi: 10.1002/jcb.10661. [DOI] [PubMed] [Google Scholar]
- 5.Bao G, Mitragotri S, Tong S. Annu Rev Biomed Eng. 2013;15:253. doi: 10.1146/annurev-bioeng-071812-152409. [DOI] [PMC free article] [PubMed] [Google Scholar]
- 6.Cheng Z, Al Zaki A, Hui JZ, Muzykantov VR, Tsourkas A. Science. 2012;338:903. doi: 10.1126/science.1226338. [DOI] [PMC free article] [PubMed] [Google Scholar]
- 7.Garbuzenko O, Barenholz Y, Priev A. Chem Phys Lipids. 2005;135:117. doi: 10.1016/j.chemphyslip.2005.02.003. [DOI] [PubMed] [Google Scholar]
- 8.Hedayati M, Thomas O, Abubaker-Sharif B, Zhou H, Cornejo C, Zhang Y, Wabler M, Mihalic J, Gruettner C, Westphal F, Geyh A, Deweese TL, Ivkov R. Nanomedicine. 2013;8:29. doi: 10.2217/nnm.12.98. [DOI] [PMC free article] [PubMed] [Google Scholar]
- 9.Iyer AK, Khaled G, Fang J, Maeda H. Drug Discovery Today. 2006;11:812. doi: 10.1016/j.drudis.2006.07.005. [DOI] [PubMed] [Google Scholar]
- 10.Jokerst JV, Gambhir SS. Acc Chem Res. 2011;44:1050. doi: 10.1021/ar200106e. [DOI] [PMC free article] [PubMed] [Google Scholar]
- 11.Peng XH, Qian X, Mao H, Wang AY, Chen Z, Nie S, Shin DM. Int J Nanomed. 2008;3:311. doi: 10.2147/ijn.s2824. [DOI] [PMC free article] [PubMed] [Google Scholar]
- 12.Thorek DLJ, Chen A, Czupryna J, Tsourkas A. Ann Biomed Eng. 2006;34:23. doi: 10.1007/s10439-005-9002-7. [DOI] [PubMed] [Google Scholar]
- 13.Wagner V, Dullaart A, Bock AK, Zweck A. Nat Biotechnol. 2006;24:1211. doi: 10.1038/nbt1006-1211. [DOI] [PubMed] [Google Scholar]
- 14.Wang AZ, Langer R, Farokhzad OC. Annu Rev Med. 2012;63:185. doi: 10.1146/annurev-med-040210-162544. [DOI] [PubMed] [Google Scholar]
- 15.Hrkach J, Von Hoff D, Ali MM, Andrianova E, Auer J, Campbell T, De Witt D, Figa M, Figueiredo M, Horhota A, Low S, McDonnell K, Peeke E, Retnarajan B, Sabnis A, Schnipper E, Song JJ, Song YH, Summa J, Tompsett D, Troiano G, Hoven TVG, Wright J, LoRusso P, Kantoff PW, Bander NH, Sweeney C, Farokhzad OC, Langer R, Zale S. Sci Transi Med. 2012;4:128. doi: 10.1126/scitranslmed.3003651. [DOI] [PubMed] [Google Scholar]
- 16.Barcena C, Sra AK, Gao J. In: Nanoscale Magnetic Materials and Applications. Liu JP, Fullerton E, Gutfleisch O, Sellmyer DJ, editors. 2009. pp. 591–626. [Google Scholar]
- 17.Berry CC. J Phys D: Appl Phys. 2009;42:22. [Google Scholar]
- 18.Berry CC, Curtis ASG. J Phys D: Appl Phys. 2003;36:R198. [Google Scholar]
- 19.O’Grady K. J Phys D: Appl Phys. 2009;42:22. [Google Scholar]
- 20.Laurent S, Forge D, Port M, Roch A, Robic C, Elst LV, Muller RN. Chem Rev. 2010;110:2574. doi: 10.1021/cr068445e. [DOI] [PubMed] [Google Scholar]
- 21.Prantner AM, Scholler N. J Nanosci Nanotechnol. 2014;14:115. doi: 10.1166/jnn.2014.8899. [DOI] [PubMed] [Google Scholar]
- 22.Weissleder R, Nahrendorf M, Pittet MJ. Nat Mater. 2014;13:125. doi: 10.1038/nmat3780. [DOI] [PubMed] [Google Scholar]
- 23.Bertrand N, Wu J, Xu XY, Kamaly N, Farokhzad OC. Adv Drug Delivery Rev. 2014;66:2. doi: 10.1016/j.addr.2013.11.009. [DOI] [PMC free article] [PubMed] [Google Scholar]
- 24.Kullberg M, McCarthy R, Anchordoquy TJ. J Controlled Release. 2013;172:730. doi: 10.1016/j.jconrel.2013.08.300. [DOI] [PMC free article] [PubMed] [Google Scholar]
- 25.Dawidczyk CM, Kim C, Park JH, Russell LM, Lee KH, Pomper MG, Searson PC. J Controlled Release. 2014;187:133. doi: 10.1016/j.jconrel.2014.05.036. [DOI] [PMC free article] [PubMed] [Google Scholar]
- 26.Chauhan VP, Jain RK. Nat Mater. 2013;12:958. doi: 10.1038/nmat3792. [DOI] [PMC free article] [PubMed] [Google Scholar]
- 27.Park K. ACS Nano. 2013;7:7442. doi: 10.1021/nn404501g. [DOI] [PMC free article] [PubMed] [Google Scholar]
- 28.Dennis CL, Jackson AJ, Borchers JA, Hoopes PJ, Strawbridge R, Foreman AR, van Lierop J, Gruettner C, Ivkov R. Nanotechnology. 2009;20:39. doi: 10.1088/0957-4484/20/39/395103. [DOI] [PMC free article] [PubMed] [Google Scholar]
- 29.Grüttner C, Müller K, Teller J, Westphal F, Foreman A, Ivkov R. J Magn Magn Mater. 2007;311:181. [Google Scholar]
- 30.Natarajan A, Gruettner C, Ivkov R, DeNardo GL, Mirick G, Yuan A, Foreman A, DeNardo SJ. Bioconjugate Chem. 2008;19:1211. doi: 10.1021/bc800015n. [DOI] [PMC free article] [PubMed] [Google Scholar]
- 31.Jokerst JV, Lobovkina T, Zare RN, Gambhir SS. Nanomedicine. 2011;6:715. doi: 10.2217/nnm.11.19. [DOI] [PMC free article] [PubMed] [Google Scholar]
- 32.Moghimi SM, Hunter AC. Trends Biotechnol. 2000;18:412. doi: 10.1016/s0167-7799(00)01485-2. [DOI] [PubMed] [Google Scholar]
- 33.Kirpotin DB, Drummond DC, Shao Y, Shalaby MR, Hong K, Nielsen UB, Marks JD, Benz CC, Park JW. Cancer Res. 2006;66:6732. doi: 10.1158/0008-5472.CAN-05-4199. [DOI] [PubMed] [Google Scholar]
- 34.Jain RK, Stylianopoulos T. Nat Rev Clin Oncol. 2010;7:653. doi: 10.1038/nrclinonc.2010.139. [DOI] [PMC free article] [PubMed] [Google Scholar]
- 35.Banerjee SR, Foss CA, Castanares M, Mease RC, Byun Y, Fox JJ, Hilton J, Lupoid SE, Kozikowski AP, Pomper MG. J Med Chem. 2008;51:4504. doi: 10.1021/jm800111u. [DOI] [PMC free article] [PubMed] [Google Scholar]
Associated Data
This section collects any data citations, data availability statements, or supplementary materials included in this article.


