Abstract
Purpose/Objective
To assess intrafraction respiratory motion using a commercial kilovoltage imaging system for abdominal tumor patients with implanted fiducials and breathing constrained by pneumatic compression during stereotactic body radiotherapy (sbrt).
Methods and Materials
A pneumatic compression belt limited respiratory motion in 19 patients with radiopaque fiducials in or near their tumor during sbrt for abdominal tumors. Kilovoltage images were acquired at 5–6 sec intervals during treatment using a commercial system. Intrafractional fiducial displacements were measured using in-house software. The dosimetric effect of the observed displacements was calculated for three sessions for each patient.
Results
Intrafraction displacement patterns varied between patients and between individual treatment sessions. Averaged over 19 patients, 73 sessions, 7.6% of craniocaudal displacements exceeded 0.5 cm and 1.2% exceeded 0.75 cm. The calculated single session dose to 95% of gross tumor volume (GTVD95) differed from planned by an average of −1.2% (−11.1%−4.8%) but only for 4 patients was total 3-session calculated GTVD95 over 3% different from planned
Conclusions
Our pneumatic compression limited intrafractional abdominal target motion, maintained target position established at setup, and was moderately effective in preserving coverage. Commercially available intrafractional imaging is useful for surveillance but can be made more effective and reliable.
Introduction
Respiratory motion of abdominal tumors can be substantial, particularly in the superior-inferior (SI) direction. Tumor motion poses a particular challenge for stereotactic body radiotherapy (sbrt), where delivery of high doses in few fractions to targets with tight margins demands extreme accuracy at each treatment. Abdominal compression is a simple method of limiting respiratory motion of abdominal and thoracic tumors1–5. An in-house pneumatic compression belt (Figure 1) for abdominal sbrt patients was in clinical use from 2004 to 20095 and replaced with a similar commercially available system (Aktina Medical, Congers, New York) afterwards. Previous reports demonstrated that our system could limit SI respiratory motion to a mean of 0.44 cm (0.1–0.8 cm) during short fluoroscopic sessions. However, its ability to limit intrafractional motion during 10–30 minute sbrt treatments has not been investigated. The aim of this study was to use kilovoltage (kV) images acquired with a commercial system during treatment to study inter- and intrafractional reliability of pneumatic compression during sbrt sessions and consequent effects on target coverage. We report on the first 19 abdominal sbrt patients in our department who received both pneumatic compression and intrafraction imaging. While image-based investigations of intrafraction motion for thoracic cancer patients have been reported6–10, we believe this is the first imaging study of intrafraction motion limited by mechanical compression.
Figure 1.
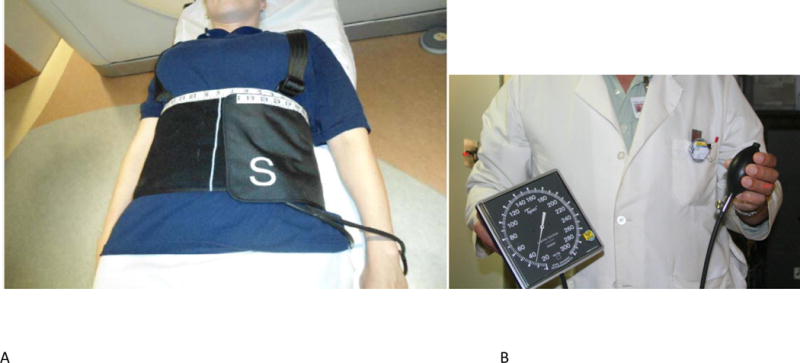
(a) The compression belt. (b) The pressure gauge
Methods
Simulation and planning
An Institutional Review Board/Privacy Board data exemption was approved prior to conducting this study. All patients had abdominal malignancies and either implanted fiducials, surgical clips, or stents in or near their tumor; below, all are called ‘fiducials’.
Each patient was fitted with a belt and evaluated with fluoroscopy just before simulation to determine if tolerable pressure reduced SI fiducial motion to 0.5–0.7 cm. If it did, pressure and belt position were documented and the patient underwent computed tomography (CT) simulation with the documented compression; otherwise, respiratory gating was used. At simulation (GE Discovery ST, GE Healthcare, Waukesha, WI), the patient received customized immobilization and a planning scan (0.2–0.3 cm slices) with compression. Reference 5 and Appendix e1 provide details (www.redjournal.org). Respiratory-correlated scans (RCCT) at this simulator require Varian Real-time Position Management (RPM), which is unreliable for very small chest motion. Therefore, we did not attempt RCCT.
Treatments were planned for sliding window intensity modulated radiation therapy (15 MV or 6 MV photons) using an in-house planning system11,12. Plan goals were to meet departmental normal tissue constraints (Appendix e2) while visually covering the planning target volume (PTV) with the prescription isodose. A physician delineated PTV and gross target volume (GTV), with average PTV to GTV SI margin of 0.5–0.7 cm depending on pre-simulation fluoroscopy and 0.3–0.5 cm transverse margin (3-dimensional GTV expansion), edited as needed for normal tissue protection. Beam arrangements were coplanar. The physician delineated the fiducials to use for setup and intrafraction imaging and expanded them by 0.2–0.3 cm to allow setup flexibility. The fiducial with margin (FWM) centroid coordinates were input to the linac’s software. FWM contours are displayed on the setup orthogonal digitally reconstructed radiographs (DRRs) and on the specially processed DRRs used for intrafraction motion analysis.
Treatment and intrafraction imaging
All treatments were delivered on a Varian TrueBeam linac (control system v 1.5; Varian Medical Systems, Palo Alto CA) which has a gantry-mounted kilovoltage (kV) imager and a utility, IMRLite, that acquires intrafraction kV radiographs. Before each treatment, the belt was applied and pressure set as previously recorded (Appendix e1). The patient was positioned using skin marks. An approximately 15 s AP fluoroscopy was performed to confirm consistency of fiducial motion with pre-simulation fluoroscopy; if not, pressure was increased. Fluoroscopic images were automatically saved in the image review system (Offline Review (OLR), Varian Medical Systems).
Patients then received one or more cone-beam computed tomography (CBCT) scans. TrueBeam’s image registration software was used to determine and apply couch translations that positioned the fiducials in the CBCT scan within the planning scan FWM contours. After physician approval, a final orthogonal pair of kV radiographs was acquired as confirmation.
In IMRLite, intrafraction imaging is triggered by a gating signal from RPM. Rather than rely on the compressed patient’s small chest motion, a periodic motion phantom supplied the triggering signal (approximately 6 second intervals). Thus intrafraction images were not synchronized with breathing. A wide gate was used in order to not unduly increase treatment time. Monitor units (MU) and dose rate (600 MU/min) determined the number of intratreatment kV images for each field. Time between images from consecutive beams depended on gantry motion and field preparation.
Each acquired kV image was displayed with graphically overlaid circles of user-chosen diameter (usually 0.5 cm) centered on the FWM centroid positions established by the setup CBCT/CT registration. This helps the therapist evaluate intrafraction motion in near-real time. After the first 5 patients, therapists were instructed to pause treatment for corrective action (evaluate belt pressure, adjust patient position) after 3 or more consecutive instances (15–18 s) of a fiducial outside its circle. Intrafraction radiographs were automatically saved to OLR, where a 1 cm grid aids qualitative evaluation. But using it for quantitative evaluation of hundreds of images is tedious and error-prone. Therefore, we exported the intrafraction images in DICOM format for further analysis.
Retrospective Analysis of Intrafraction Radiographs
We used purpose-built software to measure the fiducial displacements in the intrafraction radiographs from their positions at simulation13. Specially processed DRRs (hereafter called templates) are generated from the planning CT in a research planning system for manual matching to the intrafraction radiographs. To do this, the user defines a volume of interest (VOI) encompassing all the FWMs with an additional 1–1.5 cm margin. The templates resemble DRRs with improved fiducial visibility. They are automatically generated at 360 equispaced directions through isocenter by ray-tracing through the CT slices within the VOI in beams-eye-view (before 09/2012) or maximum intensity projection through the VOI afterward. This enhances fiducial visibility by removing structures outside the template plane. Any field direction can be selected from the 360 templates. Figure 2a shows a template.
Figure 2.
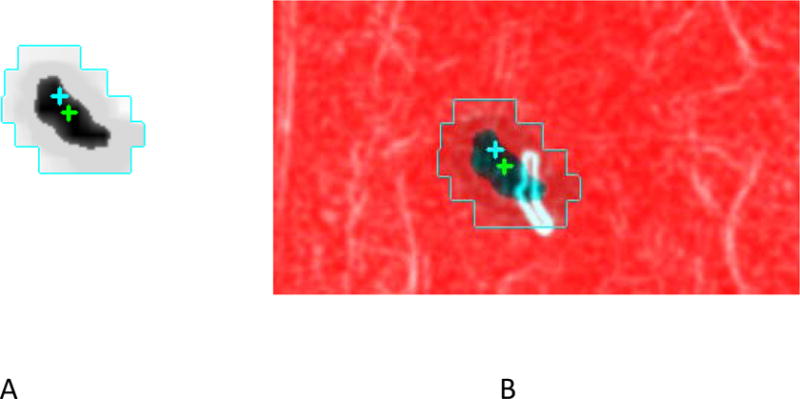
(a) Template created to emphasize the fiducials (b) Template-kV radiograph overlay. Crosses mark isocenters (deliberately separated for display) of the two images.
The intrafraction kV radiographs are imported into a purpose-built 2D image registration program and also processed to enhance fiducial visibility and suppress background features13. Each processed radiograph is displayed side-by-side with and also overlaid on the template image at the same angle. The default display aligns template and radiograph isocenters (Figure 2b) and the user manually shifts the overlaid radiograph to achieve the best (according to user judgment) fiducial match. When there were several fiducials, the best overall match was achieved.
The SI direction is common to all the treatment fields. We denote the orthogonal direction in the radiograph plane, which has a different direction for each field, by X. An SI displacement is negative if fiducials in the intrafraction radiograph are inferior to those in the template. For each radiograph, X and SI displacements are saved to a text file for analysis.
The SI displacements provide information for all beams and approximate the SI component of the fiducial (and by inference, the GTV) trajectory during a session. A fully 3-dimensional session trajectory cannot be obtained from the 2-dimensional IMRLite radiographs. Since our aim is to study intrafraction motion during an entire session, we focus on SI displacements but do not ignore X.
Dosimetric analysis
A third program was written to model the effect of intrafraction motion on GTV coverage using a method described in Reference 14. To supplement measured SI data we approximated axial displacements by calculating the AP and lateral components of the measured X displacements; we refer to the resulting vectors as “2d displacements”. At each control point, MLC leaf positions were shifted in an equal and opposite direction to the fiducial 2d displacements from the kV radiograph closest in time. These modified control points were input to the treatment planning system and the GTV dose was recalculated for three treatment sessions for each patient. We call these ‘delivered’ doses, despite the model’s simplifications.
Results
General characteristics
Patients were treated from 5/2011 through 9/2013. Table 1 shows patient and treatment characteristics. Fiducials were deliberately implanted for 13 patients, 4 had surgical clips, one had a stent and one a stent and a fiducial. For patients with surgical clips, the physician selected 2 or 3 prominent clips, although presence of other clips sometimes complicated the matching process. We matched one fiducial in three patients, 2 in nine, 3 in four and 4 in two. Fraction doses ranged from 6 Gy to 15 Gy. Nine patients received 3 fractions and 10 received 5 fractions. There was a median of 7 beams per plan (range 4–9). Radiographs were of poor quality and could not be analyzed for 3 beams in one session for 2 patients; for 2 other patients, intrafraction imaging was done for the last 3 of 5 sessions. The number of analyzable images ranged from 88 to 429 (median 206) per patient. The estimated imaging skin dose was approximately 0.014 cGy/image.
Table 1.
Patient and Treatment Characteristics. Patients are listed in chronological order of treatment. In describing the fiducials: f = deliberately implanted fiducial marker; c = clips from prior surgery, s = biliary stent.
| Patient/Sex | Treated site | Number and Type of marker | Dose/fraction (Gy) × Number of fractions | Number of beams | Number of images kV |
|---|---|---|---|---|---|
| 1/M | Liver | 4, f | 15 × 3 | 6 | 310 |
| 2/F | Liver | 3,f | 10× 2 + 8 × 1 | 4 | 182 |
| 3/F | Rt Adrenal | 3, c | 9 × 3 | 5 | 190 |
| 4/M | Rt Adrena | 2,f | 8 × 3 | 8 | 186 |
| 5/F | Liver | 4,f | 6 × 5 (last 3 sessions imaged) | 7 | 206 |
| 6/F | Liver | 2, c | 10 × 3 | 5 | 163 |
| 7/F | Pancreas | 2, f | 12 × 3 | 7 | 271 |
| 8/M | Pancreas | 2, f | 6 × 5 | 7 | 135 |
| 9/F | Portacaval node | 2, s | 6 × 5 | 5 | 163 |
| 10/M | Pancreas | 2, f | 6 × 5 | 9 | 429 |
| 11/M | Right hepatic lobe | 1f, 1s | 10 × 3 | 7 | 244 |
| 12/F | Pancreatic tumor bed, recurrence | 2,c | 6 × 5 | 5 | 156 |
| 13/M | Pancreatic tail | 2,f | 8×3 (with integrated boost 10×3) | 7 | 88 |
| 14/M | Pancreatic head | 1,s | 6 × 5 | 9 | 354 |
| 15/M | Pancreatic head | 3,f | 6 × 5 | 7 | 198 |
| 16/F | Aortocaval lymph node | 2,f | 6× 5 | 6 | 225 |
| 17/F | Pancreas head | 2,f | 6 × 5 | 85 | 238 |
| 18/F | Left liver | 3, f | 8 × 3 | 7 | 281 |
| 19/F | Pancreas, recurrence | 1,f | 5 × 5 | 9 | 335 |
The median PTV was 84 cc (range 21–309 cc). On pre-simulation fluoroscopy, free-breathing peak-to-peak SI fiducial excursion ranged from 0.5 cm to 1.5 cm. Compression maintained or reduced excursion to 0.5–0.7 cm (measurement uncertainty +/−0.1 cm). Median pressure was 30 mmHg (range 15–45). Maximum fiducial excursions estimated from the short pre-treatment fluoroscopy averaged 0.36 cm (range 0.2–1.0 cm). Poor fluoroscopic image quality and inter-breath variation complicated these measurements; uncertainty was +/−0.3 cm. To assess repeatability of the template-radiograph matches, the displacement of the first image from each session was independently re-measured for each field of three patients. The average difference was 0.1 cm.
Displacement patterns
The majority of SI displacements and their variability over each session were small. Superior and inferior displacements were approximately equally likely. Because image acquisitions were triggered by a phantom, not patient breathing, we neither expected nor observed periodic motion. Over all patients and sessions, mean SI displacement was 0.01 cm (SD 0.21 cm); 7.6% of SI displacements exceeded 0.5 cm in magnitude and 1.2% exceeded 0.75 cm. On average, X displacements were smaller, with 1.1% exceeding 0.5 cm and 0.07% exceeding 0.75 cm. Figure 3 shows the number of sessions versus the mean magnitudes (light bars) and maximum magnitudes (dark) of the 2d displacements per session. Correlation between X and SI displacements within individual beams is weak and was not pursued. The only systematic changes observed were small drifts (4 patients). We observed no displacement increase over a treatment session or for the last 2 fractions in 5 fraction courses.
Figure 3.
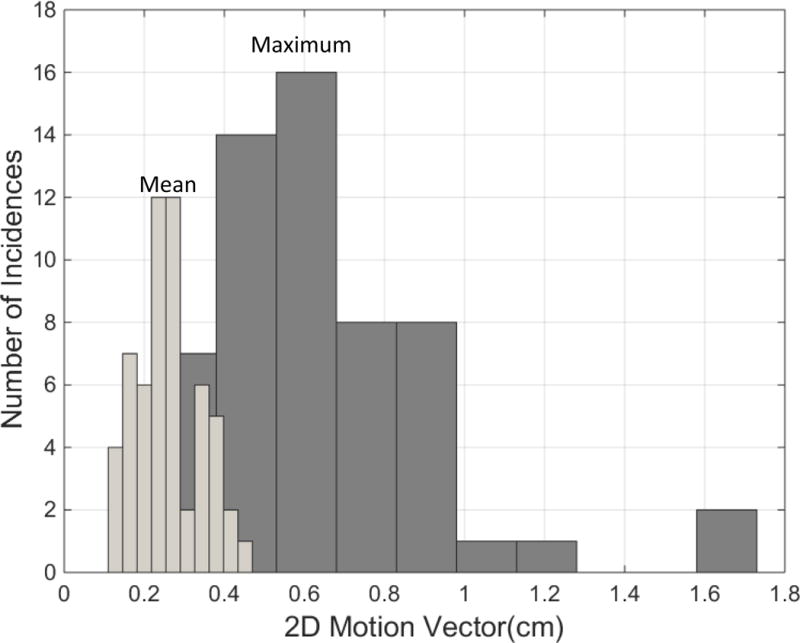
Number of sessions vs session mean and maximum “2d” displacements
Pre-treatment fluoroscopy displacements (0.36 cm averaged over all patients) underestimated intrafraction displacements during the much longer treatment and was poorly correlated with intrafraction displacements (linear correlation coefficient 0.23).
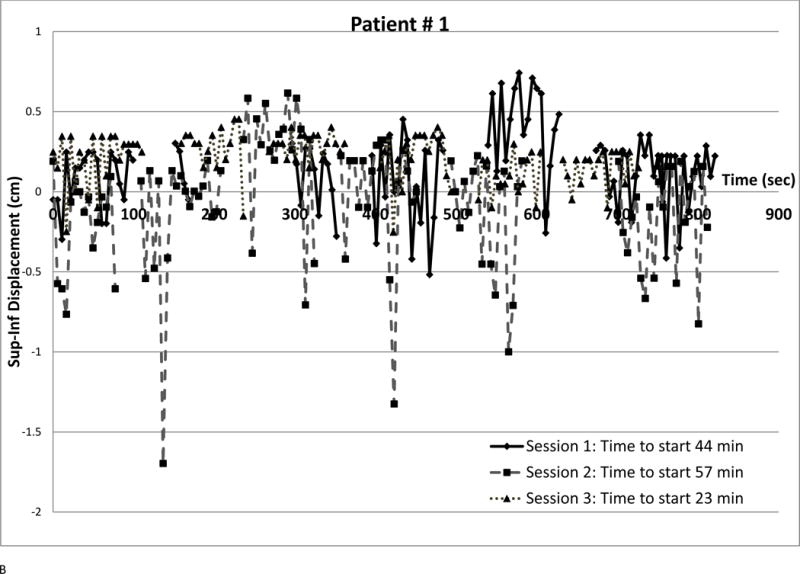
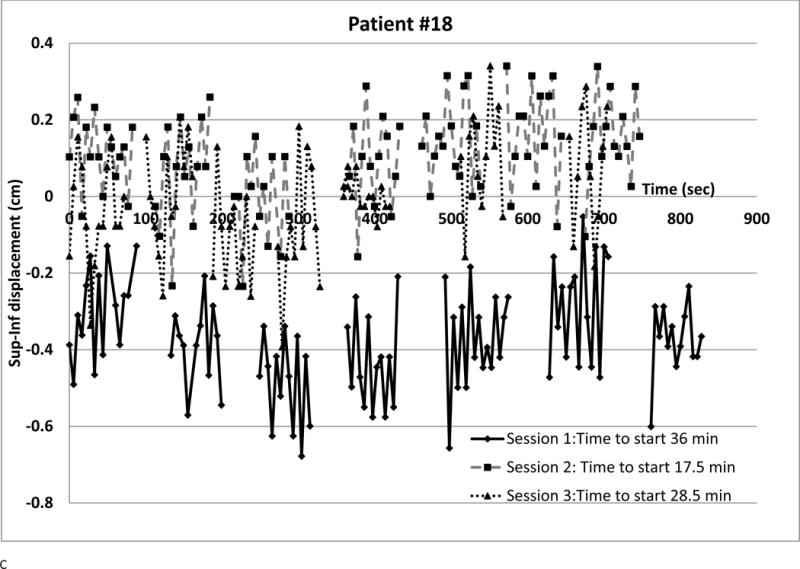
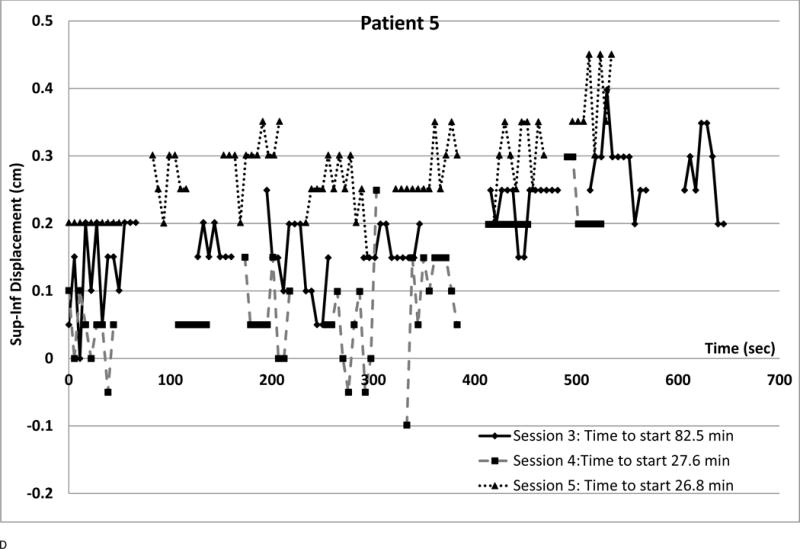
We observed several intra-fraction SI displacement patterns and interfraction changes (shown in Figure 4). Each point represents a radiograph. Different symbols denote different sessions. The vertical axis is SI displacement; for negative displacement, radiograph fiducials are inferior to the template. The horizontal axis is time from first beam-on, approximating phantom period as 5.5 sec. Time between beams was retrieved from the treatment database. Setup times are in the legends; they are often longer (over all sessions, median 25.7 min, range 7–82.5 min) than treatment delivery time (median 10.2 min, range 5.2–36.8 min)
Figure 4. Displacement patterns for different patients and sessions.
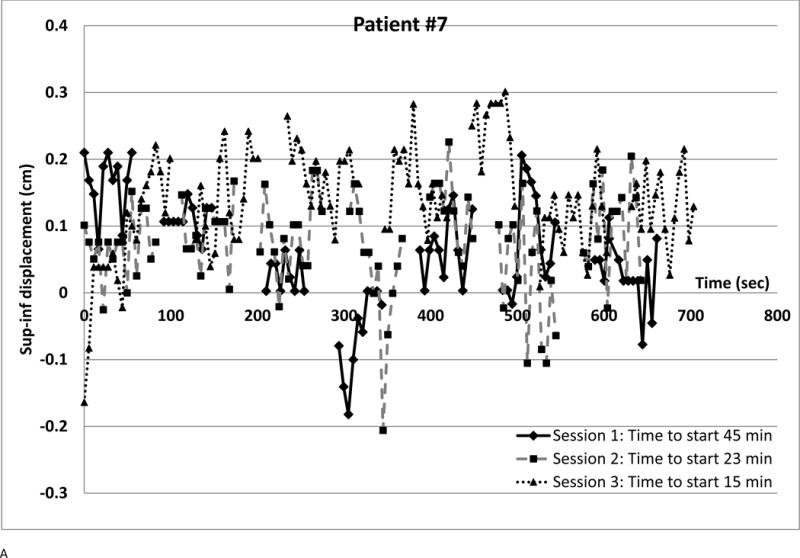
(a) Small displacements, small variability at all sessions
(b) Large inspiration spikes at session 2 (c) Setup error but little intrafraction variation at Session 1; small displacements thereafter.
(d) Drift in all sessions
Figure 4a is a best-case scenario; small displacements and little intrafraction variation throughout treatment. Each session’s standard deviation (SD) was 0.08 cm and all SI displacements had magnitudes below 0.3 cm. This pattern was seen in 3 patients, in two of whom all and in one 97.4% of X displacements were below 0.5 cm.
Figure 4b shows SI displacements for a patient where a linac problem prolonged Session 2. Discomfort may have caused three deep inhalations (> 1 cm, largest 1.7 cm) despite compression though elsewhere displacements were much smaller. Smaller deep inhalations were observed for 5 other patients. There was transient superior displacement at the fourth beam in the first session and minimal displacement at the third session. Overall, 9.4% of SI and 3.2% of X displacement magnitudes exceeded 0.5 cm; 1.6 % of SI exceeded 0.75 cm.
For the first session of the patient of Figure 4c, fiducials were approximately 0.3 cm inferior of simulation position and small changes sometimes drove SI displacement beyond 0.5 cm. Setup error or gross motion between setup and beam-on may have caused systematic displacement. All X and all the other session’s SI displacement magnitudes were below 0.5 cm. Daily variations were small (SD below 0.16 cm). Overall, 4.6% of SI displacements exceeded 0.5 cm. Apparent setup error affecting one session was seen in 5 other patients.
Systematic drift over consecutive fields is shown in Figure 4D, the patient with greatest drift. Nonetheless, all displacements were below 0.5 cm. This intrafraction imaging was done for only the last 3 sessions of a 5 fraction treatment. Three other patients showed drift over two or more consecutive fields.
Dosimetric consequences
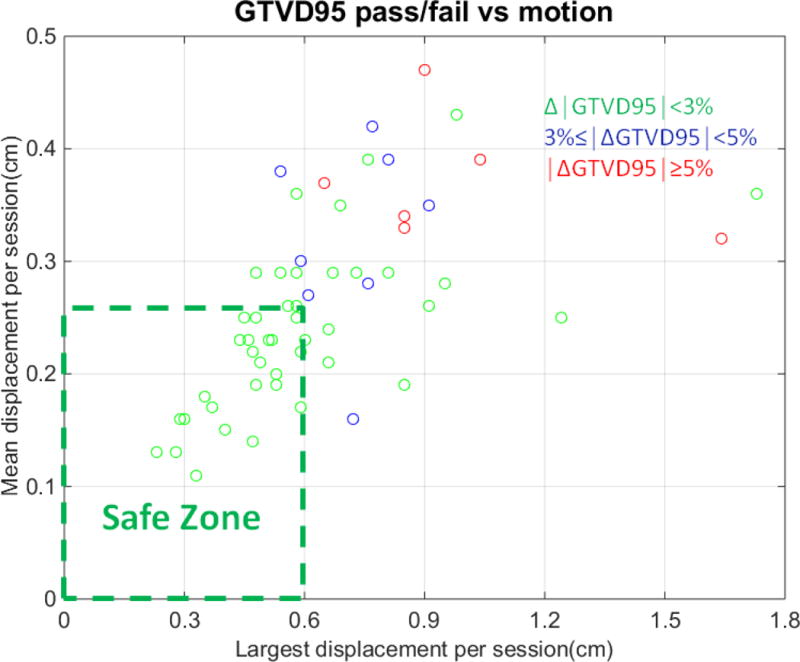
The calculated difference between a session’s ‘delivered’ and planned dose to 95% of the GTV (GTVD95) ranged from −11% to 4.8 % (average −1.2 %). Figure 5a shows number of sessions versus percent difference between delivered and planned GTVD95. In 25 % of sessions, difference from planned was more than 3%. However because displacement patterns can vary between sessions, only 4 patients had total (for 3 recalculated sessions) ‘delivered’ GTVD95 deviations exceeding 3% (−3.9%, −4.1%, −4.9%, −6.1%). Figure 5b identifies a ‘safe zone’ of 2d displacement magnitudes within which session GTVD95 is within 3% of planned. The zone borders are session mean displacement < 0.25 cm and maximum displacement < 0.6 cm. Within this zone the PTV margins are sufficient to maintain GTV coverage despite intrafraction motion. Several instances of <3% coverage degradation outside the zone suggest that pre-calculating an individualized safe zone for a specific plan might be a helpful strategy.
Figure 5.
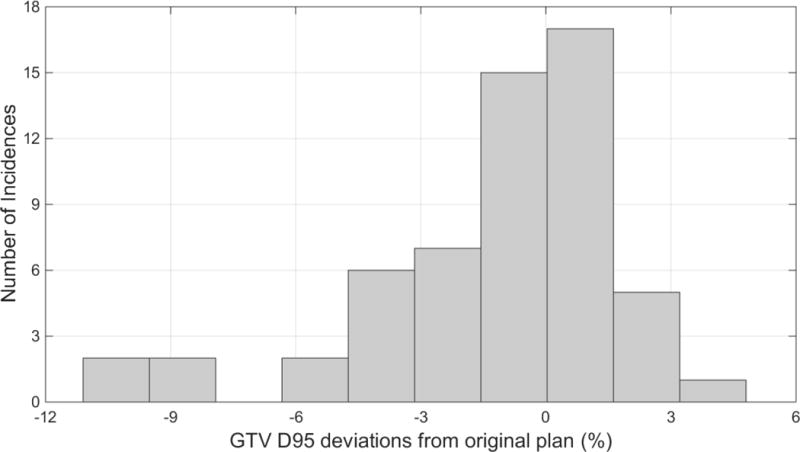
(a) Number of cases vs GTV D95 change due to intrafraction motion
(b) Displacement ‘safe zone’, within which GTV D95 differs by ≤ 3% from plan due to intrafraction motion
Discussion
Intrafraction kV radiographic imaging on a linac was used to evaluate respiratory abdominal tumor motion in sbrt patients constrained by pneumatic compression. Implanted radiopaque materials were tumor surrogates. We observed different displacement patterns (Figure 4). For our approximately 0.5 cm GTV-PTV margins, pneumatic abdominal compression and fiducial-based image-guided setup prior to each fraction was moderately effective in maintaining planned GTV coverage over a treatment course. However, GTV D95 was reduced by over 3% in 25% of sessions.
Several studies report respiratory motion reduction by abdominal compression. Reference 2 used RCCT for 10 liver and lower-lung patients, finding that a commercial “high compression” system reduced mean 3-dimensional tumor motion from 13.6 mm (2 SD 11.5–15.6 mm) without compression to 7.2 mm (2 SD 5.4–9.0 mm). Reference 3 used RCCT to study respiratory motion for 24 lung cancer patients and compared two commercial compression systems by measuring fiducial displacement between pre and post sbrt treatment CBCTs. Reference 4 used cine MRI for 60 liver tumor patients; an in-house compression plate reduced mean tumor SI motion from 11.7 mm (4.8–23.3 mm) to 9.4 mm (1.6–23.4 mm) with large inter-patient variation in motion reduction.
Kilovoltage image-based intrafraction motion monitoring is integral to CyberKnife™15, but relatively new on conventional linacs. Several studies investigate applications to respiratory motion. Reference 16 describes a real-time system (RTRT) with comprehensive capabilities. It automatically tracks 3-dimensional implanted marker motion using four room-mounted fluoroscopy systems and enables treatment when the marker is within a user-set window. RTRT was used in lung tumor treatments6 and investigation of external –internal motion correlation for free-breathing liver patients7. Fluoroscopy dose is a limitation17. The RTRT system was available in Japan but not commercially in the United States. Reference 8 describes a novel setup method, estimating the 3-dimensional trajectory of implanted gold seeds using CBCT projection images and matching these with the simulation RCCT. For 10 liver tumor sbrt patients, setup accuracy was improved. Intrafraction imaging was not reported. Reference 9 imaged fiducials with a linac-mounted kV imager for 1–4 sessions of hypofractionated treatment in 20 thoracic tumor patients undergoing volumetric modulated arc therapy (VMAT) gated around end-exhale. Internal target volume (ITV) was determined by RCCT. At each setup, the gate was modified using fluoroscopy such that beam-on occurred only when fiducials were within the ITV contour. Kilovoltage images were acquired upon entrance into the gate and custom software detected the fiducials. They found gating based on target position preferable to using the RPM external surrogate. Reference 10 studied dosimetric motion effects in 6 free-breathing liver sbrt patients receiving VMAT. They used 5 Hz kV fluoroscopy supplemented by lower frequency MV imaging to map the 3-dimensional trajectory of implanted gold markers segmented with in-house software. Motion decreased calculated clinical target volume D95 by 6%.
We found that pneumatic compression with pressure determined before simulation and confirmed with kV imaging before each treatment, combined with therapist surveillance of intrafraction kV images was moderately effective at preserving planned GTV coverage. Improvement without increasing margins might be achieved by stricter enforcement of policy related to intrafraction correction, though this could create personnel problems in a busy clinic. Establishing a patient-specific safe zone during treatment planning18 might be helpful; if required displacement tolerance is unfeasibly tight, PTV margin increase would be indicated. Reducing treatment and setup time (VMAT, faster setup workflow) would improve patient comfort, clinical efficiency and perhaps accuracy. But automatic fiducial detection with automatic correction or alerts when fiducials are outside tolerances is a preferable solution. Such features exist (CyberKnife™ (radiographic) and Calypso™ (non-radiographic)) but not radiographically on conventional linacs to provide fiducial-based tracking using a robust internal signal6,7,15.
Our study has several limitations. Initial setup requires matching the fiducials on the planning CT with those on the CBCT. Compression limits but does not completely prevent fiducial motion so both images are subject to motion artifacts; distortion on the rapid planning CT, blurring on the slowly acquired CBCT. Though this needs further study, we do not think it is a major problem because only one planning scan showed small ‘mushroom’ artifacts and large fiducial displacements were rare. The small study size (19 patients) is another limitation. Our GTV-PTV margin may be inadequate partly because no ITV was used since RCCT was not performed at simulation. But even reliable simulation RCCT- a few minutes on simulation day- is unlikely to account for the various motions observed during treatments. Imaging in this study required a phantom RPM signal but current TrueBeam software allows intrafraction imaging at user-chosen times or MUs. Finally, our study only approximates 3-dimensional motion. Consistent 3 -dimensional information (e.g. MV-KV imaging during VMAT treatment) might lead to better on-line correction and margin strategies.
Summary.
Nineteen abdominal cancer patients were treated with stereotactic body radiotherapy (3–5 treatments) using pneumatic compression for motion management. Gantry-mounted kilovoltage imaging of radiopaque fiducials in or near the target was performed at 5–6 sec intervals during treatment. Displacement from planned position was measured in each image; the dosimetric effect of measured displacement on target coverage was calculated. Pneumatic compression combined with fiducial-based image-guided setup maintains planned dose to visible tumor. Intrafraction imaging provides valuable confirmation.
Acknowledgments
This research was funded in part through the NIH/NCI Cancer Center Support Grant P30CA008748.
Footnotes
Publisher's Disclaimer: This is a PDF file of an unedited manuscript that has been accepted for publication. As a service to our customers we are providing this early version of the manuscript. The manuscript will undergo copyediting, typesetting, and review of the resulting proof before it is published in its final citable form. Please note that during the production process errors may be discovered which could affect the content, and all legal disclaimers that apply to the journal pertain.
Ellen Yorke, No Conflicts of Interest; Ying Xiong, No Conflicts of Interest; Qian Han, No Conflicts of Interest; Pengpeng Zhang, No Conflicts of Interest; Gikas Mageras, Varian Medical Systems (travel support); Michael Lovelock, No Conflicts of Interest; Hai Pham, No Conflicts of Interest; Jian-Ping Xiong, No Conflicts of Interest; Karyn A. Goodman, No Conflicts of Interest
References
- 1.Benedict SH, Yenice KM, Followill D, et al. Stereotactic body radiation therapy: the report of AAPM Task Group 101. Med Phys. 2010;37:4078–4101. doi: 10.1118/1.3438081. [DOI] [PubMed] [Google Scholar]
- 2.Heinzerling JH, Anderson JF, Papiez L, et al. Four-dimensional computed tomography scan analysis of tumor and organ motion at varying levels of abdominal compression during stereotactic treatment of lung and liver. Int J Radiat Oncol Biol Phys. 2008;70:1571–1578. doi: 10.1016/j.ijrobp.2007.12.023. [DOI] [PubMed] [Google Scholar]
- 3.Han K, Cheung P, Basran PS, et al. A comparison of two immobilization systems for stereotactic body radiation therapy of lung tumors. Radiother Oncol. 2010;95:103–108. doi: 10.1016/j.radonc.2010.01.025. [DOI] [PubMed] [Google Scholar]
- 4.Eccles CL, Patel R, Simeonov A, et al. Comparison of liver tumor motion with and without abdominal compression using cine-magnetic resonance imaging. Int J Radiat Oncol Biol Phys. 2011;79:602–608. doi: 10.1016/j.ijrobp.2010.04.028. [DOI] [PubMed] [Google Scholar]
- 5.BLINDED
- 6.Shimizu S, Shirato H, Ogura S, et al. Detection of lung tumor movement in real-time tumor-tracking radiotherapy. Int J Radiat Oncol Biol Phys. 2001;51:304–310. doi: 10.1016/s0360-3016(01)01641-8. [DOI] [PubMed] [Google Scholar]
- 7.Nishioka T, Nishioka S, Kawahara M, et al. Synchronous monitoring of external/internal respiratory motion: validity of respiration-gated radiotherapy for liver tumors. Jpn J Radiol. 2009;17:285–89. doi: 10.1007/s11604-009-0332-5. [DOI] [PubMed] [Google Scholar]
- 8.Worm ES, Høyer M, Fledelius W, et al. On-line use of three-dimensional marker trajectory estimation from cone-beam computed tomography projections for precise setup in radiotherapy for targets with respiratory motion. Int J Radiat Oncol Biol Phys. 2012;83:e145–51. doi: 10.1016/j.ijrobp.2011.12.007. [DOI] [PubMed] [Google Scholar]
- 9.Li R, Mok E, Chang DT, et al. Intrafraction verification of gated RapidArc by using beam-level kilovoltage x-ray images. Int J Radiat Oncol Biol Phys. 2012;83:e709–e715. doi: 10.1016/j.ijrobp.2012.03.006. [DOI] [PMC free article] [PubMed] [Google Scholar]
- 10.Poulsen PR, Worm ES, Petersen JB, et al. Kilovoltage intrafraction motion monitoring and target dose reconstruction for stereotactic volumetric modulated arc therapy of tumors in the liver. Radiother Oncol. 2014;111:424–30. doi: 10.1016/j.radonc.2014.05.007. [DOI] [PubMed] [Google Scholar]
- 11.Spirou SV, Chui CS. Generation of arbitrary intensity profiles by combining the scanning beam with dynamic multileaf collimation. Med Phys. 1996;23:1. doi: 10.1118/1.597672. [DOI] [PubMed] [Google Scholar]
- 12.Burman C, Chui CS, Kutcher Gl, et al. Planning, delivery, and quality assurance of intensity-modulated radiotherapy using dynamic multileaf collimator: a strategy for large-scale implementation for the treatment of carcinoma of the prostate. Int J Radiat Oncol Biol Phys. 1997;39:863–73. doi: 10.1016/s0360-3016(97)00458-6. [DOI] [PubMed] [Google Scholar]
- 13.BLINDED
- 14.BLINDED
- 15.Dietrich S, Cavedon C, Chuang CF, et al. Report of AAPM TG 135. Quality assurance for robotic radiosurgery. Med Phys. 2011;38:2914–2935. doi: 10.1118/1.3579139. [DOI] [PubMed] [Google Scholar]
- 16.Shirato H, Shimizu S, Kunieda T, et al. Physical aspects of a real-time tumor-tracking system for gated radiotherapy. Int J Radiat Oncol Biol Phys. 2000;48:1187–95. doi: 10.1016/s0360-3016(00)00748-3. [DOI] [PubMed] [Google Scholar]
- 17.Shirato H, Oita MM, Fujita K, et al. Feasibility of synchronization of real-time tumor-tracking radiothermy and intensity-modulated radiotheray from viewpoint of excessive dose from fluoroscopy. Int J Radiat Oncol Biol Phys. 2004;60:335–341. doi: 10.1016/j.ijrobp.2004.04.028. [DOI] [PubMed] [Google Scholar]
- 18.BLINDED


